概述
反转双MACD交易策略是一个利用MACD指标识别趋势反转信号的量化交易策略。该策略同时结合了RVI指标和CCI指标来确认买入时机,以过滤掉一些假反转。本策略适用于日内和短线交易。
策略原理
策略主要基于MACD指标。MACD为较快移动平均线EMA(12)减去较慢移动平均线EMA(26)得到快线,再用SIGNAL(9)作为慢线。当快线上穿慢线产生 Golden Cross时看涨;当快线下穿慢线产生 Dead Cross 时看跌。
该策略运用双时间周期MACD指标寻找反转机会。策略使用6小时级别MACD判断总体趋势方向,日内1小时级别MACD寻找反转信号。当6小时MACD处于上升趋势时,1小时级别如果出现快线下穿慢线的死叉信号,说明价格可能反转上涨。此时结合RVI指标和CCI指标进一步确认,产生买入信号。
RVI指标测量最新几根K线的收盘价和开盘价与最高价和最低价的关系。当RVI低于0.2时被认为是超卖。CCI指标小于-100时表示超卖。所以策略利用RVI指标低于0.2 和 CCI指标低于-95这两个条件来辅助确认买入信号。
优势分析
该策略结合双时间周期MACD以及RVI和CCI指标,可以比较准确地识别反转机会,过滤掉部分假反转信号,从而提高策略的稳定性。具体优势如下:
利用6小时级别MACD判断大趋势,避免在大盘不确定性加大的环境中交易。
1小时级别MACD识别反转时机,可以捕捉较短周期内的价格调整。
RVI指标和CCI指标的结合使用,可以更准确判断反转的时机。
策略加入止损点,可以减少亏损。
风险分析
该策略也存在一定的风险,主要体现在:
MACD指标本身容易产生假信号,所以即使辅助指标过滤效果较好,也无法完全避免亏损。建议降低仓位规模。
RVI指标和CCI指标可能发出错误信号,从而错过较好的反转机会或增加不必要的亏损。建议合理调整RVI和CCI参数。
止损点设置不当可能过于密集触发止损,也可能过于宽松无法及时控制损失。建议根据市场波动程度调整止损幅度。
优化方向
该策略可以从以下几个方面继续优化:
当前使用1小时和6小时两个时间周期,可以测试更多时间周期组合,寻找更稳定的参数。
可以引入更多指标,如KDJ、WR、OBV等来辅助判断买卖点。但要防止产生过于复杂的交易信号。
可以根据不同品种参数不断优化,设立参数库。如适合中低频交易的品种可以适当加长参数周期。
可以设置动态止损机制,在盈利后逐步挪动止损点。或根据市场波动程度实时调整止损幅度。
总结
反转双MACD交易策略综合考虑趋势判断和反转信号,并辅以RVI和CCI指标过滤信号。该策略可以有效识别短线调整提供较好的风险回报比,适合日内和短线交易,也可作为多策略组合的一部分,提供整体策略的多样性。
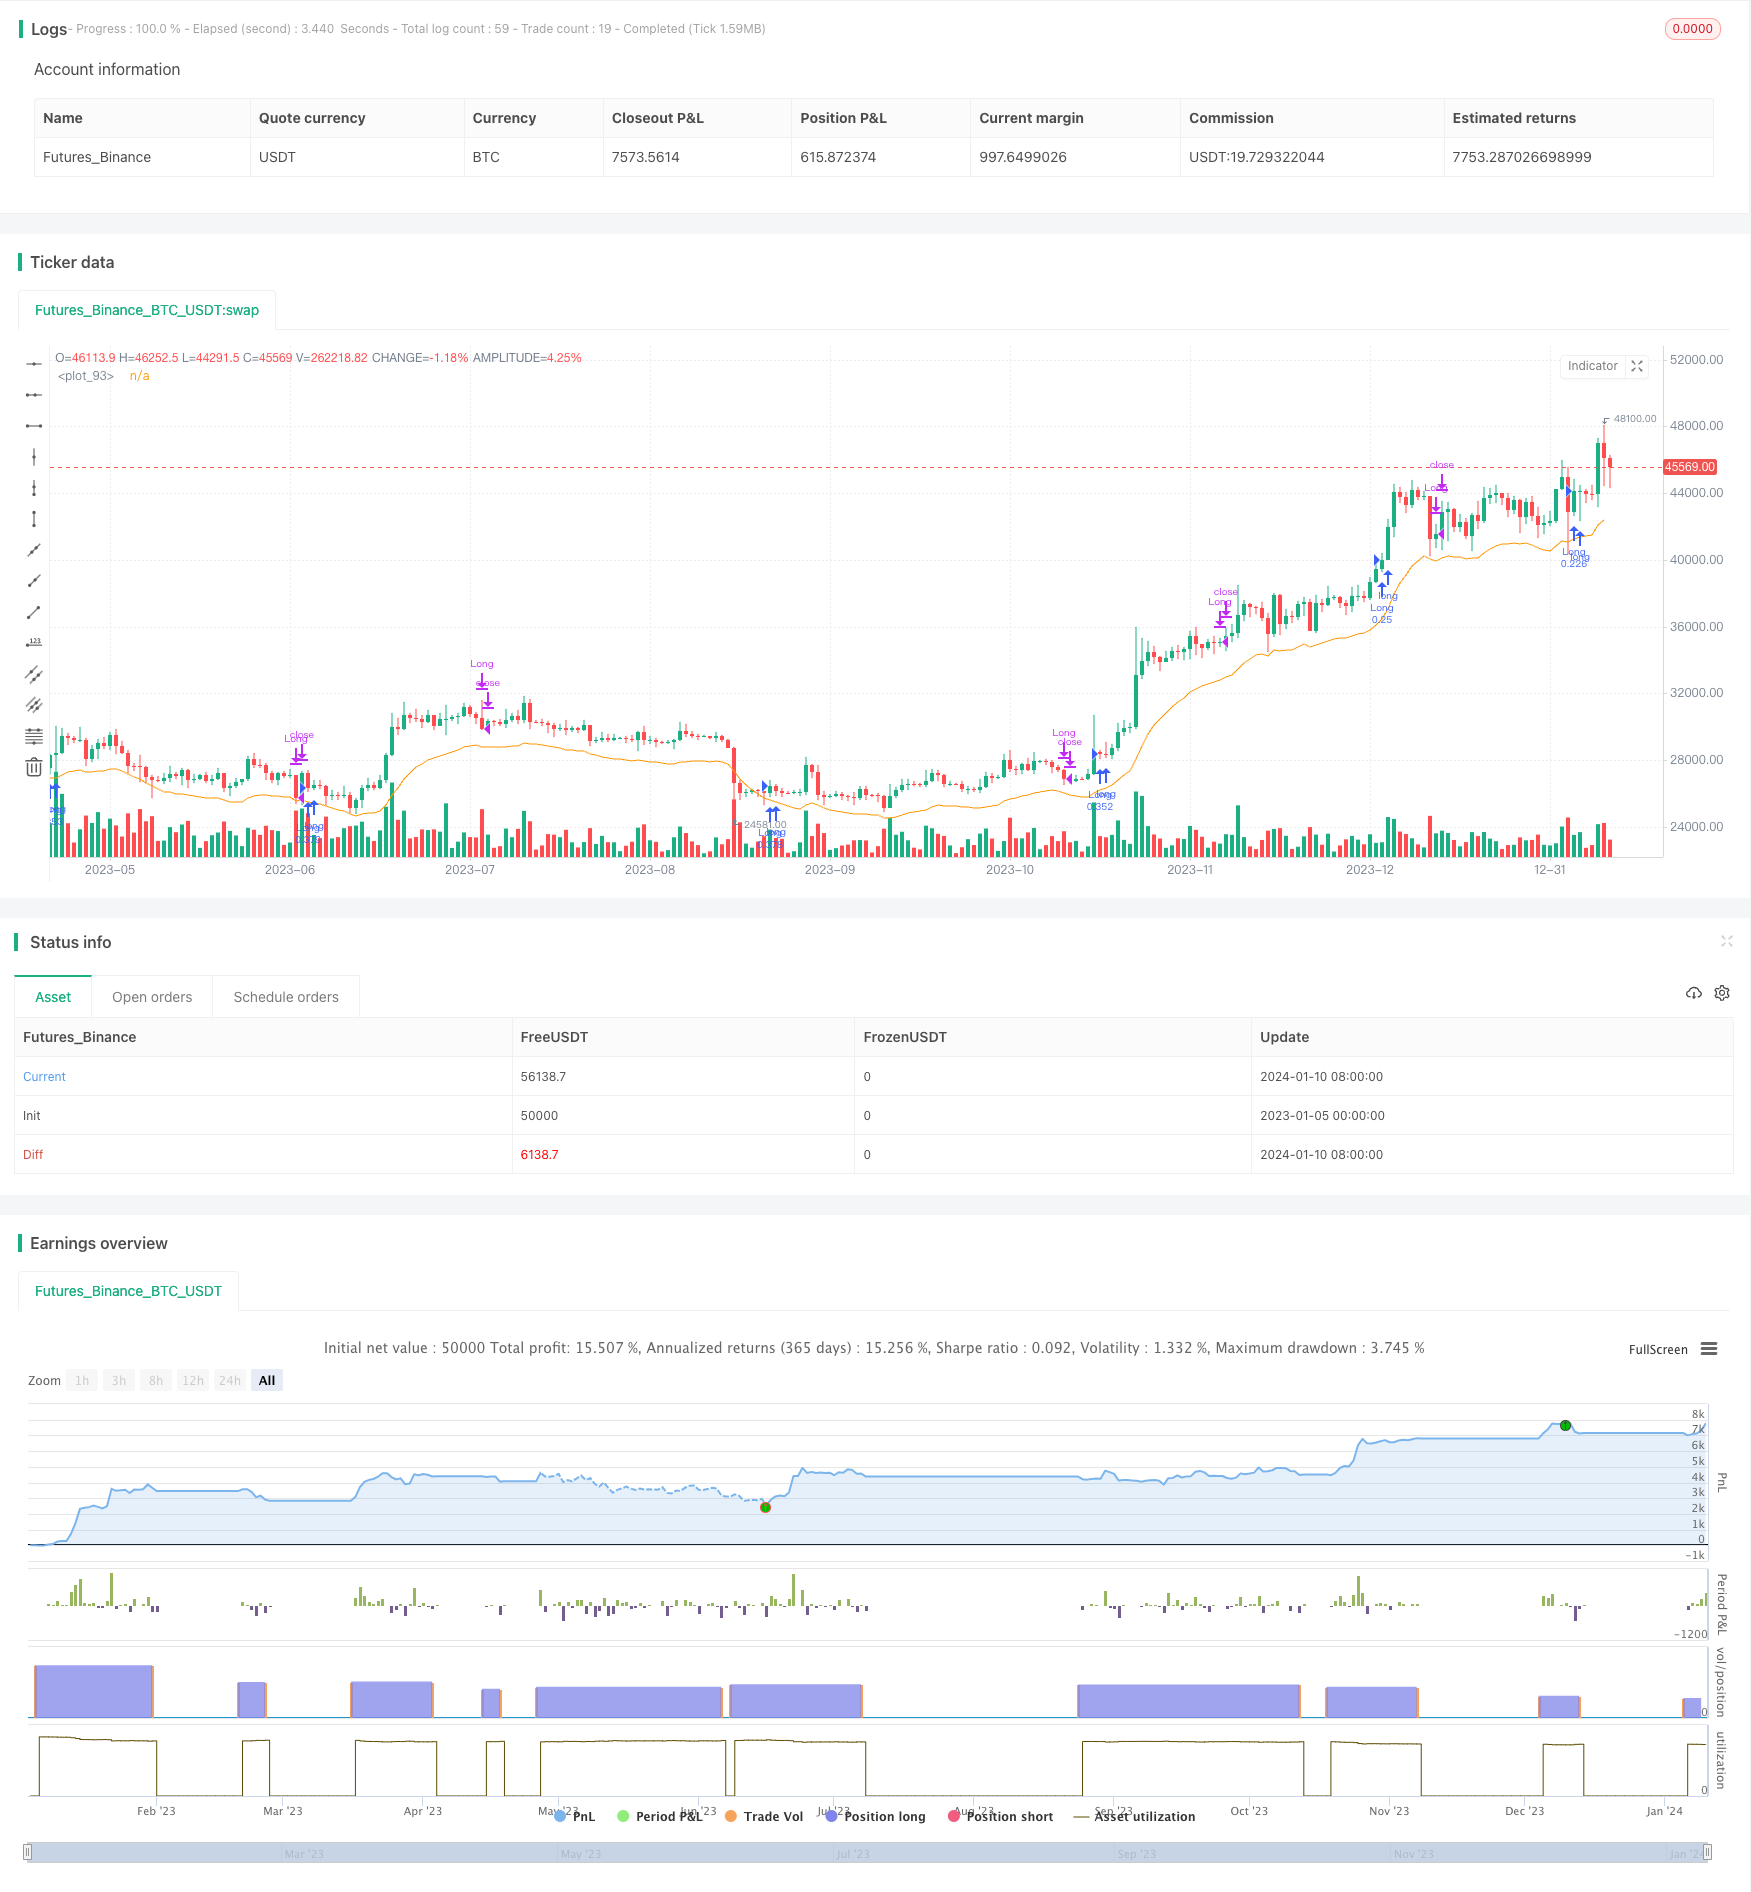
/*backtest
start: 2023-01-05 00:00:00
end: 2024-01-11 00:00:00
period: 1d
basePeriod: 1h
exchanges: [{"eid":"Futures_Binance","currency":"BTC_USDT"}]
*/

//@version=3
strategy("Bat MACD", overlay=true)

fastLength = input(12)
slowlength = input(26)
MACDLength = input(9)
h=1.05

MACD = ema(close, fastLength) - ema(close, slowlength)
aMACD = ema(MACD, MACDLength)
delta = MACD - aMACD
hmacd= aMACD>0? h*aMACD: -(1/h)*abs(MACD)

MACDD= (request.security(syminfo.tickerid,'360',ema(close, fastLength)) - request.security(syminfo.tickerid,'360',ema(close,slowlength)))
aMACDD = (request.security(syminfo.tickerid,'360',ema(ema(request.security(syminfo.tickerid,'360',close), fastLength)-ema(request.security(syminfo.tickerid,'360',close),slowlength), MACDLength)))
deltad= MACDD-aMACDD
L= input(0.95, title="SL")
SL = L*ema(close,10)

//MACD
slow = input(26,"Short period")
fast = input(12, "Long period")
signal = input(9, "Smoothing period")
//MACD = ema(close,fast)-ema(close,slow)
dMACD= MACD<0? ema(MACD,5):0
Mcond= rising(dMACD,1)
mcount=0.0
mcount := Mcond ? nz(mcount[1]) + 1 : nz(mcount[1])
counter=0
counter := (mcount-mcount[1]==0) ? nz(counter[1]) + 1 : 0
//counter := counter==3 ? 0: nz(counter[1])
pp=0.0
mc=0.0
pp:= (counter-counter[1]<0)? close[1] : nz(pp[1])
mc:= (counter-counter[1]<0)? MACD[1] : nz(mc[1])

bull = (pp-pp[1]<-close*0.005 and mc-mc[1]>0.02*abs(MACD) and MACD<0 and MACD[1]<0)? 1:0

//bgcolor(bull?green:white)
//RVI
p=10
CO=close-open
HL=high-low
value1 = (CO + 2*CO[1] + 2*CO[2] + CO[3])/6
value2 = (HL + 2*HL[1] + 2*HL[2] + HL[3])/6
num=sum(value1,p)
denom=sum(value2,p)
rvi=denom!=0?num/denom:0

//RVI
drvi= (rvi<0.2)? ema(rvi-0.20,3):0
RVcond= rising(drvi,1)
rvcount=0.0
rvcount := RVcond ? nz(rvcount[1]) + 1 : nz(rvcount[1])
rvcounter=0
rvcounter := (rvcount-rvcount[1]==0) ? nz(rvcounter[1]) + 1 : 0
//counter := counter==3 ? 0: nz(counter[1])
rvpp=0.0
rvmc=0.0
rvpp:= (rvcounter-rvcounter[1]<0)? close[1] : nz(rvpp[1])
rvmc:= (rvcounter-rvcounter[1]<0)? drvi[1] : nz(rvmc[1])
rvbull = (rvpp-rvpp[1]<-close*0.005 and rvmc-rvmc[1]>0.02 and drvi<0 and drvi[1]<0)? 1:0

//VolCCI
length1 = input(10, minval=1)
xMAVolPrice = ema(volume * close, length1)
xMAVol = ema(volume, length1)
src1 = xMAVolPrice / xMAVol
map = sma(src1, length1)
cci = (src1 - map) / (0.015 * dev(src1, length1))
cfi= (cci<0)? ema(cci,3) :0
CCcond= rising(cfi,1)
cccount=0.0
cccount := CCcond ? nz(cccount[1]) + 1 : nz(cccount[1])
cccounter=0
cccounter := (cccount-cccount[1]==0) ? nz(cccounter[1]) + 1 : 0
//counter := counter==3 ? 0: nz(counter[1])
ccpp=0.0
ccmc=0.0
ccpp:= (cccounter-cccounter[1]<0)? close[1] : nz(ccpp[1])
ccmc:= (cccounter-cccounter[1]<0)? cci[1] : nz(ccmc[1])
ccbull = (ccpp-ccpp[1]<-close*0.003 and ccmc-ccmc[1]>20 and cci<-95 and cci[1]<-95)? 1:0

A= bull+ccbull+rvbull
if ((MACD>hmacd)  and deltad>0 and delta>delta[1])
    strategy.entry("Long", strategy.long, comment="Buy", qty=10000/close)
if (crossunder(delta, 0) or crossunder(close,SL))
    strategy.close("Long")
if(crossover(low,SL) and SL-SL[1]<close*0.005 and SL-SL[1]>-close*0.005)
    strategy.entry("Long", strategy.long, comment="Buy", qty=10000/close)
if A
    strategy.entry("Long", strategy.long, comment="Buy", qty=10000/close)
plot(SL)

//plot(strategy.equity, title="equity", color=red, linewidth=2, style=areabr)