Befolgen Sie geduldig die Trendfolgestrategie
Überblick
Eine geduldige Trend-Tracking-Strategie ist eine Trend-Following-Strategie. Sie nutzt eine Kombination von Indikatoren des Moving Averages, um die Richtung des Trends zu bestimmen, und in Verbindung mit dem Überkauf-Überverkauf-Indikator CCI, um ein Handelssignal zu senden. Die Strategie verfolgt die große Tendenz und kann in einem wackligen Umfeld effektiv vermieden werden.
Strategieprinzip
Die Strategie verwendet eine Kombination von 21- und 55-Zyklen EMAs, um die Richtung des Trends zu bestimmen. Kurzfristige EMAs werden als Aufwärtstrend definiert, wenn sie über langfristigen EMAs liegen, und als Abwärtstrend, wenn sie unter langfristigen EMAs liegen.
Der CCI-Indikator wird verwendet, um Überkauf-Überverkauf zu beurteilen. Der CCI-Ober-100 ist das unterste Überverkaufssignal und der CCI-Unter-100 ist das oberste Überkaufssignal. Die Strategie ist in drei Handelssignalstärken unterteilt, je nach den verschiedenen Überkauf-Überverkaufslinien des CCI-Indikators.
Wenn der CCI-Indikator als Aufwärtstrend beurteilt wird, wird ein starker Unter-Überverkaufssignal ausgegeben. Wenn der CCI als Abwärtstrend beurteilt wird, wird ein starker Top-Überkaufssignal ausgegeben.
Die Stop-Loss-Linie ist als SuperTrend-Indikator eingestellt, der Zielgewinn als feste Anzahl von Punkten.
Analyse der Stärken
Diese Strategie hat folgende Vorteile:
- Beobachten Sie die Trends und vermeiden Sie, in die Falle zu geraten
- Der CCI-Wert ist ein guter Indikator für die Umkehrpunkte.
- Die SuperTrend Stop-Line ist vernünftig eingestellt.
- Fixed Stop Loss und Fixed Stop Stop, Risiken sind kontrollierbar
Risikoanalyse
Diese Strategie birgt folgende Risiken:
- Die Wahrscheinlichkeit von Trendfehlern
- Wahrscheinlichkeit, dass der CCI-Indikator falsche Signale sendet
- Die Wahrscheinlichkeit, dass ein unnötiges Stoppschaden zu einem zu schwachen oder zu tiefen Stoppschaden führt
- Die Wahrscheinlichkeit, dass ein fester Stop-Off den Trend nicht kontinuierlich verfolgt
Für diese Risiken können wir optimieren, indem wir die EMA-Zyklusparameter, die CCI-Parameter und die Stop-Loss-Stopp-Punkt-Parameter anpassen. Es ist auch notwendig, mehr Indikatoren für die Strategie-Signal-Verifizierung einzuführen.
Optimierungsrichtung
Die Optimierung der Strategie basiert auf folgenden Aspekten:
Versuchen Sie, eine Kombination aus mehr Indikatoren zu testen, um bessere Trends zu erkennen, sowie Signal-Verifizierungsindikatoren.
Nutzung von ATR-Dynamic Stop Loss Stop, um Trends besser zu verfolgen und Risiken zu kontrollieren.
Einführung eines maschinellen Lernmodells, das auf historischen Daten basiert, um die Wahrscheinlichkeit von Trends zu bestimmen.
Anpassung und Optimierung der Parameter für verschiedene Sorten.
Zusammenfassen
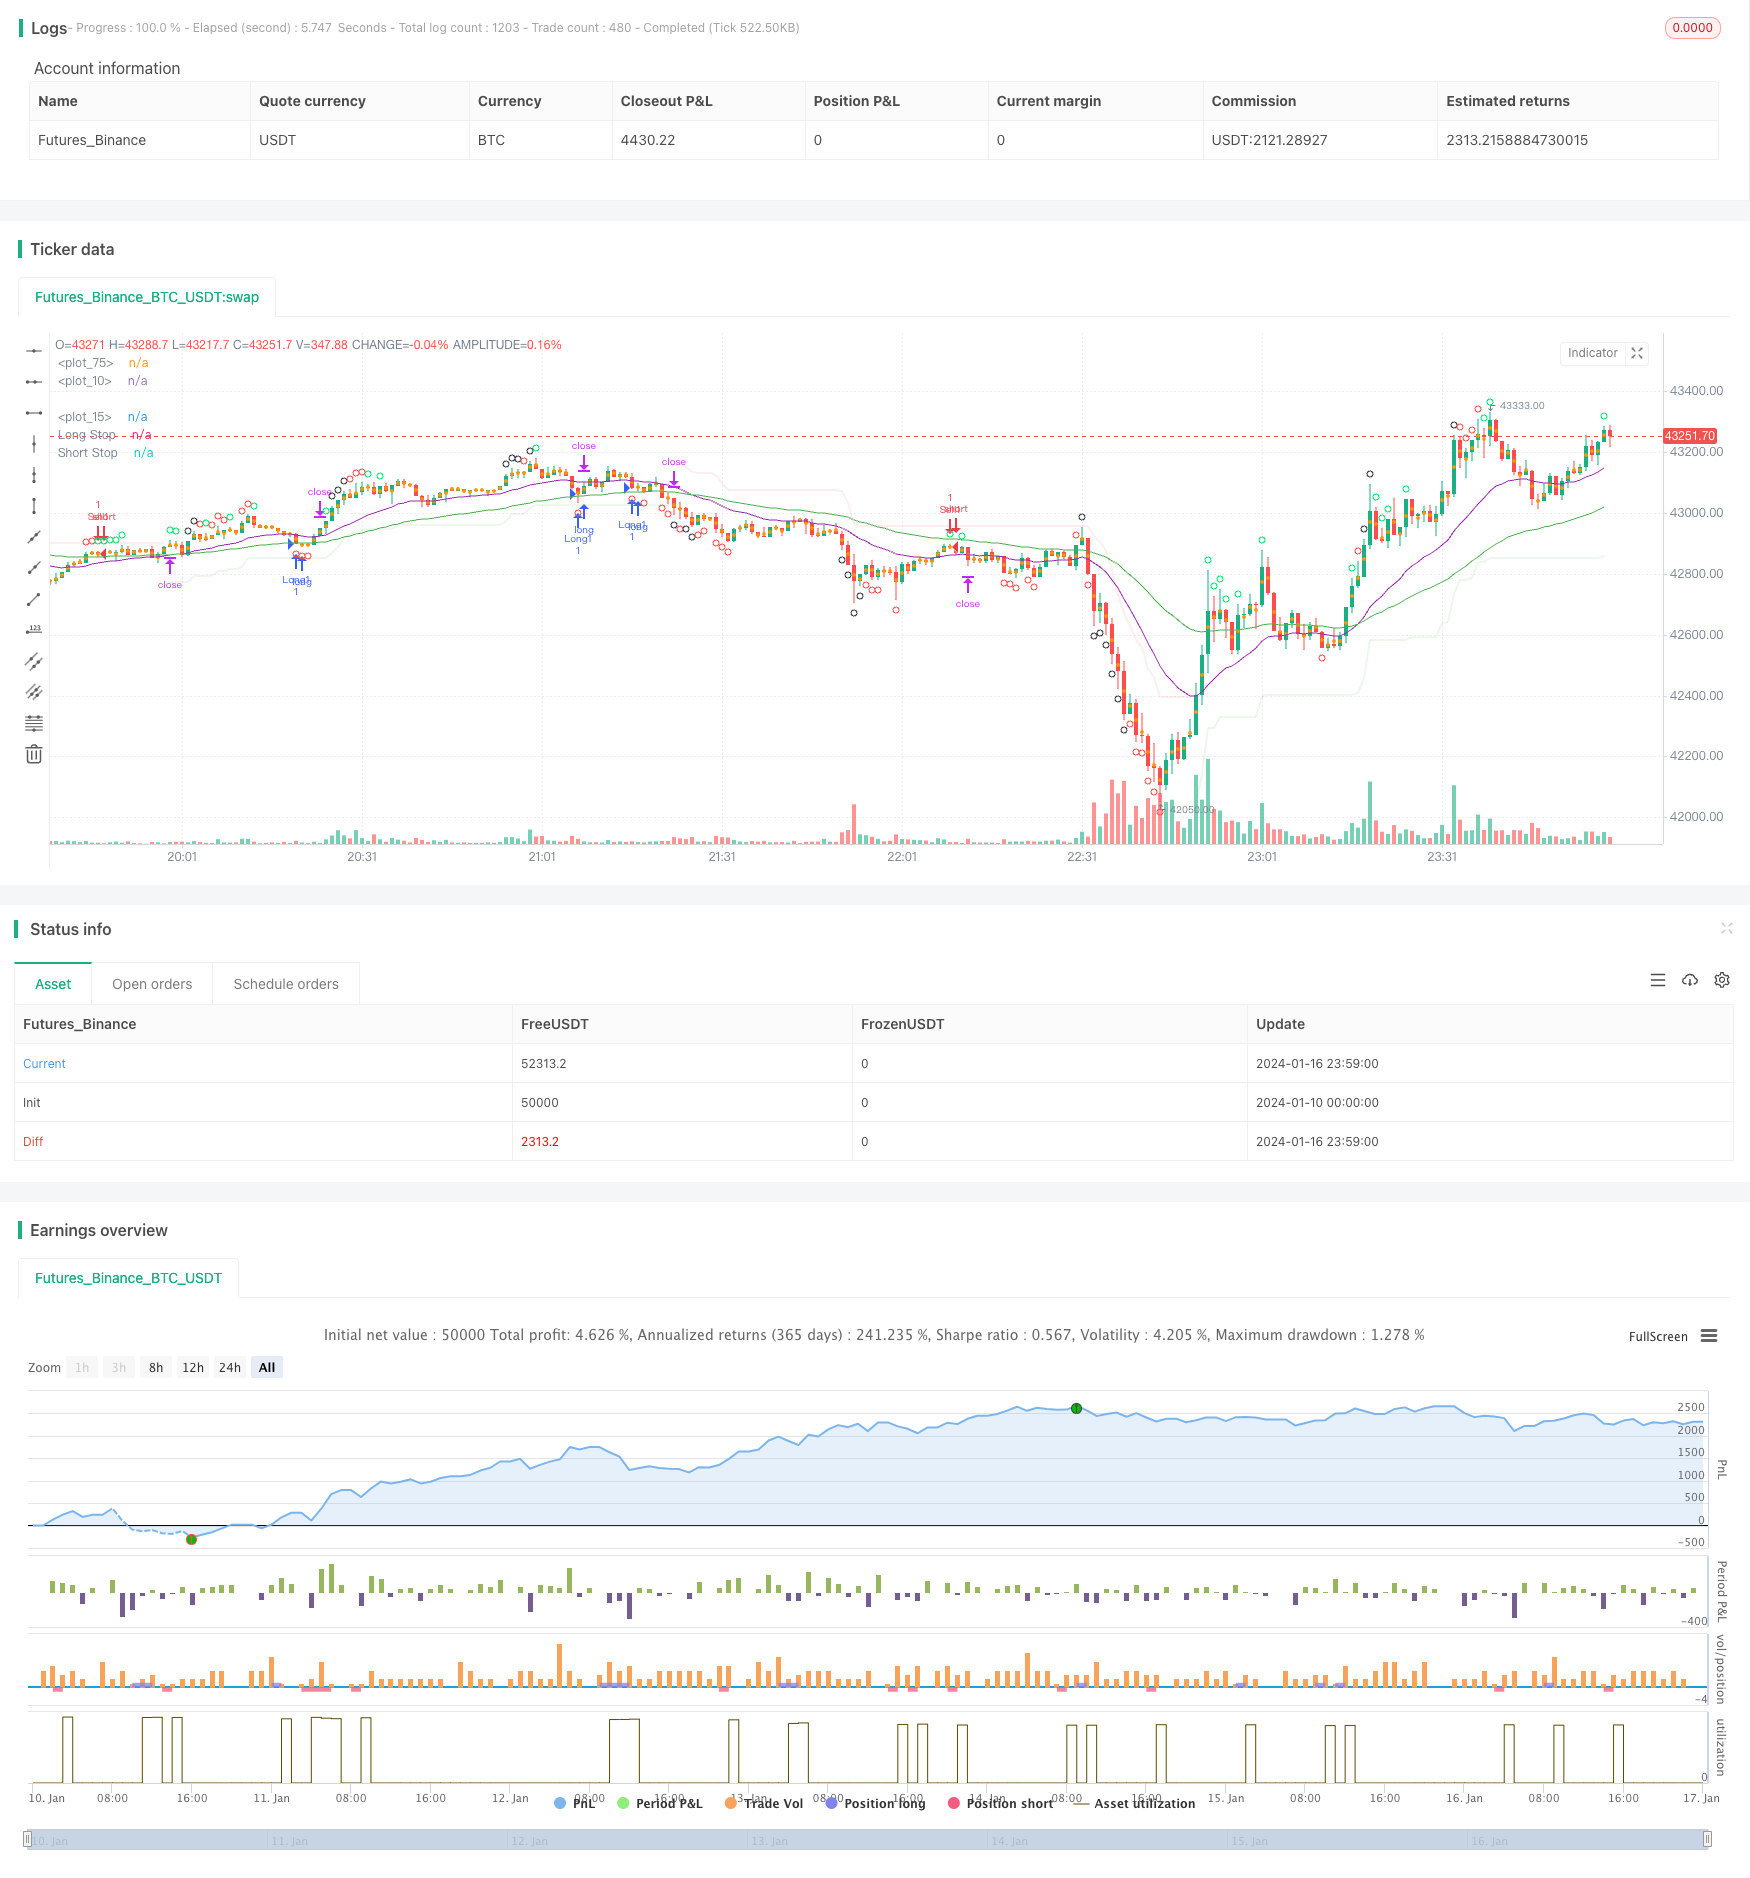
Die Geduld-Trend-Tracking-Strategie insgesamt ist eine sehr praktische Trend-Follow-Strategie. Sie nutzt bewegliche Durchschnitte, um die Richtung des großen Trends zu bestimmen, der CCI-Indikator findet ein Umkehrpunktsignal und die Super-Trend-Stop-Line ist vernünftig. Durch die Parameteranpassung und die Überprüfung einer Kombination aus mehreren Indikatoren kann die Strategie weiter optimiert werden und lohnt sich für die Überprüfung des langfristigen Live-Trackings.
/*backtest
start: 2024-01-10 00:00:00
end: 2024-01-17 00:00:00
period: 1m
basePeriod: 1m
exchanges: [{"eid":"Futures_Binance","currency":"BTC_USDT"}]
*/

// This source code is subject to the terms of the Mozilla Public License 2.0 at https://mozilla.org/MPL/2.0/
// © greenmask9

//@version=4
strategy("Patient Trendfollower (7) Strategy", overlay=true)

// 21 EMA
emalength = input(21, title="Short EMA")
emashort = ema(close, emalength)
plot(emashort, color = color.purple, linewidth=1)

// 55 EMA
emalength2 = input(55, title="Long EMA")
ema = ema(close, emalength2)
plot(ema, color = color.green, linewidth=1)

//CCI calculation and inputs
lengthcci = input(20, minval=1, title="Overbought/sold detector period")
src = input(close, title="Overbought/sold detector source")
ma = sma(src, lengthcci)
ccivalue = (src - ma) / (0.015 * dev(src, lengthcci))


//CCI plotting
ccioverbought = input(defval=100, title="Overbought level 1")
ccioverbought2 = input(defval=140, title="Overbought level 2")
ccioverbought3 = input(defval=180, title="Overbought level 3")

ccioversold = input(defval=-100, title="Oversold level 1")
ccioversold2 = input(defval=-140, title="Oversold level 2")
ccioversold3 = input(defval=-180, title="Oversold level 3")

cciOB = (ccivalue >= ccioverbought and ccivalue < ccioverbought2)
plotshape(cciOB,  title= "Overbought", location=location.abovebar, color=color.lime, transp=0, style=shape.circle)
cciOS = (ccivalue <= ccioversold and ccivalue > ccioversold2)
plotshape(cciOS, title= "Oversold", location=location.belowbar, color=color.lime, transp=0, style=shape.circle)

cciOB2 = (ccivalue >= ccioverbought2 and ccivalue < ccioverbought3)
plotshape(cciOB2,  title= "Overbought", location=location.abovebar, color=color.red, transp=0, style=shape.circle)
cciOS2 = (ccivalue <= ccioversold and ccivalue > ccioversold3)
plotshape(cciOS2, title= "Oversold", location=location.belowbar, color=color.red, transp=0, style=shape.circle)

cciOB3 = (ccivalue >= ccioverbought3)
plotshape(cciOB3,  title= "Overbought", location=location.abovebar, color=color.black, transp=0, style=shape.circle)
cciOS3 = (ccivalue <= ccioversold3)
plotshape(cciOS3, title= "Oversold", location=location.belowbar, color=color.black, transp=0, style=shape.circle)

//Supertrend

length = input(title="ATR Period", type=input.integer, defval=55)
mult = input(title="ATR Multiplier", type=input.float, step=0.1, defval=5.0)
wicks = input(title="Take Wicks into Account ?", type=input.bool, defval=true)
illuminate = input(title="Illuminate Trend", type=input.bool, defval=true)

atr = mult * atr(length)

longStop = hl2 - atr
longStopPrev = nz(longStop[1], longStop)
longStop := (wicks ? low[1] : close[1]) > longStopPrev ? max(longStop, longStopPrev) : longStop

shortStop = hl2 + atr
shortStopPrev = nz(shortStop[1], shortStop)
shortStop := (wicks ? high[1] : close[1]) < shortStopPrev ? min(shortStop, shortStopPrev) : shortStop

dir = 1
dir := nz(dir[1], dir)
dir := dir == -1 and (wicks ? high : close) > shortStopPrev ? 1 : dir == 1 and (wicks ? low : close) < longStopPrev ? -1 : dir

longColor = color.new(color.green, 90)
shortColor = color.new(color.red, 90)
noneColor = color.new(color.white, 100)

longStopPlot = plot(dir == 1 ? longStop : na, title="Long Stop", style=plot.style_linebr, linewidth=2, color=longColor)
shortStopPlot = plot(dir == 1 ? na : shortStop, title="Short Stop", style=plot.style_linebr, linewidth=2, color=shortColor)
midPricePlot = plot(ohlc4, title="", style=plot.style_circles, linewidth=0)

longFillColor = illuminate ? (dir == 1 ? longColor : noneColor) : noneColor
shortFillColor = illuminate ? (dir == -1 ? shortColor : noneColor) : noneColor
fill(midPricePlot, longStopPlot, title="Long State Filling", color=longFillColor)
fill(midPricePlot, shortStopPlot, title="Short State Filling", color=shortFillColor)

//entries
uptrend = emashort>ema and dir == 1
upsignal = ccivalue<=ccioversold and ccivalue>ccioversold2
upsignal2 = ccivalue<=ccioversold2 and ccivalue>ccioversold3
upsignal3 = ccivalue<=ccioversold3
downtrend = emashort<ema and dir == -1
downsignal = ccivalue>=ccioverbought and ccivalue<ccioverbought2
downsignal2 = ccivalue>=ccioverbought2 and ccivalue<ccioverbought3
downsignal3 = ccivalue>=ccioverbought3

//adapts to the current bar, I need to save the bars number when the condition for buy was true, static number is spread
spread = input (0.00020, title="Spread")
upstoploss = longStop - spread
downstoploss = shortStop + spread
strategy.initial_capital = 50000
ordersize=floor(strategy.initial_capital/close)
testlong = input(title="Test longs", type=input.bool, defval=true)
testshort = input(title="Test shorts", type=input.bool, defval=true)
//new
degree = input(title="Test level 1 overbought/sold levels", type=input.bool, defval=true)
degree2 = input(title="Test level 2 overbought/sold levels", type=input.bool, defval=false)
degree3 = input(title="Test level 3 overbought/sold levels", type=input.bool, defval=false)

statictarget = input(title="Use static target", type=input.bool, defval=true)
statictargetvalue = input(title="Static target in pips", type=input.integer, defval=400)

//timetrade = input(title="Open trades only withing specified time", type=input.bool, defval=true)
//timtrade = input()

//přidat možnost TP podle ATR a sl podle ATR
buy1 = uptrend and upsignal and strategy.opentrades==0 and testlong and degree
x1 = barssince (buy1)
if (buy1)
//bodlo by zakázat atrtarget v tomto případě
    if (statictarget)
        strategy.entry("Long1", strategy.long, ordersize)
        strategy.exit( "Exitlong", from_entry="Long1" , profit=statictargetvalue,stop=upstoploss[x1])

buy2 = uptrend and upsignal2 and strategy.opentrades==0 and testlong and degree2
x2 = barssince (buy2)
if (buy2)
//bodlo by zakázat atrtarget v tomto případě
    if (statictarget)
        strategy.entry("Long2", strategy.long, ordersize)
        strategy.exit( "Exitlong", from_entry="Long2" , profit=statictargetvalue,stop=upstoploss[x2])

buy3 = uptrend and upsignal3 and strategy.opentrades==0 and testlong and degree3
x3 = barssince (buy3)
if (buy3)
//bodlo by zakázat atrtarget v tomto případě
    if (statictarget)
        strategy.entry("Long3", strategy.long, ordersize)
        strategy.exit( "Exitlong", from_entry="Long3" , profit=statictargetvalue,stop=upstoploss[x3])

sell1 = downtrend and downsignal and strategy.opentrades==0 and testshort and degree
y1 = barssince (sell1)
if (sell1)
    if (statictarget)
        strategy.entry("Sell1", strategy.short, ordersize)
        strategy.exit( "Exitshort", from_entry="Sell1" , profit=statictargetvalue,stop=downstoploss[y1])

sell2 = downtrend and downsignal2 and strategy.opentrades==0 and testshort and degree2
y2 = barssince (sell2)
if (sell2)
    if (statictarget)
        strategy.entry("Sell2", strategy.short, ordersize)
        strategy.exit( "Exitshort", from_entry="Sell2" , profit=statictargetvalue,stop=downstoploss[y2])

sell3 = downtrend and downsignal3 and strategy.opentrades==0 and testshort and degree3
y3 = barssince (sell3)
if (sell3)
    if (statictarget)
        strategy.entry("Sell3", strategy.short, ordersize)
        strategy.exit( "Exitshort", from_entry="Sell3" , profit=statictargetvalue,stop=downstoploss[y3])