Anpassungsfähige ATR- und RSI-Trend nach Strategie mit Trailing Stop Loss
Schriftsteller:ChaoZhang, Datum: 2024-01-23 11:31:14Tags:

Übersicht
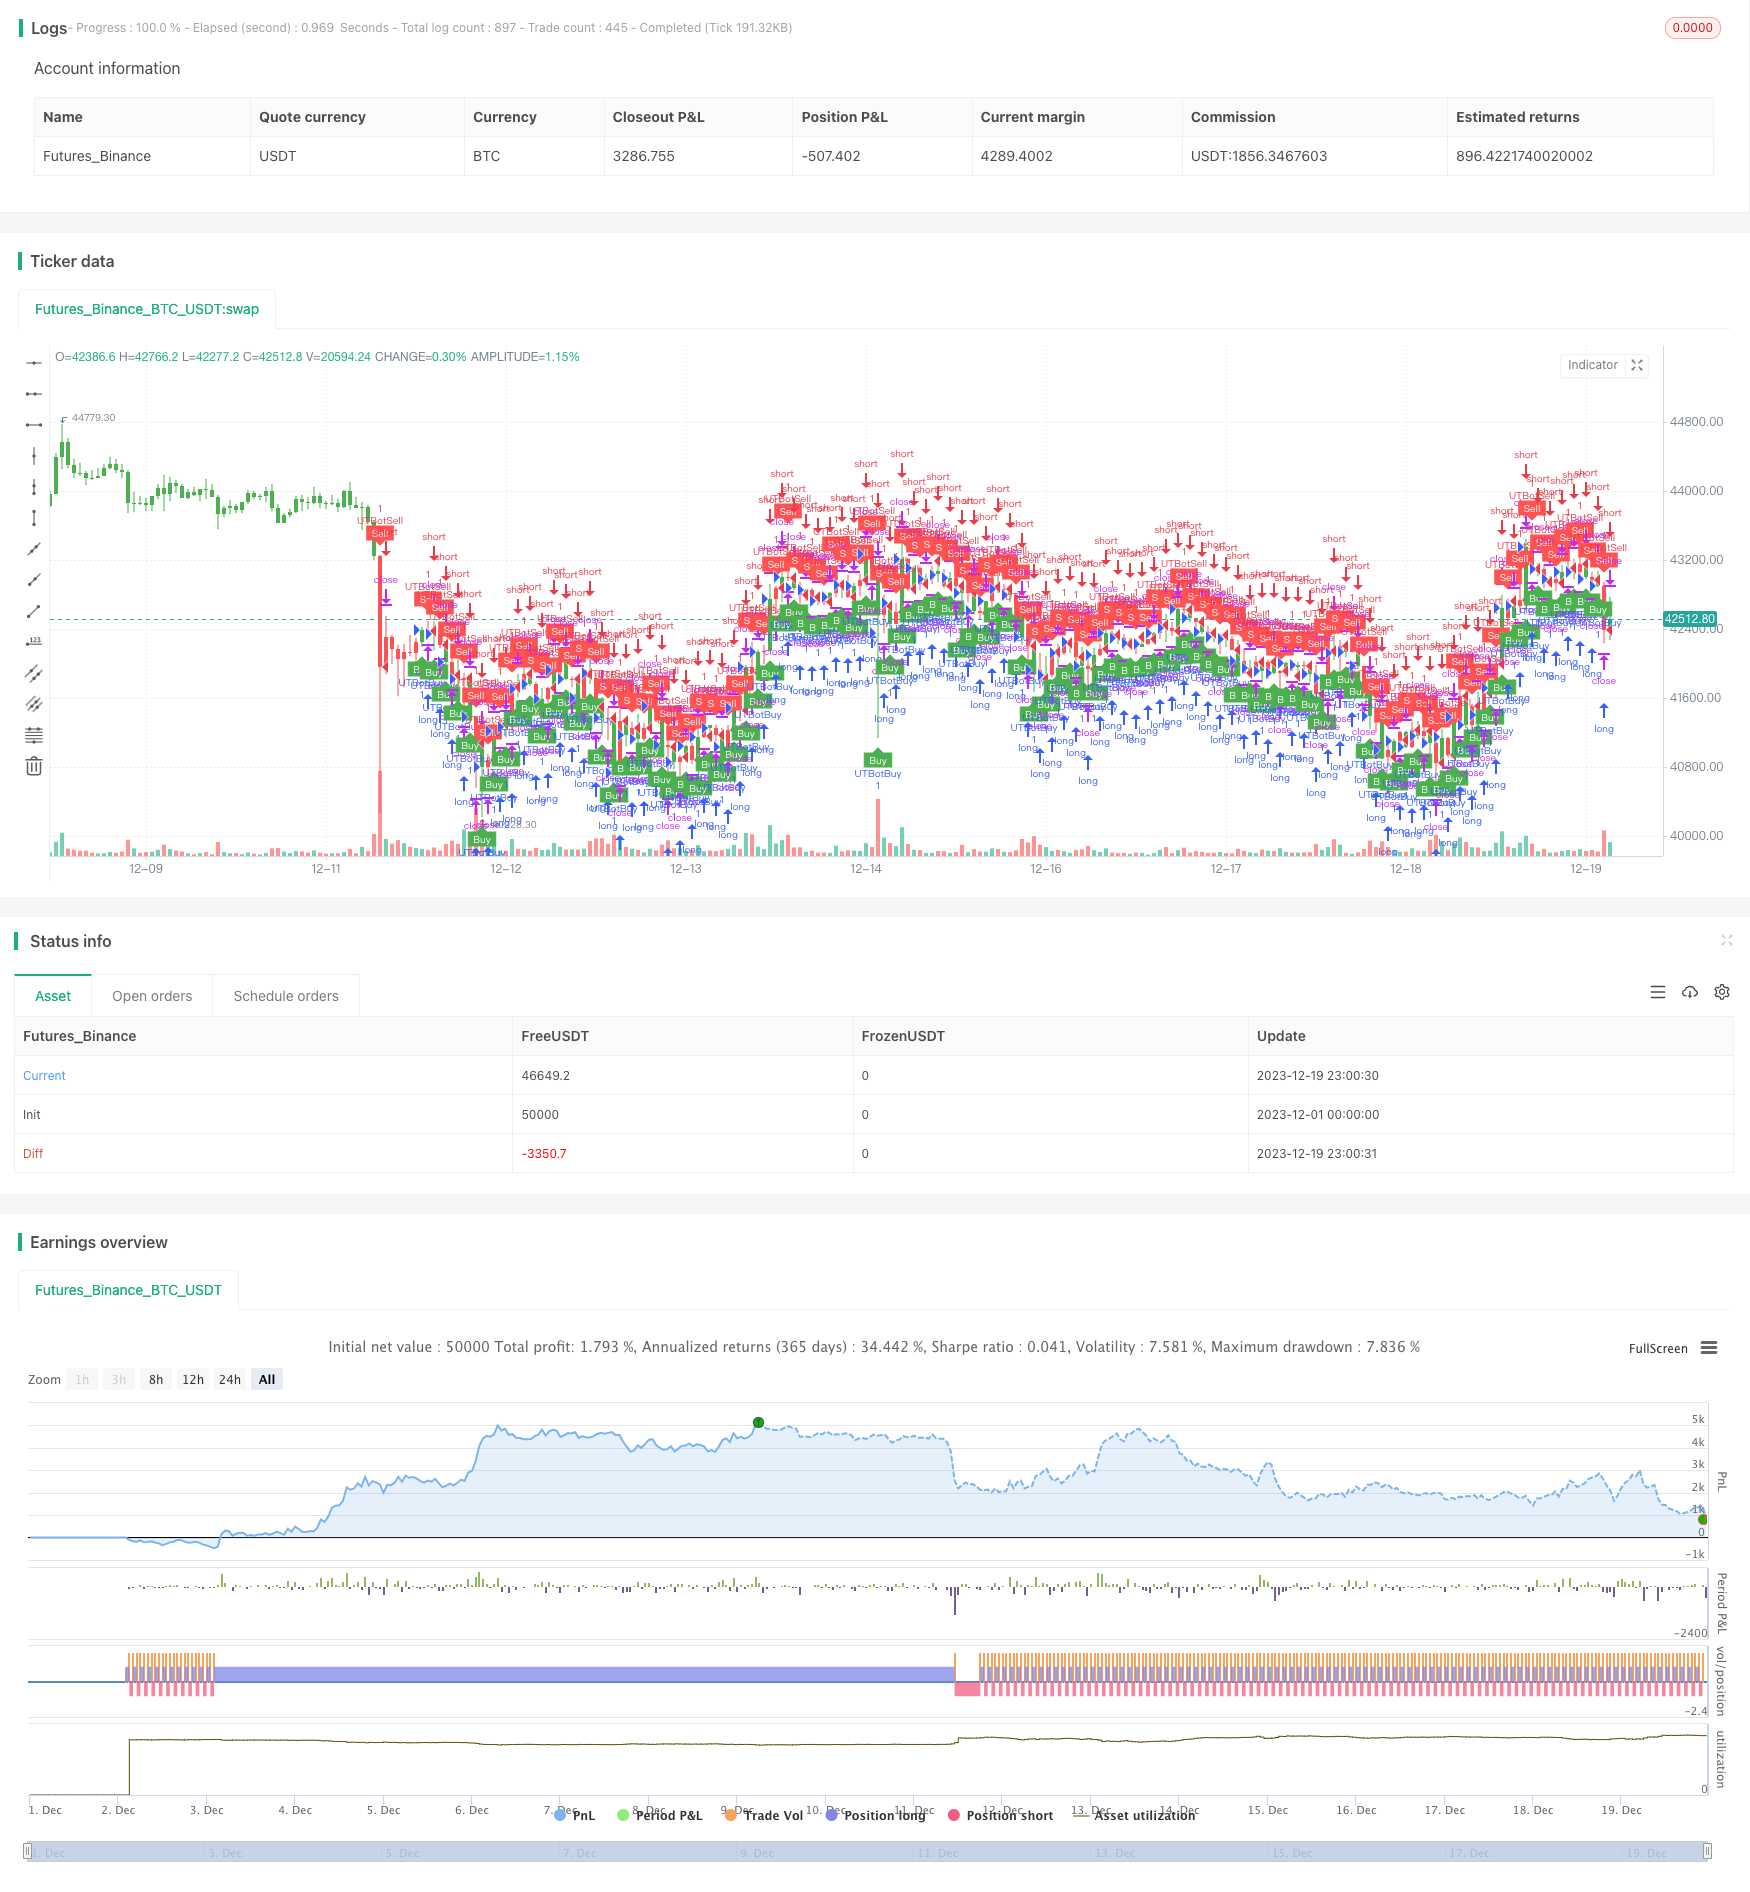
Diese Strategie kombiniert den Durchschnittlichen Wahren Bereich (ATR), den Relativen Stärkeindex (RSI) und den Trailing Stop Loss, um einen anpassungsfähigen Trend zu erreichen.
Grundsätze
-
Berechnen Sie ATR. ATR zeigt die Marktvolatilität und das Risikoniveau. Diese Strategie verwendet ATR zur Berechnung dynamischer Stop-Loss für eine anpassungsfähige Risikokontrolle.
-
Berechnen Sie den RSI. Der RSI beurteilt den Überkauf-/Überverkaufsstatus. Wenn der RSI über 50 liegt, signalisiert er einen bullischen Ausblick, wenn er unter 50 liegt, einen bärischen Ausblick. Diese Strategie verwendet den RSI, um die Trendrichtung zu bestimmen.
-
Trailing-Stop-Loss-Tracking. Gemäß dem durch ATR berechneten Stop-Loss-Level und der Trendrichtung durch RSI bewegt sich diese Strategie mit dem Stop-Loss, um die Kursschwankungen zu verfolgen, um den Gewinn zu maximieren und gleichzeitig einen effektiven Stop-Loss zu gewährleisten.
-
Insbesondere, lang, wenn der RSI über 50 geht, kurz, wenn er unter 50 geht, dann bewegt man den Stop Loss basierend auf ATR, um den Gewinn entlang des Trends zu sichern.
Analyse der Vorteile
-
Der ATR-Adaptive Stop-Loss berücksichtigt die Marktvolatilität und vermeidet einen zu breiten oder zu engen Stop-Loss.
-
Der RSI identifiziert zuverlässig Trends und vermeidet Whipsaws.
-
Der Stop-Loss verfolgt den Trend, das Gewinnziel zu erweitern.
Risikoanalyse
-
Die ATR- und RSI-Parameter müssen für Backtest optimiert werden, da sie sonst die Strategieleistung beeinträchtigen.
-
Obwohl mit einem Stop-Loss-Schutz das Risiko besteht, dass der Preis plötzlich springt, um den Stop-Loss zu durchdringen.
-
Die Strategieleistung hängt stark von Parameter-Tuning für verschiedene Produkte ab.
Erweiterung
-
Betrachten Sie maschinelle Lernalgorithmen für die adaptive Parameteroptimierung.
-
Zusätzliche Positionsgrößenregelung zur dynamischen Anpassung an die Marktbedingungen zur Verringerung der Wahrscheinlichkeit eines Stop-Loss-Durchdringens.
-
Fügen Sie weitere Trendindikatoren hinzu, um zu vermeiden, dass wichtige Trendumkehrpunkte übersehen werden.
Schlussfolgerung
Diese Strategie integriert ATR, RSI und Trailing Stop Loss für ein typisches anpassungsfähiges Trendfolgensystem. Durch Parameter-Tuning kann sie flexibel an verschiedene Handelsprodukte angepasst werden, eine empfohlene universelle Trendfolgestrategie. Mit mehr Beurteilungen und Maschinenlernoptimierung kann sie noch bessere Leistung erzielen.
/*backtest
start: 2023-12-01 00:00:00
end: 2023-12-19 23:59:59
period: 1h
basePeriod: 15m
exchanges: [{"eid":"Futures_Binance","currency":"BTC_USDT"}]
*/

//@version=2
strategy(title="UTBot Strategy", overlay = true )

// CREDITS to @HPotter for the orginal code.
// CREDITS to @Yo_adriiiiaan for recently publishing the UT Bot study based on the original code -
// CREDITS to @TradersAITradingPlans for making this Strategy.
// Strategy fixed with Time period by Kirk65.
// I am using this UT bot with 2 hours time frame with god resultss. Alert with "Once per bar" and stoploss 1.5%. If Alerts triggered and price goes against Alert. Stoploss will catch it. Wait until next Alert.
// While @Yo_adriiiiaan mentions it works best on a 4-hour timeframe or above, witch is a lot less risky, but less profitable.

testStartYear = input(2019, "BACKTEST START YEAR", minval = 1980, maxval = 2222)
testStartMonth = input(01, "BACKTEST START MONTH", minval = 1, maxval = 12)
testStartDay = input(01, "BACKTEST START DAY", minval = 1, maxval = 31)
testPeriodStart = timestamp(testStartYear,testStartMonth,testStartDay,0,0)
testStopYear = input(2222, "BACKTEST STOP YEAR", minval=1980, maxval = 2222)
testStopMonth = input(12, "BACKTEST STOP MONTH", minval=1, maxval=12)
testStopDay = input(31, "BACKTEST STOP DAY", minval=1, maxval=31)
testPeriodStop = timestamp(testStopYear, testStopMonth, testStopDay, 0, 0)

testPeriod = true

SOURCE = input(hlc3)
RSILENGTH = input(14, title = "RSI LENGTH")
RSICENTERLINE = input(52, title = "RSI CENTER LINE")
MACDFASTLENGTH = input(7, title = "MACD FAST LENGTH")
MACDSLOWLENGTH = input(12, title = "MACD SLOW LENGTH")
MACDSIGNALSMOOTHING = input(12, title = "MACD SIGNAL SMOOTHING")
a = input(10, title = "Key Vaule. 'This changes the sensitivity'")
SmoothK = input(3)
SmoothD = input(3)
LengthRSI = input(14)
LengthStoch = input(14)
RSISource = input(close)
c = input(10, title="ATR Period")
xATR = atr(c)
nLoss = a * xATR
xATRTrailingStop = iff(close > nz(xATRTrailingStop[1], 0) and close[1] > nz(xATRTrailingStop[1], 0), max(nz(xATRTrailingStop[1]), close - nLoss),
     iff(close < nz(xATRTrailingStop[1], 0) and close[1] < nz(xATRTrailingStop[1], 0), min(nz(xATRTrailingStop[1]), close + nLoss),
     iff(close > nz(xATRTrailingStop[1], 0), close - nLoss, close + nLoss)))
pos =	iff(close[1] < nz(xATRTrailingStop[1], 0) and close > nz(xATRTrailingStop[1], 0), 1,
     iff(close[1] > nz(xATRTrailingStop[1], 0) and close < nz(xATRTrailingStop[1], 0), -1, nz(pos[1], 0)))
color = pos == -1 ? red: pos == 1 ? green : blue
ema= ema(close,1)
above = crossover(ema,xATRTrailingStop )
below = crossover(xATRTrailingStop,ema)
buy = close > xATRTrailingStop and above
sell = close < xATRTrailingStop and below
barbuy = close > xATRTrailingStop
barsell = close < xATRTrailingStop
plotshape(buy, title = "Buy", text = 'Buy', style = shape.labelup, location = location.belowbar, color= green,textcolor = white, transp = 0, size = size.tiny)
plotshape(sell, title = "Sell", text = 'Sell', style = shape.labeldown, location = location.abovebar, color= red,textcolor = white, transp = 0, size = size.tiny)
barcolor(barbuy? green:na)
barcolor(barsell? red:na)
//alertcondition(buy, title='Buy', message='Buy')
//alertcondition(sell, title='Sell', message='Sell')

if (buy)
    strategy.entry("UTBotBuy",strategy.long, when=testPeriod)
if (sell)
    strategy.entry("UTBotSell",strategy.short, when=testPeriod)
- Kurzfristige Handelsstrategie auf Basis des EMA-Kanals und des MACD
- Strategie zur Übertragung von Momentum und Angstindex
- Automatische Long/Short-Handelsstrategie auf Basis von täglichen Pivotpoints
- Strategie für den quantitativen Handel mit dreigliedrigem gleitendem Durchschnitt
- Eine auf dem exponentiellen gleitenden Durchschnitt basierende Momentum-Crossover-Strategie
- Adaptiver gleitender Durchschnitt und gewichteter gleitender Durchschnitt
- Aggregierter MACD RSI mit mehreren Zeitrahmen CCI StochRSI MA Lineare Handelsstrategie
- Multi-Zeitrahmen-MACD-Trend nach Strategie
- Eine quantitative Handelsstrategie für den Ausbruch des ATR-Kanals
- Trendsurfende Absicherungsstrategie auf der Grundlage von TSI- und HMACCI-Indikatoren
- Algorithmus des doppelten gleitenden Durchschnitts des Goldenen Kreuzes
- Das Goldene Kreuz, das Todeskreuz, die langfristige Multifaktorstrategie
- RSI-Divergenz-Handelsstrategie
- Trend für mehrere Zeitrahmen nach Strategie
- Dynamische Netzhandelsstrategie
- Eine Strategie für eine doppelte bewegliche durchschnittliche Bestätigungsvorteilelinie