Quantitative Handelsstrategie basierend auf Yiyun-Durchbruch und ADX-Indikator
Überblick
Die Strategie nennt sich “Quantitative Trading Strategy” und basiert auf einem Cloud Breakout und dem ADX-Indikator. Es kombiniert eine Cloud Graph Technical Analysis mit dem Average Trend Indicator (ADX) Indikator, um zu entscheiden, wann ein Overshoot oder ein Overshoot erfolgen soll. Konkret handelt es sich um den Aufbau von Positionen, wenn die Preise die Cloud Graphik durchbrechen und der ADX-Indikator einen starken Trend zeigt.
Strategieprinzip
Die Strategie nutzt die Graphik der Wolken in den Umlaufkurven, um wichtige Unterstützungs- und Widerstandsbereiche zu ermitteln. Sie kombiniert die ADX-Indikatoren, um die Trendstärke zu bestimmen. Die spezifischen Handelsstrategie-Regeln sind wie folgt:
Das ist ein Signal für mehrere Lagerhäuser:
- Antennenleitung nach oben durch die Referenzlinie
- Später dreht sich die Linie nach oben über die Achse 0
- Die Preise sind höher als auf der Wolkenkarte.
- ADX-Werte unter 45 (zeigen, dass der Trend nicht übermäßig ausgeweitet ist)
- +DI höher als -DI ((zeigt einen Aufwärtstrend)
Das ist ein Signal für den Bau einer Hütte.
- Die Antennenleitung durchbricht die Basislinie.
- Spätschiene dreht sich nach unten durch die 0-Achse
- Preise unterhalb der Wolken
- ADX-Werte über 45 (was eine mögliche Trendwende bedeutet)
- +DI-Wert niedriger als -DI-Wert (zeigt als Abwärtstrend)
Analyse der Stärken
Die Strategie kombiniert grafische technische Analyse und Trendanalyse-Indikatoren, um die Marktentwicklung und die starken Bereiche zu bestimmen. Die spezifischen Vorteile sind:
- Die Nutzung einer Cloud-Grafik zur Ermittlung von wichtigen Unterstützungs- und Widerstandsbereichen, um einen starken Trend zu erfassen
- Vermeiden Sie falsche Trades, indem Sie die tatsächliche Trendstärke mit dem ADX-Index ermitteln
- Regeln sind klar, einfach zu bedienen, einfach zu bedienen
Risiken und Lösungen
Die Strategie birgt auch einige Risiken, die sich hauptsächlich auf die Instabilität konzentrieren, die der ADX-Index beurteilt. Die konkreten Risiken und Lösungen sind wie folgt:
- ADX-Berechnungen sind rückläufig und können eine schnelle Umkehrung verpassen. Die ADX-Parameter können entsprechend reduziert werden, um sie sensibler zu machen
- ADX ist nicht sehr effektiv bei Erschütterungen. Weitere Filter für andere Indikatoren wie BOLL-Kanäle können hinzugefügt werden.
- Eine Cloud-Grafik kann auch fehlschlagen. Die Parameter können entsprechend angepasst oder andere Indikatoren hinzugefügt werden.
Empfehlungen zur Optimierung der Strategie
Die Strategie kann auch in folgenden Bereichen optimiert werden:
- Anpassung der Graphikparameter einer Wolke an weitere Sorten
- Erhöhung der Stop-Loss-Strategie und Kontrolle von Einzelschäden
- Kombination von mehr Indikatoren zu einer Kombination von Indikatoren-Filtersignalen
- Hinzufügung eines Modellvorhersage-Moduls, um die Trendsignal-Effector mit Hilfe von maschinellem Lernen weiter zu beurteilen
Zusammenfassen
Diese Strategie kombiniert eine Cloud-Grafik-Technologie-Analyse und ADX-Trendentscheidungs-Indikatoren, um eine klare und vollständige quantitative Handelsstrategie zu bilden. Es beurteilt die wichtigen Unterstützungs- und Widerstandsbereiche und berücksichtigt die Trendentscheidung, um die Marktchancen effektiv zu erfassen. Die Strategie ist leicht verfügbar und kann optimiert werden.
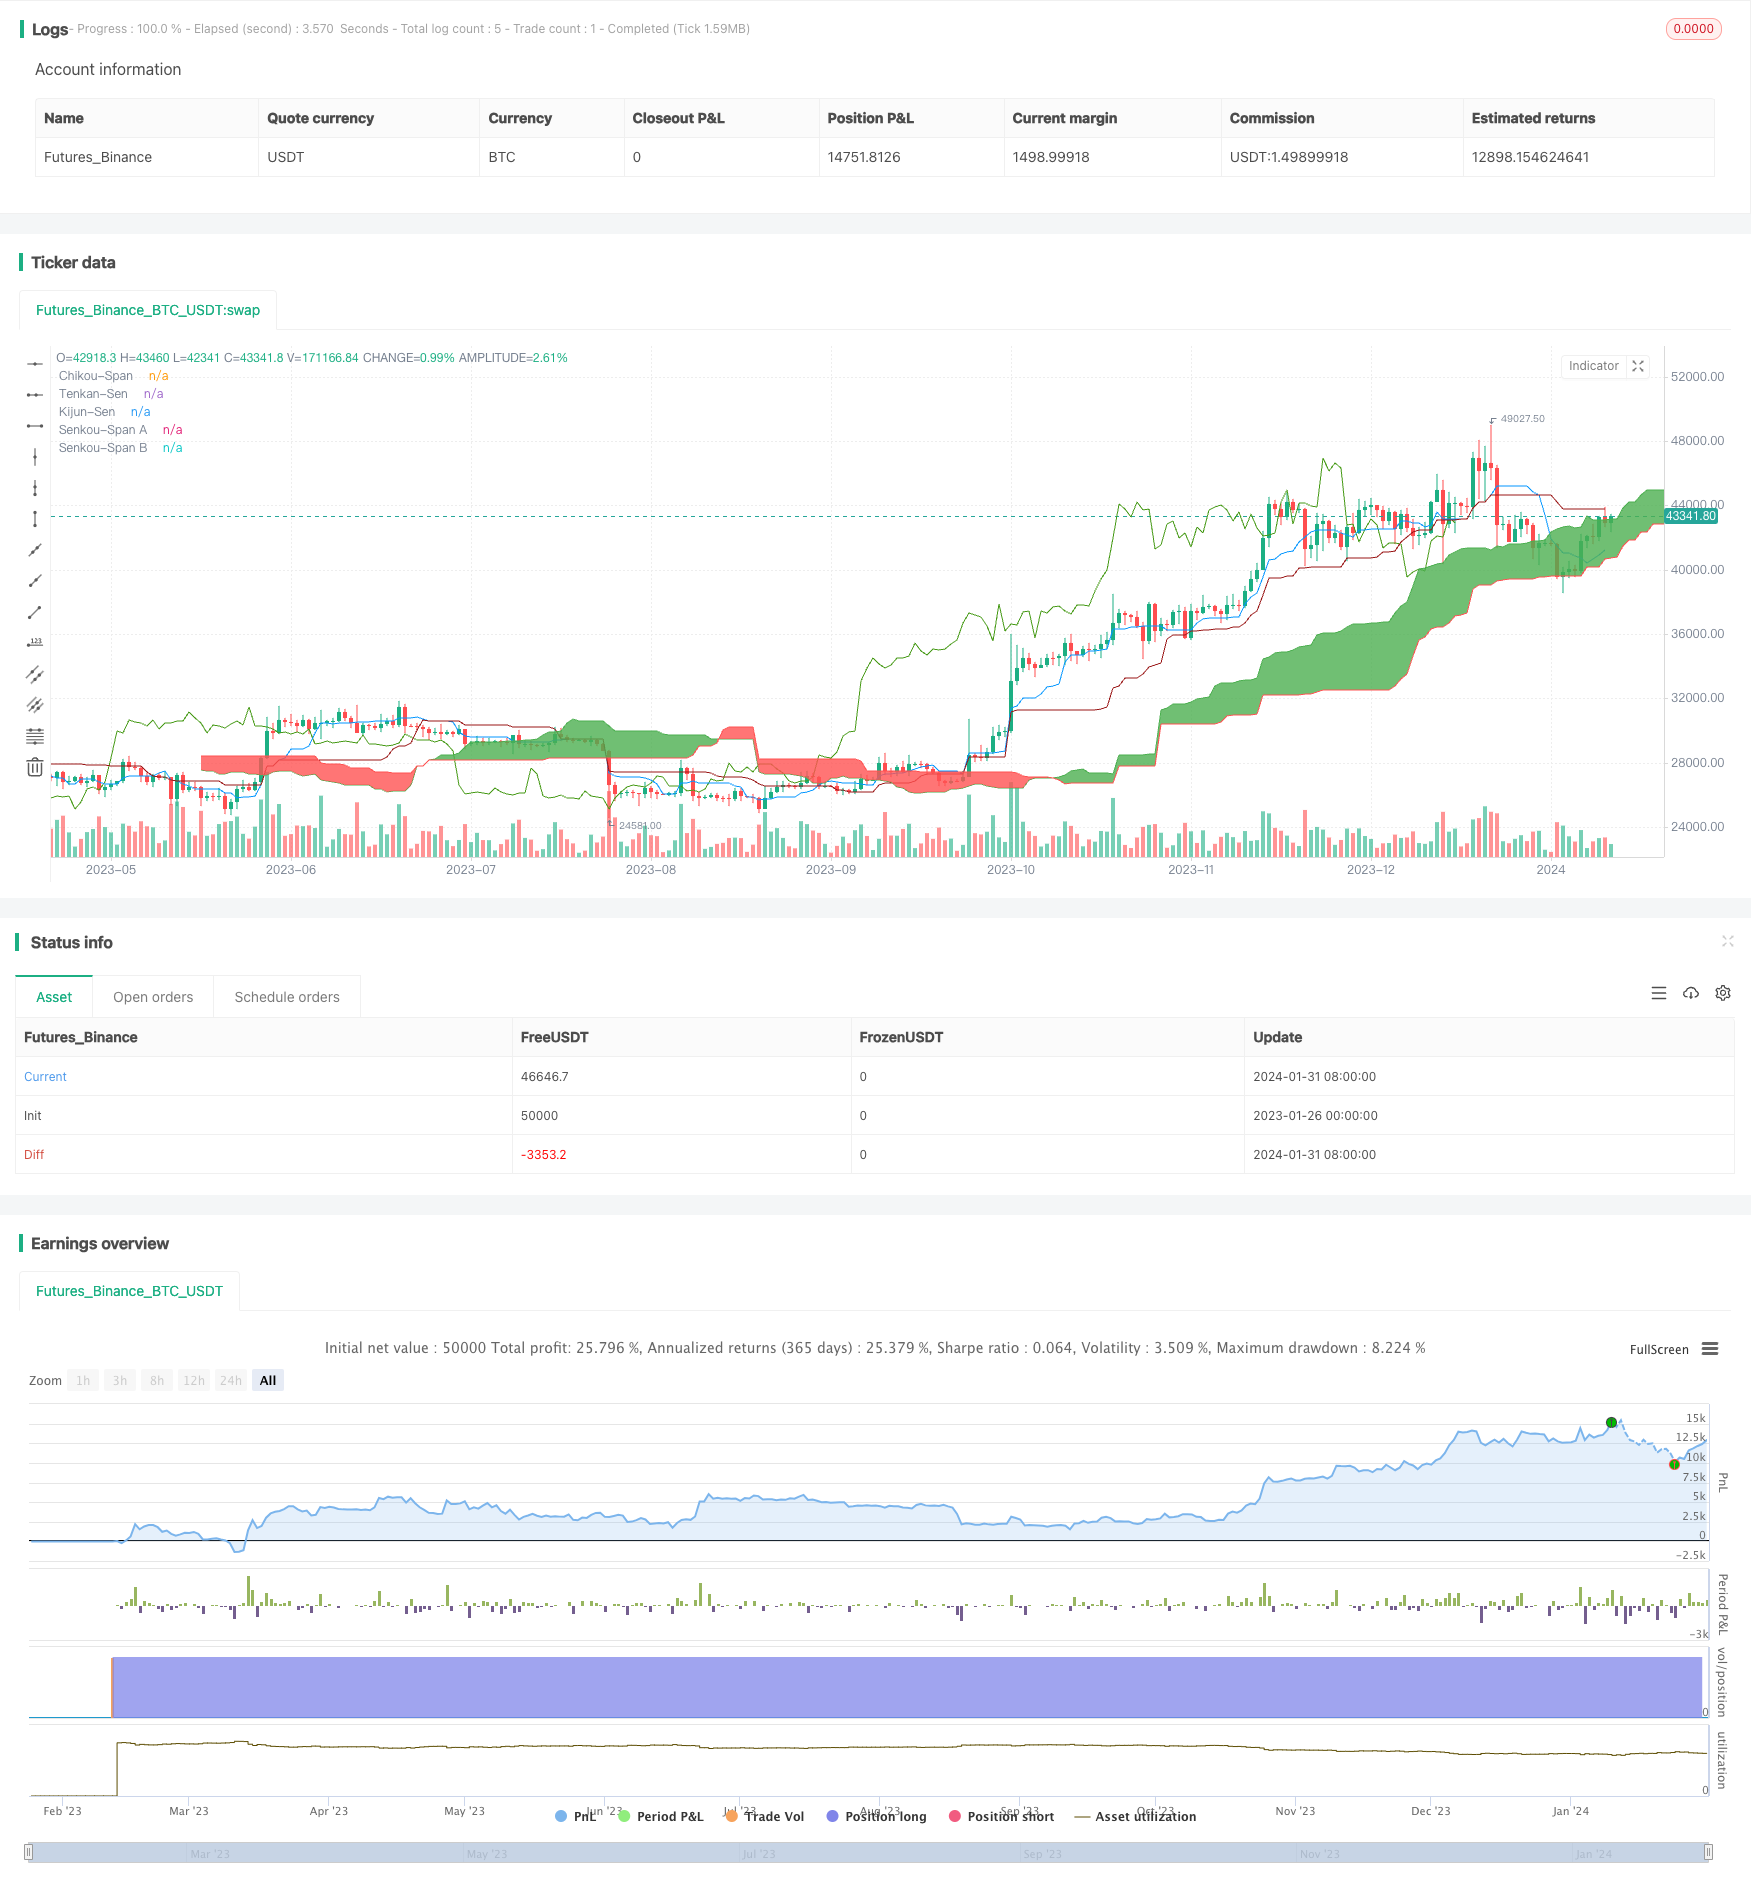
/*backtest
start: 2023-01-26 00:00:00
end: 2024-02-01 00:00:00
period: 1d
basePeriod: 1h
exchanges: [{"eid":"Futures_Binance","currency":"BTC_USDT"}]
*/

// This source code is subject to the terms of the Mozilla Public License 2.0 at https://mozilla.org/MPL/2.0/
// © Coinrule

//@version=5
strategy('Ichimoku Cloud with ADX (By Coinrule)',
         overlay=true,
         initial_capital=1000,
         process_orders_on_close=true,
         default_qty_type=strategy.percent_of_equity,
         default_qty_value=30,
         commission_type=strategy.commission.percent,
         commission_value=0.1)

showDate = input(defval=true, title='Show Date Range')
timePeriod = time >= timestamp(syminfo.timezone, 2022, 1, 1, 0, 0)


// Stop Loss and Take Profit for Shorting
Stop_loss = input(1) / 100
Take_profit = input(5) / 100
longStopPrice = strategy.position_avg_price * (1 - Stop_loss)
longTakeProfit = strategy.position_avg_price * (1 + Take_profit)


// Inputs
ts_bars = input.int(9, minval=1, title='Tenkan-Sen Bars')
ks_bars = input.int(26, minval=1, title='Kijun-Sen Bars')
ssb_bars = input.int(52, minval=1, title='Senkou-Span B Bars')
cs_offset = input.int(26, minval=1, title='Chikou-Span Offset')
ss_offset = input.int(26, minval=1, title='Senkou-Span Offset')
long_entry = input(true, title='Long Entry')
short_entry = input(true, title='Short Entry')

middle(len) => math.avg(ta.lowest(len), ta.highest(len))

// Ichimoku Components
tenkan = middle(ts_bars)
kijun = middle(ks_bars)
senkouA = math.avg(tenkan, kijun)
senkouB = middle(ssb_bars)

// Plot Ichimoku Kinko Hyo
plot(tenkan, color=color.new(#0496ff, 0), title='Tenkan-Sen')
plot(kijun, color=color.new(#991515, 0), title='Kijun-Sen')
plot(close, offset=-cs_offset + 1, color=color.new(#459915, 0), title='Chikou-Span')
sa = plot(senkouA, offset=ss_offset - 1, color=color.new(color.green, 0), title='Senkou-Span A')
sb = plot(senkouB, offset=ss_offset - 1, color=color.new(color.red, 0), title='Senkou-Span B')
fill(sa, sb, color=senkouA > senkouB ? color.green : color.red, title='Cloud color', transp=90)

ss_high = math.max(senkouA[ss_offset - 1], senkouB[ss_offset - 1])
ss_low = math.min(senkouA[ss_offset - 1], senkouB[ss_offset - 1])


// ADX
[pos_dm, neg_dm, avg_dm] = ta.dmi(14, 14)


// Entry/Exit Signals
tk_cross_bull = tenkan > kijun
tk_cross_bear = tenkan < kijun
cs_cross_bull = ta.mom(close, cs_offset - 1) > 0
cs_cross_bear = ta.mom(close, cs_offset - 1) < 0
price_above_kumo = close > ss_high
price_below_kumo = close < ss_low

bullish = tk_cross_bull and cs_cross_bull and price_above_kumo and avg_dm < 45 and pos_dm > neg_dm
bearish = tk_cross_bear and cs_cross_bear and price_below_kumo and avg_dm > 45 and pos_dm < neg_dm

strategy.entry('Long', strategy.long, when=bullish and long_entry and timePeriod)
strategy.close('Long', when=bearish and not short_entry)

strategy.entry('Short', strategy.short, when=bearish and short_entry and timePeriod)
strategy.close('Short', when=bullish and not long_entry)