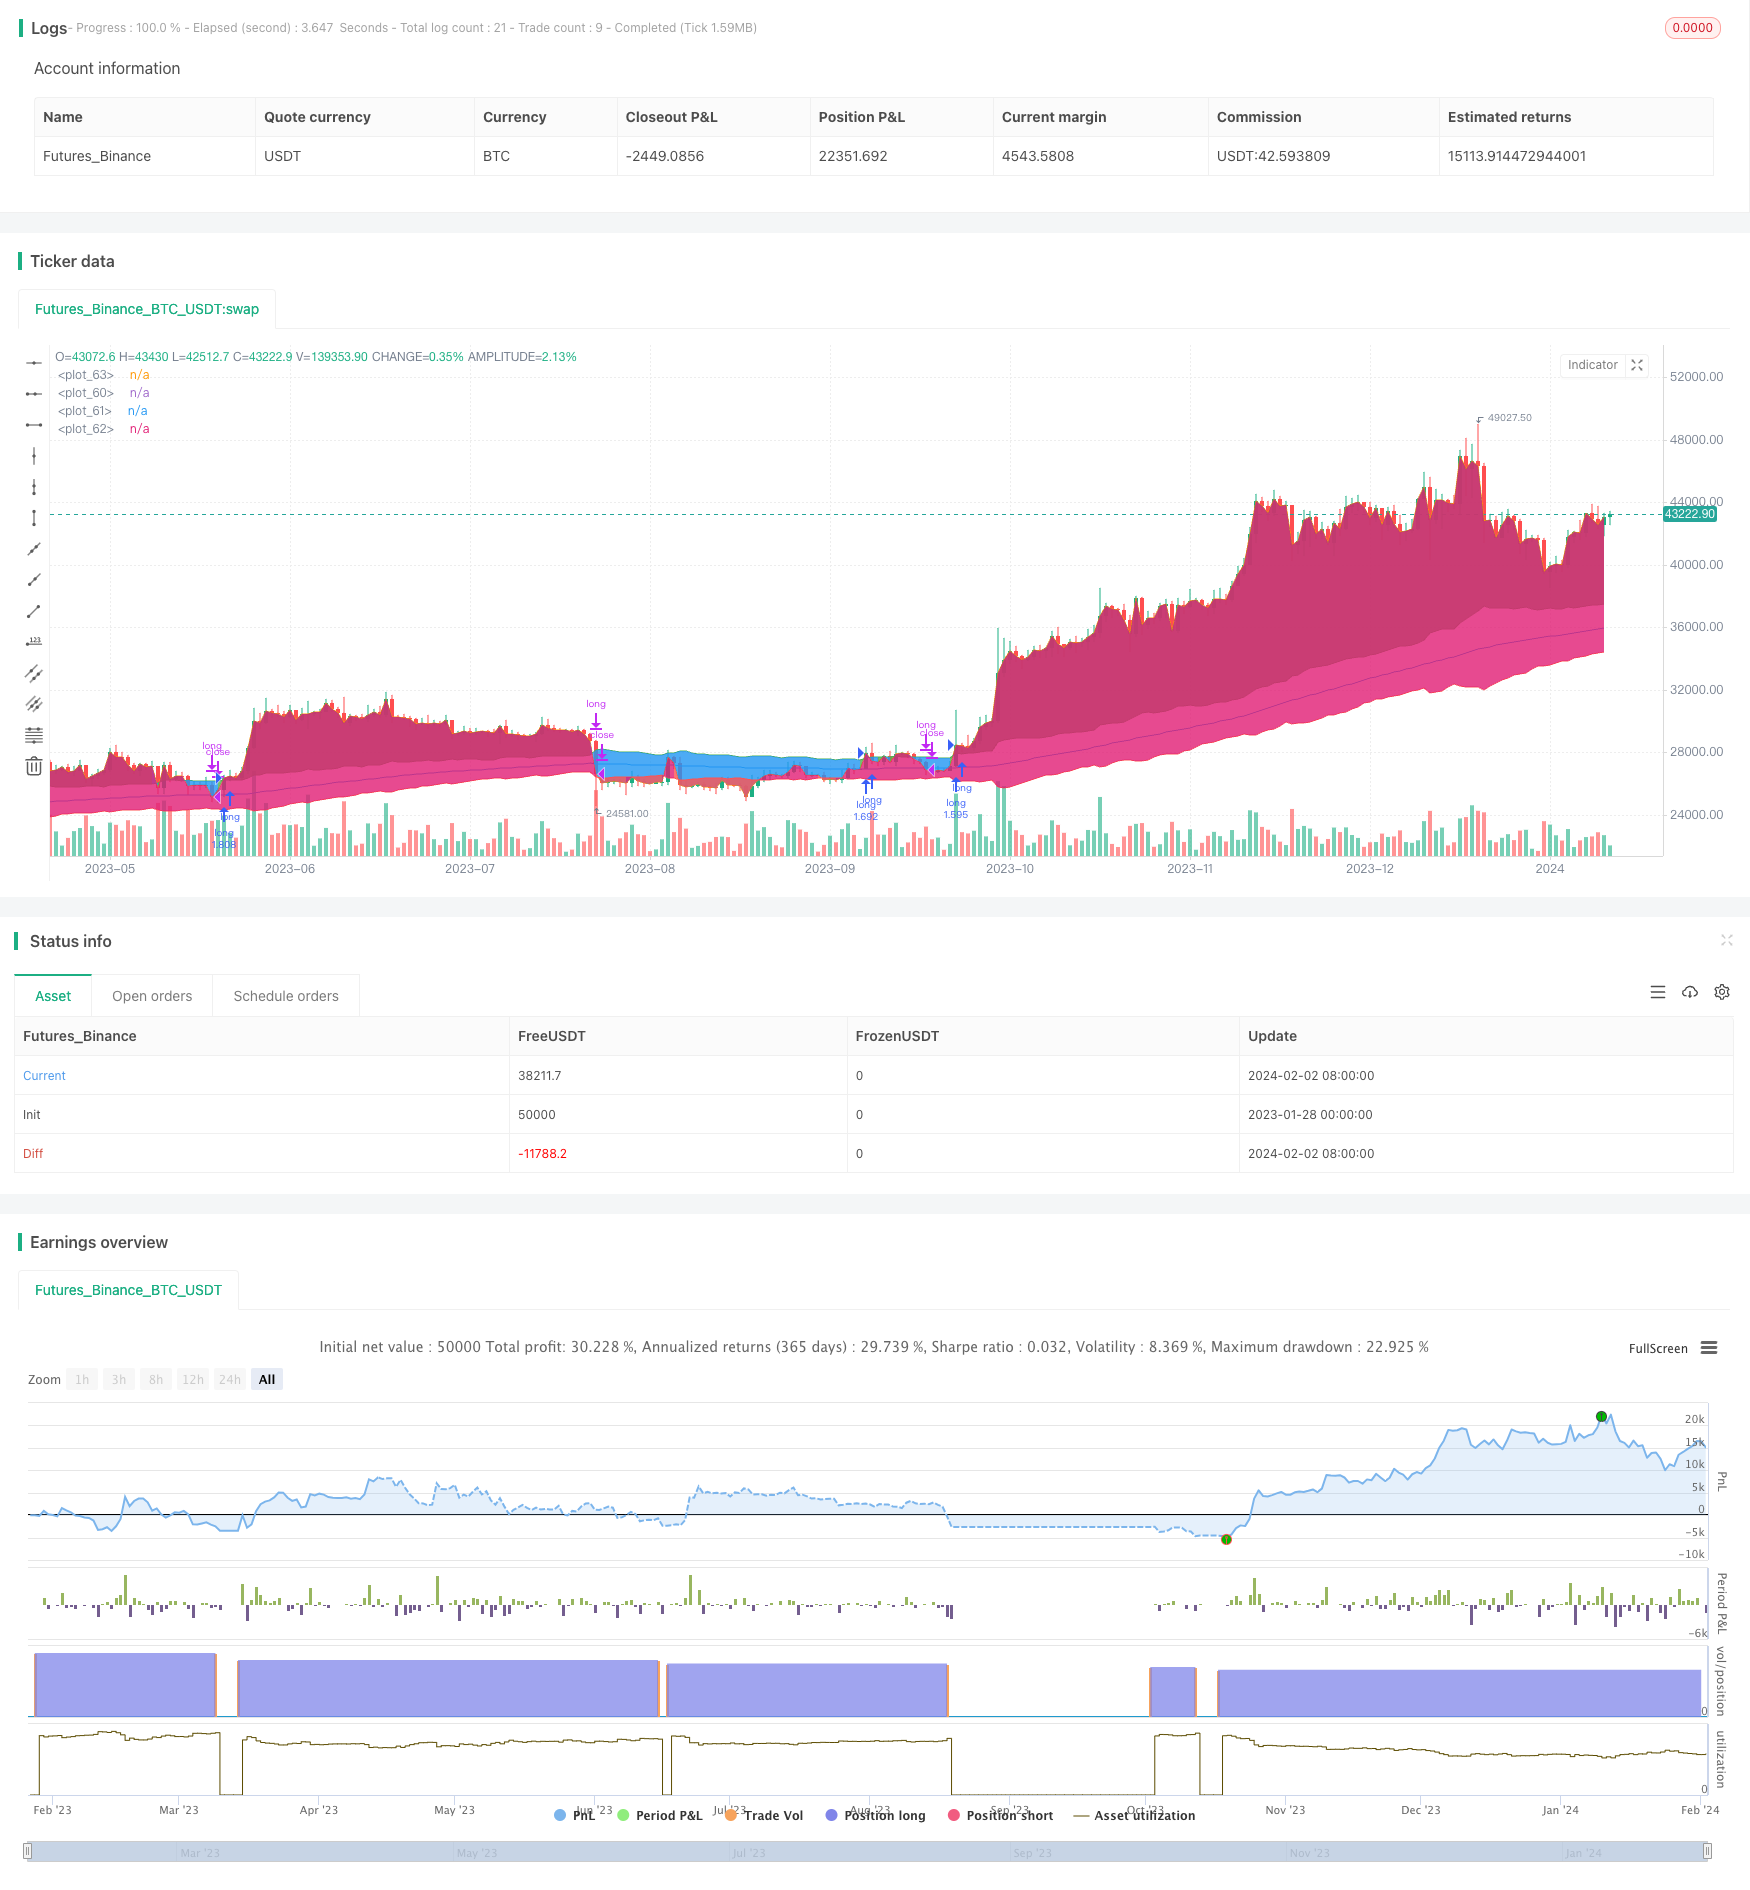
Trendfolgende gleitende Durchschnittsstrategie

Überblick
Eine Trend-Tracking-Moving-Average-Strategie ist eine Trend-Following-Strategie, die auf der Identifizierung der Richtung eines langfristigen Moving-Averages basiert und in Kombination mit dem Filtern der durchschnittlichen realen Schwankungs-Range für Fehltrends verwendet. Die Strategie verwendet einen Index-Moving-Average, um die Richtung des Trends zu bestimmen, und verwendet dann die durchschnittliche realen Schwankungs-Range, um festzustellen, ob ein Falschbruch erkannt wurde.
Strategieprinzip
Die Strategie basiert auf folgenden Prinzipien:
- Der Index bewegt sich durchschnittlich, um die Richtung der Gesamttrend zu bestimmen. Die Dauerlänge setzt die 200-K-Linien-Default ein.
- Berechnen Sie den mittleren realen Bereich der letzten 10 K-Linien.
- Wenn der Schlusskurs oberhalb des Moving Averages + des Durchschnitts der realen Schwankungsbreite liegt, wird er als Aufwärtstrend bezeichnet.
- Wenn der Schlusskurs unterhalb des Moving Averages liegt, wird er als Abwärtstrend beurteilt.
- In einem Aufwärtstrend, mehr; in einem Abwärtstrend, weniger.
- Die Standard-Strategie ist ein Stop-Line mit einem Moving Average. Alternativ kann ein Stop-Line mit einem Moving Average invertiert mit einer durchschnittlichen realen Bandbreite eingesetzt werden.
Analyse der Stärken
Diese Strategie hat folgende Vorteile:
- Die Verwendung von Moving Averages zur Beurteilung von Trends filtert kurzfristige Marktgeräusche.
- Durch die Erhöhung der durchschnittlichen realen Schwankungsbreite als Filterbedingung kann vermieden werden, dass in einem wackligen Umfeld ein Handelssignal erzeugt wird, wodurch unnötige Verluste verringert werden.
- Eine Stop-Line in der Nähe des Moving Averages oder seiner Umkehrung kann schnell gestoppt werden, um die maximale Rücknahme zu verringern.
- Einfache Parameter-Einstellung, leicht zu verstehen und zu optimieren.
Risikoanalyse
Die Strategie birgt auch einige potenzielle Risiken:
- In einem linearen System gibt es oft einen gewissen Rückschlag, wenn ein Trend umgekehrt wird.
- Die Parameter-Einstellungen für die Moving Averages und die realistischen Durchschnittsschwankungen haben einen großen Einfluss auf die Strategie. Wenn die Parameter falsch eingestellt werden, werden Handelschancen verpasst oder unnötige Verluste erhöht.
- Die Strategie selbst berücksichtigt nicht die Beziehung zwischen Aktienpreis und Handelsvolumen.
Optimierungsrichtung
Die Strategie kann in folgenden Bereichen optimiert werden:
- Verschiedene Arten von Moving Averages werden getestet, um die am besten geeigneten Moving Average-Parameter für bestimmte Aktien oder Sorten zu finden.
- Optimierung der Periodizität der Moving Average-Parameter, um sie besser an die Eigenschaften der gehandelten Aktie oder Sorte anzupassen.
- Optimieren Sie die Parameter für die durchschnittlich realen Schwankungsbereiche und suchen Sie nach der optimalen Kombination von Parametern, um die Schwingungen zu filtern und die Tendenz nicht zu verlieren.
- Es ist wichtig, die Regeln für die Beurteilung der Transaktionsmenge zu erhöhen, um zu verhindern, dass ein erfolgloser Durchbruch auftritt.
- Verschiedene Methoden zur Verringerung des Schadens werden getestet und verglichen, um die optimale Lösung zu ermitteln.
Zusammenfassen
Die Trend-Tracking-Moving-Average-Strategie ist insgesamt eine sehr einfache und praktische Trendstrategie. Sie hat gleichzeitig eine gute Risikokontrolle. Obwohl die Strategie nicht viele Faktoren berücksichtigt, müssen die Parameter und die Stop-Loss-Methoden sorgfältig getestet und optimiert werden, ist sie insgesamt eine effektive Strategie, die leicht zu erlernen und anzupassen ist.
/*backtest
start: 2023-01-28 00:00:00
end: 2024-02-03 00:00:00
period: 1d
basePeriod: 1h
exchanges: [{"eid":"Futures_Binance","currency":"BTC_USDT"}]
*/

// This source code is subject to the terms of the Mozilla Public License 2.0 at https://mozilla.org/MPL/2.0/
// © Inkedlau

//@version=5
strategy('Swing Trend Strategy', overlay=true, pyramiding=1, default_qty_type=strategy.percent_of_equity, default_qty_value=100, initial_capital=1000, commission_value=0.1)

use_short = input.bool(false, 'Open Short Positions?')
exit_type = input.bool(true, 'Exit trade on Moving Average Cross?')
src = input.source(close, 'Source')
len = input.int(200, 'Trend Length')
ma_type = input.string('ema', 'Moving Average Type', options=['sma', 'ema', 'rma', 'wma', 'vwma'], tooltip='Select the type of Moving Average to use to calculate the Trend')
atr_multiplier = input.float(1., 'ATR Threshold', step=0.5, tooltip='Filter the ranging market using the Average True Range')

// ----------------------- DESCRIPTION -----------------------
// THIS SCRIPT IS A TREND FOLLOWING SYSTEM THAT USES A COMBINATION OF MOVING AVERAGE AND AVERAGE TRUE RANGE
// TO SPOT THE TRENDS AND ENTER THE MARKET ACCODINGLY.
// THE MARKET IS CONSIDERED IN AN UPTREND WHEN THE PRICE CLOSES ABOVE THE MOVING AVERAGE + THE AVERAGE TRUE RANGE OF THE LAST 10 PERIODS
// THE MARKET IS CONSIDERED IN AN DOWNTREND WHEN THE PRICE CLOSES BLOW THE MOVING AVERAGE - THE AVERAGE TRUE RANGE OF THE LAST 10 PERIODS
// BY DEFAULT, THE STRATEGY WILL ENTER LONG WHEN AN UPTREND IS SPOTTED, THEN CLOSES WHEN THE PRICE CLOSES BELOW THE MOVING AVERAGE
// THE STRATEGY WILL ENTER SHORT WHEN A DOWNTREND IS SPOTTED, THEN CLOSES WHEN THE PRICE CLOSES ABOVE THE MOVING AVERAGE

// ------------------ INDICATORS CALCULATION------------------
my_ma()=>
    ma = close
    if ma_type == 'sma'
        ma := ta.sma(src, len)
    if ma_type == 'ema'
        ma := ta.ema(src, len)
    if ma_type == 'rma'
        ma := ta.rma(src, len)
    if ma_type == 'wma'
        ma := ta.wma(src, len)
    if ma_type == 'vwma'
        ma := ta.vwma(src, len)
    ma

trend = my_ma()
atr = ta.atr(10)
uptrend = trend + atr * atr_multiplier
downtrend = trend - atr * atr_multiplier

// ---------------- ENTRY AND EXIT CONDITIONS ----------------

open_long = strategy.position_size == 0 and src > uptrend
close_long = exit_type ? strategy.position_size > 0 and src < trend : strategy.position_size > 0 and src < downtrend

open_short = use_short and strategy.position_size == 0 and src < downtrend
close_short = exit_type ? strategy.position_size < 0 and src > trend : strategy.position_size < 0 and src > uptrend

strategy.entry('long', strategy.long, when=open_long)
strategy.close('long', when=close_long)

strategy.entry('short', strategy.short, when=open_short)
strategy.close('short', when=close_short)


// ------------------ PLOTTING AND COLORING ------------------
tcolor = src > uptrend ? color.green : src < downtrend ? color.red : na

ptrend = plot(trend, color=color.blue, linewidth=1)
puptrend = plot(uptrend, color=color.green, linewidth=1)
pdowntrend = plot(downtrend, color=color.red, linewidth=1)
pclose = plot(close, color=na)

fill(puptrend, pclose, color=close > uptrend ? color.green : na, transp = 90)
fill(pdowntrend, pclose, color=close < downtrend ? color.red : na, transp = 90)