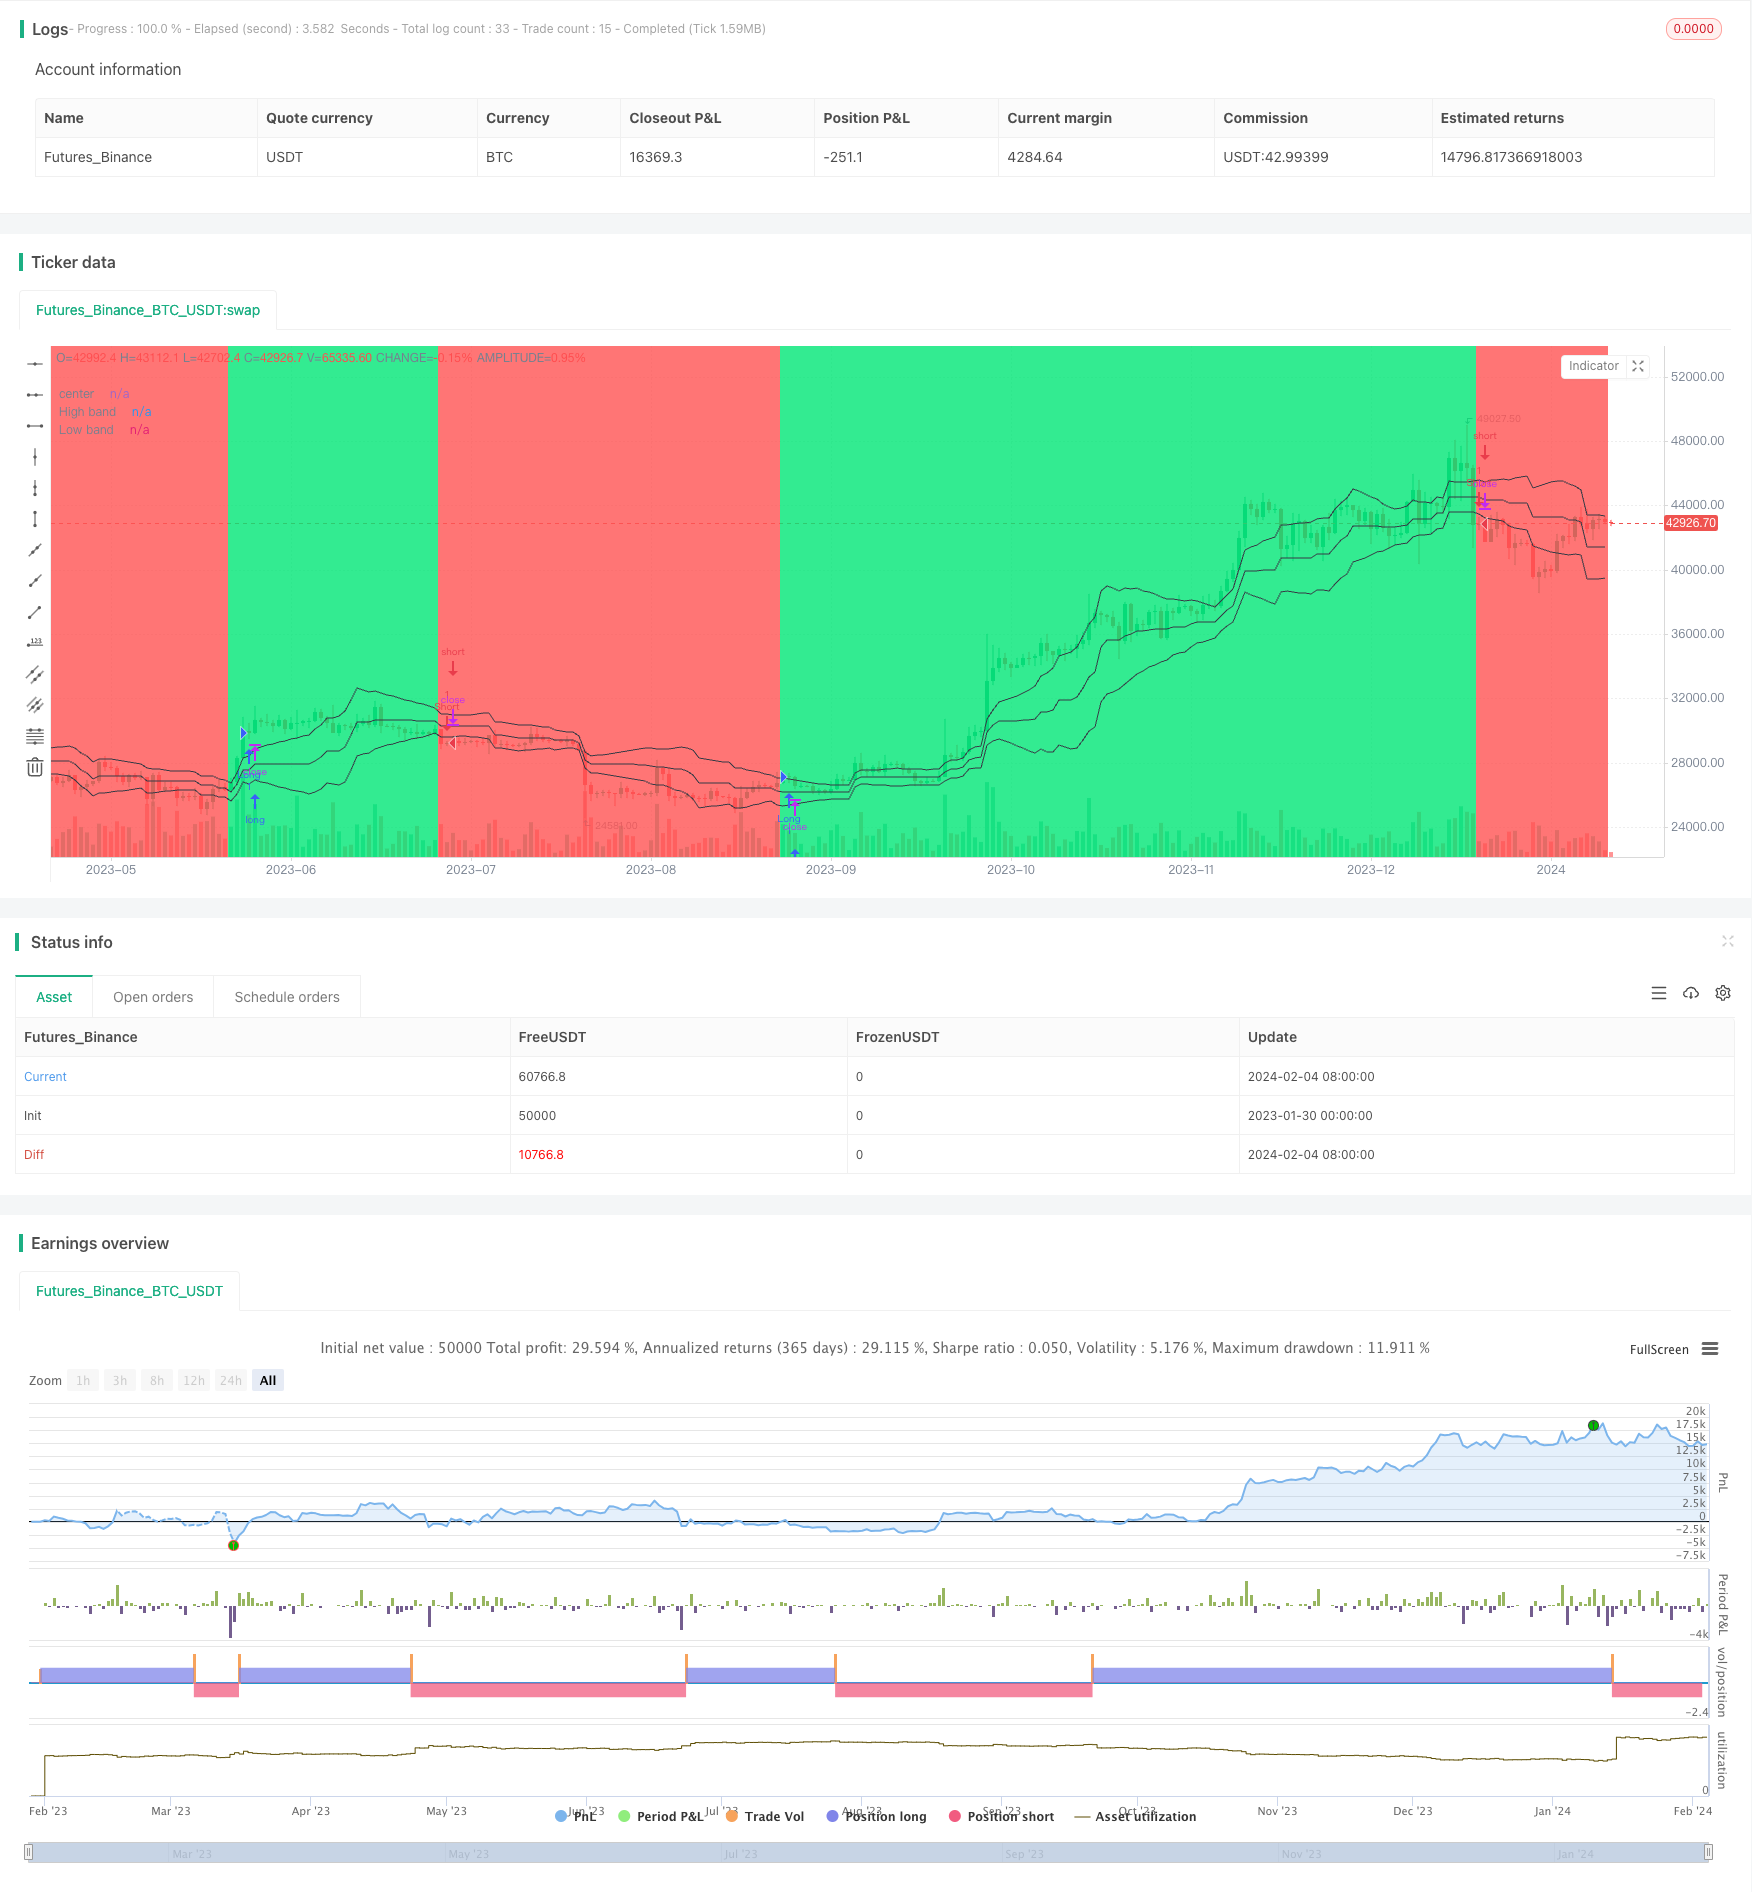
Preiskanal und gleitender Durchschnittswert nach Strategie
Schriftsteller:ChaoZhang, Datum: 06.02.2024Tags:

Übersicht
Diese Strategie identifiziert und folgt Trends, indem sie einen Preiskanal konstruiert, um die Abweichung des Preises von der mittleren Linie zu berechnen und gleitende Durchschnitte zur Filterung von Signalen zu verwenden.
Strategie Logik
- Erstellen Sie einen Preiskanal
- Berechnung des höchsten Höchstgehalts und des niedrigsten Tiefgehalts der vergangenen len Perioden
- Die mittlere Linie ist der Durchschnitt des höchsten Höchsten und des niedrigsten Niedrigsten
- Entfernung ist die absolute Abweichung des Preises von der Mittellinie
- Gleichmäßige Entfernung, um obere und untere Bänder zu erhalten
- Bestimmung der Trendrichtung
- Wenn der Preis unterhalb des unteren Bandes liegt, als Abwärtstrend definieren
- Wenn der Preis über dem oberen Bereich liegt, als Aufwärtstrend definieren
- Erstellen Sie Handelssignale
- In Aufwärtstrend, lang, wenn der Preis unter dem offenen oder unter dem oberen Band bricht
- In Abwärtstrend, Short, wenn der Preis über dem offenen oder über dem unteren Band bricht
Analyse der Vorteile
- Erfasst mittelfristige bis langfristige Trends
- Kombinationen mit Breakout-Signalen zur Vermeidung eines ineffizienten Handels auf den Bereichsmärkten
- Anpassbare Parameter für verschiedene Produkte
Risikoanalyse
- Bei schwankenden Trends sind geringfügige Verluste möglich
- Unangemessene Parameter-Einstellungen können Trendumkehrungen verpassen
- Überwachung der Handelshäufigkeit zur Vermeidung von Überhandelungen
Optimierungsrichtlinien
- Hinzufügen anderer Indikatoren zu Filtersignalen
- Dynamische Anpassung der Parameter des Preiskanals
- Einbeziehung von Stop Loss zur Optimierung des Risikomanagements
Schlussfolgerung
Die Strategie ist insgesamt ziemlich robust, um mittelfristige bis langfristige Trends effektiv zu verfolgen und gleichzeitig Handelssignale durch Trendbreakouts zu generieren.
/*backtest
start: 2023-01-30 00:00:00
end: 2024-02-05 00:00:00
period: 1d
basePeriod: 1h
exchanges: [{"eid":"Futures_Binance","currency":"BTC_USDT"}]
*/


//@version=2
strategy("Noro's Bands Strategy v1.1", shorttitle = "NoroBands str 1.1", overlay=true)

//Settings
needlong = input(true, defval = true, title = "Long")
needshort = input(true, defval = true, title = "Short")
len = input(20, defval = 20, minval = 2, maxval = 200, title = "Period")
color = input(true, "Color")
needbb = input(true, defval = false, title = "Show Bands")
needbg = input(true, defval = false, title = "Show Background")
src = close

//PriceChannel 1
lasthigh = highest(src, len)
lastlow = lowest(src, len)
center = (lasthigh + lastlow) / 2

//dist
dist = abs(src - center)
distsma = sma(dist, len)
hd = center + distsma
ld = center - distsma

//Trend
trend = close < ld and high < hd ? -1 : close > hd and low > ld ? 1 : trend[1]

//Lines
colo = needbb == false ? na : black
plot(hd, color = colo, linewidth = 1, transp = 0, title = "High band")
plot(center, color = colo, linewidth = 1, transp = 0, title = "center")
plot(ld, color = colo, linewidth = 1, transp = 0, title = "Low band")

//Background
col = needbg == false ? na : trend == 1 ? lime : red
bgcolor(col, transp = 90)

//Signals
up = trend == 1 and ((close < open or color == false) or close < hd) ? 1 : 0
dn = trend == -1 and ((close > open or color == false) or close > ld) ? 1 : 0

longCondition = up == 1
if (longCondition)
    strategy.entry("Long", strategy.long, needlong == false ? 0 : na)

shortCondition = dn == 1
if (shortCondition)
    strategy.entry("Short", strategy.short, needshort == false ? 0 : na)
Mehr
- Handelsstrategie für die Dynamische Neigungstrendlinie
- Erweiterte Handelsstrategie für RSI-Indikatoren
- RSI-Indikator Kreuzzyklusgewinn- und Stop-Loss-Strategie
- Trendverfolgungsstrategie auf der Grundlage des gleitenden Durchschnitts
- RSI- und Bollinger-Band-Fusionshandelsstrategie für LTC
- Optimierte Strategie für die Kreuzung des gleitenden Durchschnitts
- SMA-ATR-Dynamische Hinterhaltestrategie
- Strategie zur Rückkehrverfolgung
- Strategie für die doppelte Umkehrung von Arbitrage
- Kama und Trend auf Basis des gleitenden Durchschnitts nach Strategie
- RSI-Dynamische Positionsdurchschnittsstrategie
- Bollinger-Bänder und Kombinationsstrategie des RSI
- Dynamische doppelte exponentielle gleitende Durchschnittshandelsstrategie
- Eine doppelte Umkehrungs-Momentum-Index-Handelsstrategie
- Die Strategie des Bottom Hunters
- Bollinger-Band-Strategie mit Datumsbereichsauswahl
- Trendfolgende Stop-Loss-Strategie auf Basis eines Trendwarnindikators
- Zweigleichgeschaltete Stochastik Bressert-Strategie
- Stochastische und gleitende Durchschnittsquerschnittstrend nach quantitativer Strategie
- 5-Tage-Strategie für den Durchbruch der gleitenden Durchschnittskanäle in Kombination mit dem Kilometerkonzept