Überblick
Die Strategie kombiniert Bollinger Bands, RSI, mehrere Moving Averages und MACD-Indikatoren, um ein vollständiges Handelssystem zu erstellen. Zunächst wird die Preisschwankung durch Bollinger beurteilt und die Position des Preises in Bezug auf die Bollinger Bands verwendet, um den Trend zu bestimmen.
Strategieprinzip
- Der Trend wird anhand der Position des Schlusskurses gegenüber der Brin-Band-Mitte berechnet, wobei der Brin-Band mit 20 Zyklen und einer Doppel-Standardschwäche verwendet wird.
- Berechnen Sie den 14-Zyklus-RSI und beurteilen Sie den Überverkauf und Überkauf durch die Kreuzung des RSI mit den Niveaus 30 und 70, um eine potenzielle Umkehr zu erkennen.
- Berechnen Sie einfache Moving Averages für 34, 89, 144, 233, 377 und 610-Zyklen, um die Tendenz durch eine mehrköpfige Anordnung der Mittellinie zu bestätigen. Die Mittellinie kann auch als Unterstützungswiderstandslage dienen.
- Die MACD-Anzeige wird auf der Grundlage der Parameter 12, 26 und 9 berechnet und durch die Kreuzung der MACD-Säulen mit der 0-Achse unterstützt, um eine Trendwende zu bestimmen.
- Die Logik der Positionsauslösung basiert auf der Analyse der oben genannten Indikatoren:
- Positionseröffnung: Überposition, wenn der Schlusskurs oberhalb der Bollinger Bands-Mittelbahn liegt und die kurzfristige Durchschnittslinie oberhalb der langfristigen Durchschnittslinie liegt.
- Ausgleichsposition: Ausgleich der Hälfte der Position, wenn der Schlusskurs unter dem Brin-Band-Mittelkurs fällt, und der vollen Position, wenn die kurzfristige Durchschnittslinie unter dem langfristigen Durchschnittswert fällt.
Strategische Vorteile
- Die Brin-Band ist in der Lage, die Preisschwankungen objektiv zu quantifizieren und Trends zu bestimmen.
- Die Einführung des RSI-Indikators hilft bei der Beurteilung von Überkauf und Überverkauf und bei der Erfassung potenzieller Trendwendechancen.
- Die Kombination von mehreren Gleichlinien ermöglicht eine umfassendere Analyse der Trends auf verschiedenen Zeitskalen.
- Der MACD-Indikator dient als Hilfsmittel bei der Beurteilung von Trends und Umkehrungen und erhöht die Zuverlässigkeit des Signals.
- Die Logik der Positionseröffnung beinhaltet die Idee der Positionsverwaltung, die Positionen schrittweise reduziert, um das Risiko zu kontrollieren, wenn der Trend unsicher ist.
Strategisches Risiko
- Bei Erschütterungen können die Brin-Band- und Gleichschaltungssysteme häufig und widersprüchlich signalisiert werden.
- Der RSI und der MACD können sich unter starken Trends länger im Überkauf-Überverkauf-Bereich befinden und verlieren ihre Urteilsfähigkeit.
- Die Auswahl der Parameter (z.B. Brin-Band-Perioden, Durchschnittslinie-Perioden usw.) ist etwas subjektiv. Verschiedene Parameter können unterschiedliche Ergebnisse haben.
- Das Fehlen von Stop-Loss-Mechanismen kann zu einem erhöhten Risiko für einzelne Transaktionen führen.
- In den letzten Jahren hat sich die Bevölkerung in der Region stark zurückgezogen, da sie nicht in der Lage war, auf Extremsituationen wie Schwarze Schwimmtiere rechtzeitig zu reagieren.
Richtung der Strategieoptimierung
- Eine systematischere Optimierung der Parameter der verschiedenen Indikatoren, wie z. B. der Periode und Breite der Brin-Band, der Periode und der Schwelle des RSI usw.
- Die Einführung von mehr Bestätigungssignalen, wie z. B. Veränderungen im Verkehrsaufkommen, erhöht die Zuverlässigkeit der Signale.
- Die Einführung von Stop-Loss- und Stop-Stop-Mechanismen bei der Eröffnung von Leerpositionen ermöglicht eine bessere Kontrolle des Einzeltransaktionsrisikos.
- Berücksichtigen Sie die Einführung eines Positionsanpassungsmechanismus, der die Positionen in verschiedenen Marktbedingungen flexibel anpasst und die Gewinn-Risiko-Relation erhöht.
- Das Design für Extremszenarien, wie zum Beispiel die Absicherung auf Basis des VIX-Index oder die dynamische Gewichtung des Alpha-Faktors.
Zusammenfassen
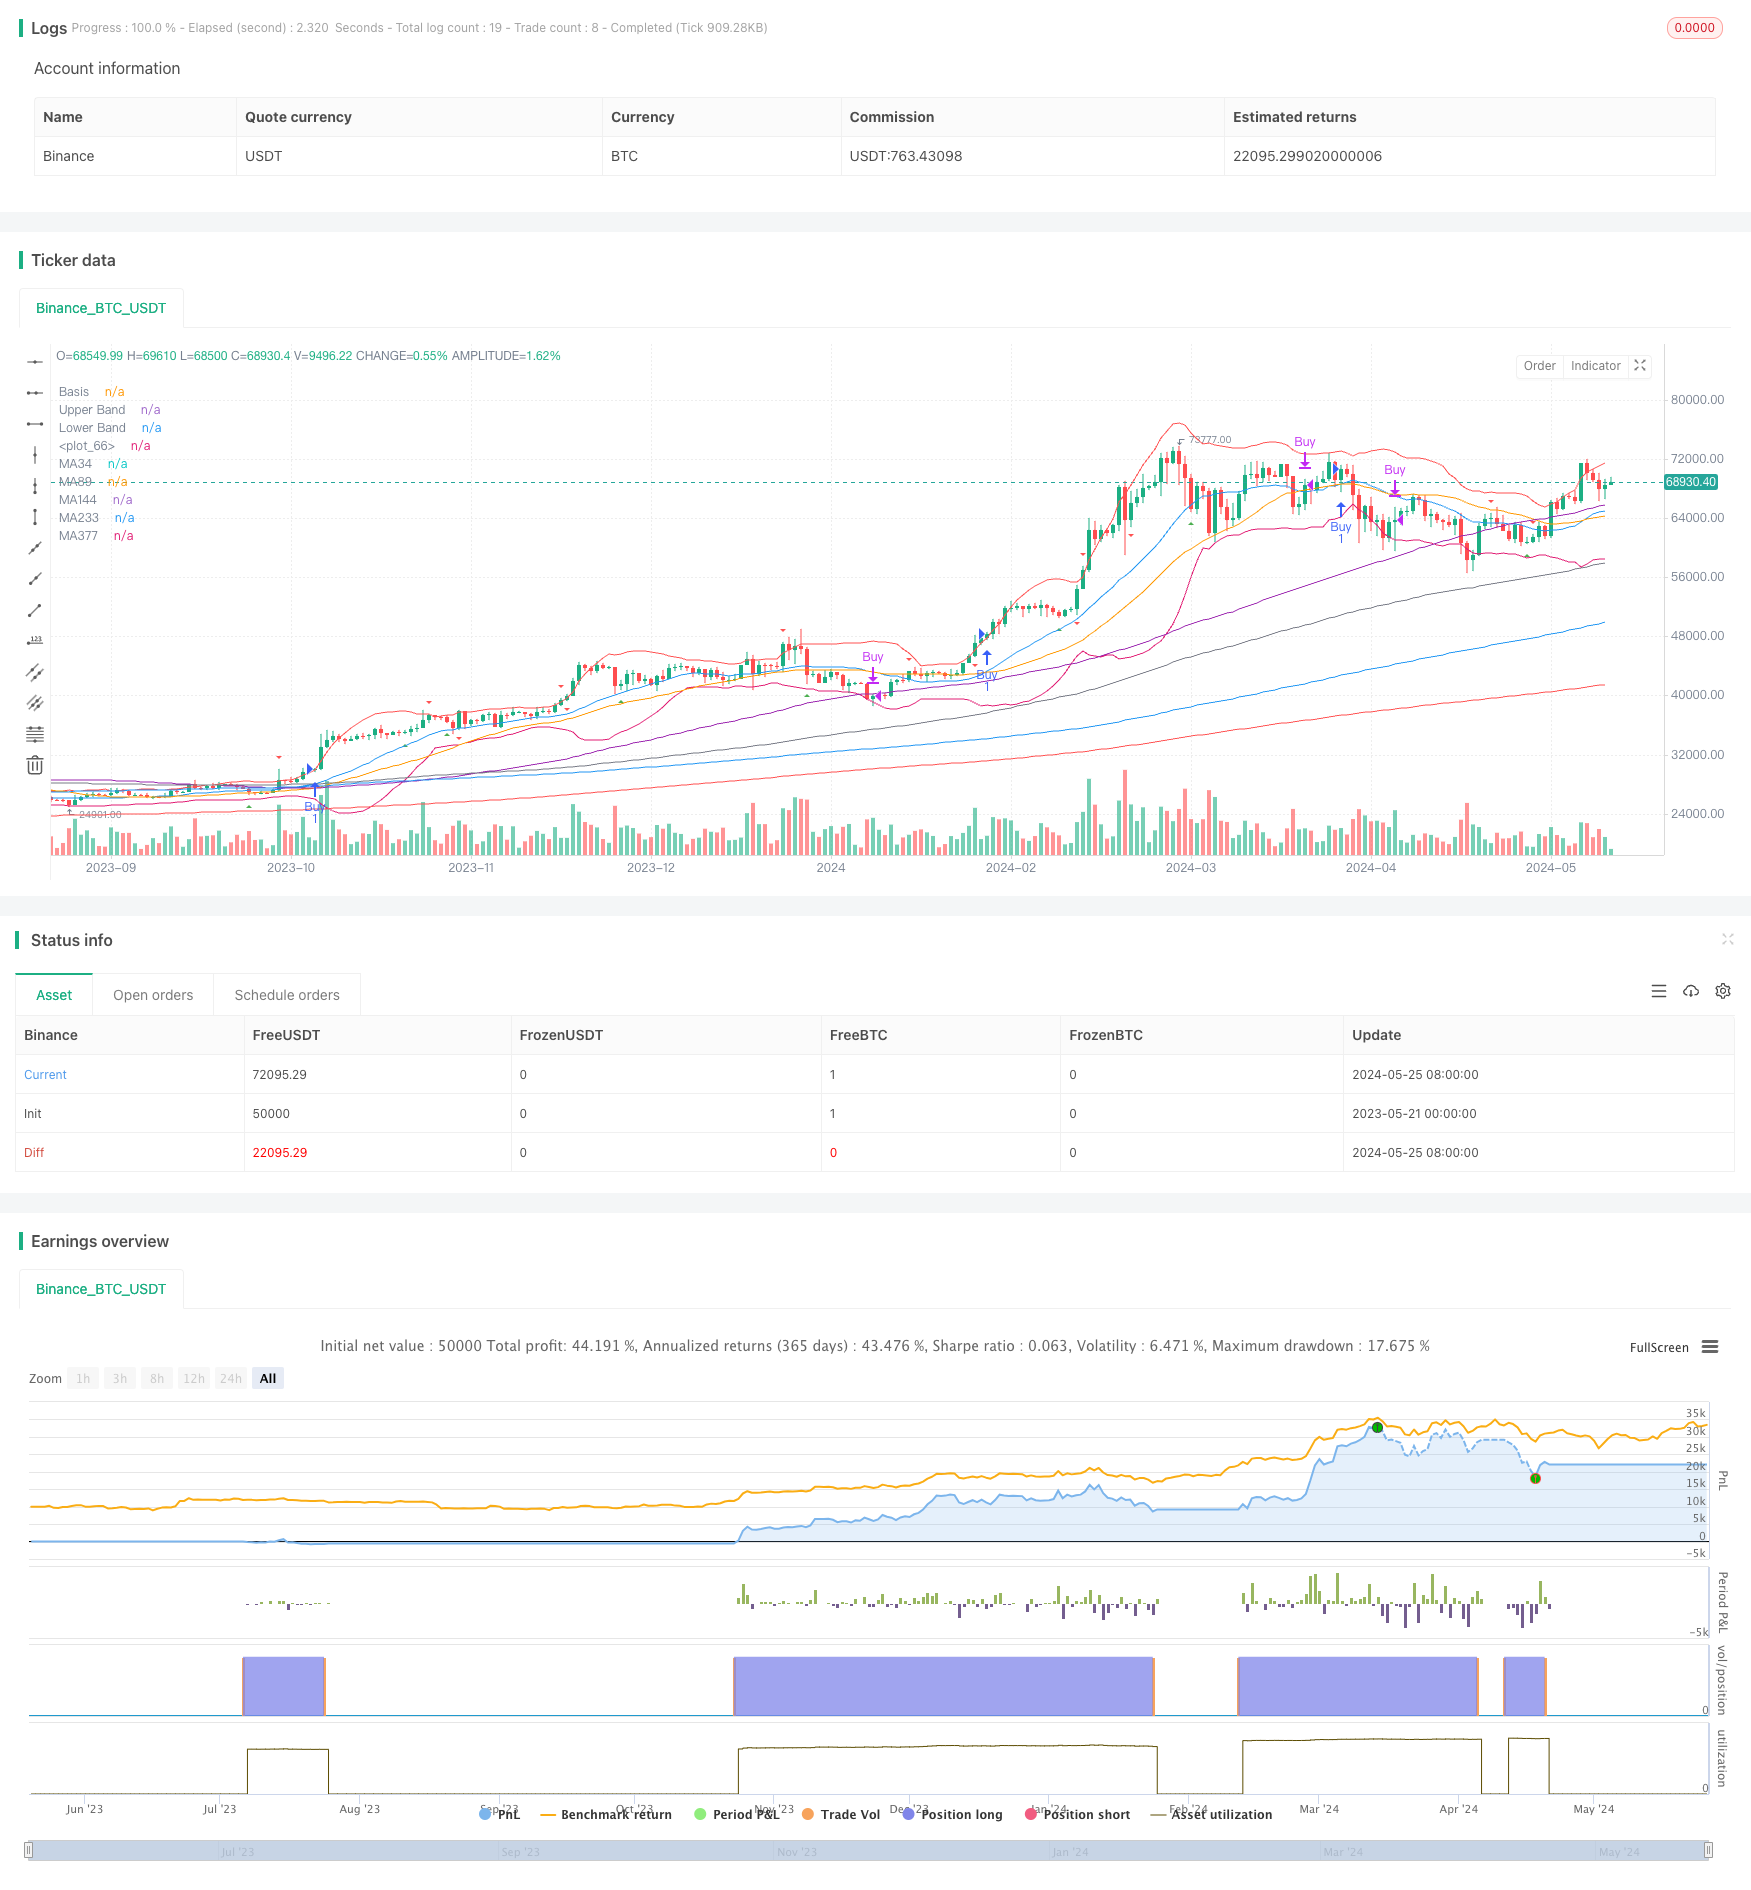
Die Strategie basiert auf mehreren Dimensionen, um ein relativ gutes Handelssystem zu erstellen, einschließlich Trendurteilen, Überkauf-Überverkauf-Urteile, mehrzeitige Analyse, Positionskontrolle usw. Die Strategie muss jedoch noch optimiert werden, um auf Erschütterungen und Extreme zu reagieren, und es fehlt an einer systematischeren Parameteroptimierung und Risikokontrolle. In der Zukunft können weitere Verbesserungen in Richtung einer feineren Auswahl von Signalen, einer dynamischen Umstellung der Befugnisse und einer Reaktion auf Extreme vorgenommen werden.
/*backtest
start: 2023-05-21 00:00:00
end: 2024-05-26 00:00:00
period: 1d
basePeriod: 1h
exchanges: [{"eid":"Binance","currency":"BTC_USDT"}]
*/

//@version=5
strategy("Bollinger Bands + RSI Strategy with MA", overlay=true)

// Bollinger Bands
length = input.int(20, title="BB Length")
mult = input.float(2.0, title="BB Mult")
basis = ta.sma(close, length)
dev = mult * ta.stdev(close, length)
upper_band = basis + dev
lower_band = basis - dev

// RSI
rsi_length = input.int(14, title="RSI Length")
rsi_oversold = input.int(30, title="RSI Oversold", minval=0, maxval=100)
rsi_overbought = input.int(70, title="RSI Overbought", minval=0, maxval=100)
rsi = ta.rsi(close, rsi_length)

// RSI Divergence
rsi_divergence_bottom = ta.crossunder(rsi, rsi_oversold)
rsi_divergence_peak = ta.crossunder(rsi_overbought, rsi)

// Moving Averages
ma34 = ta.sma(close, 34)
ma89 = ta.sma(close, 89)
ma144 = ta.sma(close, 144)
ma233 = ta.sma(close, 233)
ma377 = ta.sma(close, 377)
ma610 = ta.sma(close, 610)

// MACD Calculation
[macd_line, signal_line, _] = ta.macd(close, 12, 26, 9)
macd_histogram = macd_line - signal_line

// MACD Divergence
macd_divergence_bottom = ta.crossunder(macd_histogram, 0)
macd_divergence_peak = ta.crossover(macd_histogram, 0)

// Conditions for Buy and Sell
basis_gt_ma34 = basis > ma34
ma34_gt_ma89 = ma34 > ma89

// Entry condition
buy_condition = basis_gt_ma34 and ma34_gt_ma89
sell_condition =  basis <ma34

// Calculate position size
position_size = 1.0  // 100% capital initially

// Update position size based on conditions
if (sell_condition)
    position_size := 0.5  // Sell half of the position
if (not basis_gt_ma34)
    position_size := 0.0  // Sell all if basis < ma34

// Entry and exit strategy
if (buy_condition)
    strategy.entry("Buy", strategy.long, qty=position_size)
if (sell_condition)
    strategy.close("Buy")

// Plot Bollinger Bands and Moving Averages
bb_fill_color = basis > basis[1] ? color.new(color.blue, 90) : color.new(color.blue, 10)
plot(basis, color=color.blue, title="Basis")
plot(upper_band, color=color.red, title="Upper Band")
plot(lower_band, color=color.green, title="Lower Band")
fill(plot1=plot(upper_band), plot2=plot(lower_band), color=bb_fill_color, title="BB Fill")
plot(ma34, color=color.orange, title="MA34")
plot(ma89, color=color.purple, title="MA89")
plot(ma144, color=color.gray, title="MA144")
plot(ma233, color=color.blue, title="MA233")
plot(ma377, color=color.red, title="MA377")
plot(ma610, color=color.green, title="MA610")

// Plot RSI Divergence
plotshape(series=rsi_divergence_bottom, style=shape.triangleup, location=location.abovebar, color=color.green, size=size.small)
plotshape(series=rsi_divergence_peak, style=shape.triangledown, location=location.belowbar, color=color.red, size=size.small)

// Plot MACD Histogram Divergence
plotshape(series=macd_divergence_bottom, style=shape.triangleup, location=location.belowbar, color=color.green, size=size.small)
plotshape(series=macd_divergence_peak, style=shape.triangledown, location=location.abovebar, color=color.red, size=size.small)