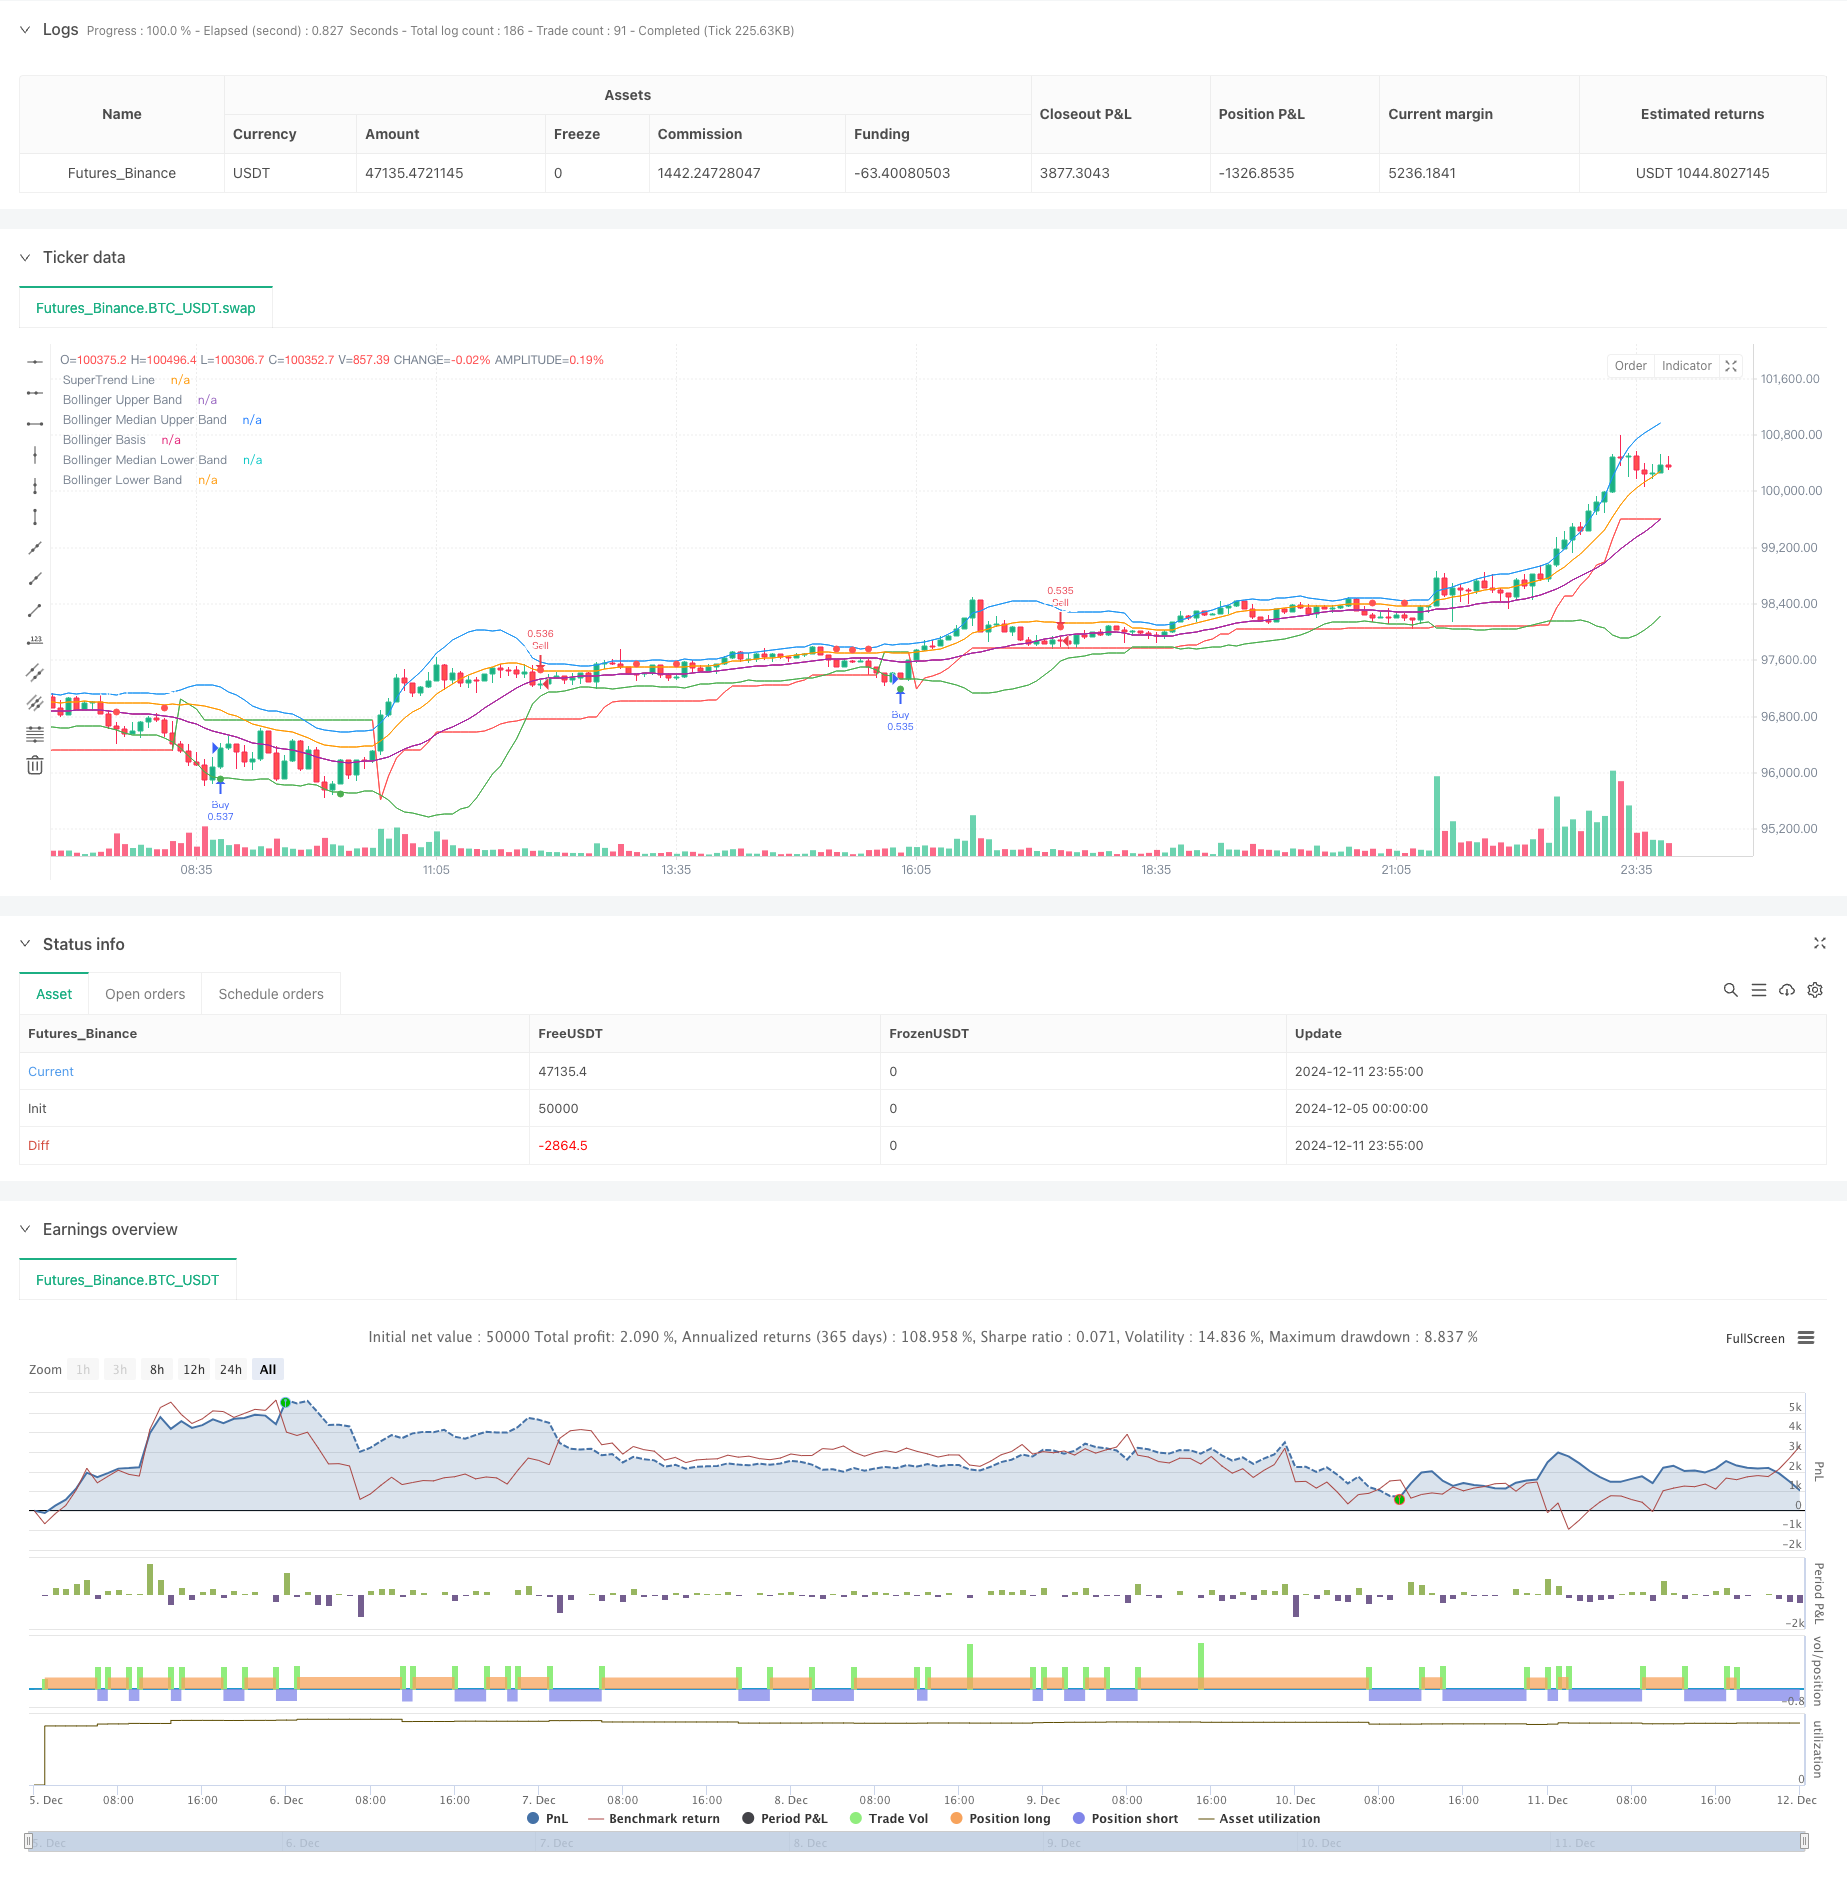
Strategieübersicht
Es handelt sich um eine intelligente Handelsstrategie, die Brin-Bands und Supertrend-Indikatoren kombiniert. Die Strategie verwendet hauptsächlich Brin, um Marktfluktuationsbereiche zu identifizieren, während Supertrend-Indikatoren verwendet werden, um die Richtung der Markttrends zu bestätigen, um in hochprobablen Positionen zu handeln. Die Strategie ist für verschiedene Handelsarten und Zeiträume konzipiert und funktioniert besonders gut in 30-Minuten- und 2-Stunden-Zeiträumen.
Strategieprinzip
Die Kernlogik der Strategie basiert auf den folgenden Schlüsselelementen:
- Mit einem Brinband mit 20 Zyklen und einer Bandbreite von 2 Standarddifferenzen, aus Oberbahn, Mittelbahn, Unterbahn und zwei Mittellinien
- Supertrend-Indikatoren mit 10-Zyklus-ATR und 3-facher Berechnung
- Eintrittszeichen:
- Mehrköpfiger Einstieg: Wenn der Preis den Brin-Band-Abwärtstrend berührt und der Supertrend-Indikator mehrköpfig ist
- Eintritt in den Bottom: Wenn der Preis den Bollinger Band berührt und der Supertrend-Indikator in die Bottom-Richtung zeigt
- Ausgangssignal:
- Mehrköpfige Ausstieg: Wenn der Schlusskurs die Supertrendlinie überschreitet und der Trend in die Luft umschaltet
- Ein leerer Ausstieg: Wenn der Kursabschluss die Supertrendlinie überschreitet und der Trend sich in einen Mehrkopf verwandelt
Strategische Vorteile
- Dual-Confirmation-Mechanismen erhöhen die Handelssicherheit: Die Orientierung von Fluktuationsbereichen in Verbindung mit den Brin-Bändern und Supertrends reduziert das Risiko von False-Breakouts
- Anpassung an Marktschwankungen: Brin-Band passt sich automatisch an die Bandbreite der Marktschwankungen an, so dass die Strategie gut anpassungsfähig ist
- Klare Handelssignale: Ein- und Ausstiegsbedingungen sind klar, einfach auszuführen und zurückzuverfolgen
- Flexible Parameter-Einstellungen: Brin-Band-Länge, Bandbreiten-Multiplikator und Supertrend-Parameter können an unterschiedliche Marktbedingungen angepasst werden
- Ausgezeichnete visuelle Effekte: Handelssignale in verschiedenen Farben und Formen markiert, um die Analyse und Überwachung zu erleichtern
Strategisches Risiko
- Schwankungsrisiken: Häufige Falschsignale bei schwankenden Kursbewegungen
- Rückstandsrisiko: Brin-Bands und Supertrends gehören zu den Rückstandsindikatoren und können die besten Einstiegspunkte bei schnellen Trends verpassen
- Parametersensitivität: Unterschiedliche Parametereinstellungen können zu großen Unterschieden in der Strategieleistung führen Es wird empfohlen, die Strategie mit folgenden Risikokontrollen zu versehen:
- Setzen Sie Stop-Loss-Positionen, um das Einzelrisiko zu kontrollieren
- Erwägen Sie die Aussetzung des Handels während der schnellen Schwankungen
- Regelmäßige Optimierung der Parameter für Marktveränderungen
Richtung der Strategieoptimierung
- Mehr Filter für die Marktfluktuation:
- Anpassung der Positionsgröße bei hoher Volatilität
- Hinzufügen von ATR-Filtern zur Vermeidung von Transaktionen während übermäßiger Schwankungen
- Das Problem ist, dass es nicht so einfach ist, das Problem zu lösen.
- Stop-Loss-Position basierend auf der dynamischen Einstellung der Brin-Bandbreite
- Dynamische Stop-Strategie in Kombination mit einer Supertrend-Schräglage
- Zeit-Filter hinzugefügt:
- Vermeidung von Zeit für wichtige Daten
- Verschiedene Parameter für verschiedene Zeiträume
- Optimierung der Signalbestätigung:
- Bestätigung zur Lautstärkeerhöhung
- Erwägen Sie eine Erhöhung der Trendstärke
Zusammenfassen
Es ist ein vollständiges Handelssystem, das klassische Indikatoren der technischen Analyse kombiniert und durch die Synergie von Brin-Bands und Supertrends sowohl in Trends als auch in Schwankungen gut abschneidet. Die visuelle Gestaltung der Strategie und die Flexibilität der Parameter machen sie sehr praktisch. Durch die empfohlene Optimierungsrichtung kann die Stabilität und Profitabilität der Strategie weiter verbessert werden.
/*backtest
start: 2024-12-05 00:00:00
end: 2024-12-12 00:00:00
period: 5m
basePeriod: 5m
exchanges: [{"eid":"Futures_Binance","currency":"BTC_USDT"}]
*/

//@version=5
strategy("Bollinger Band & SuperTrend Strategy (Standard Chart)", overlay=true, default_qty_type=strategy.percent_of_equity, default_qty_value=100)

// Bollinger Bands Settings
length_bb = input.int(20, title="Bollinger Band Length")
mult_bb = input.float(2.0, title="Bollinger Band Multiplier")
[bb_upper, bb_basis, bb_lower] = ta.bb(close, length_bb, mult_bb)

// Median Bands
bb_median_upper = (bb_upper + bb_basis) / 2
bb_median_lower = (bb_lower + bb_basis) / 2

// SuperTrend Settings
atr_length = input.int(10, title="ATR Length")
factor = input.float(3.0, title="SuperTrend Factor")

// SuperTrend Calculation based on standard chart OHLC data
[supertrend, direction] = ta.supertrend(factor, atr_length)

// Plotting Bollinger Bands
plot(bb_upper, color=color.red, title="Bollinger Upper Band")
plot(bb_median_upper, color=color.orange, title="Bollinger Median Upper Band")
plot(bb_basis, color=color.blue, title="Bollinger Basis")
plot(bb_median_lower, color=color.purple, title="Bollinger Median Lower Band")
plot(bb_lower, color=color.green, title="Bollinger Lower Band")

// Plotting SuperTrend
supertrend_color = direction > 0 ? color.green : color.red
plot(supertrend, color=supertrend_color, style=plot.style_line, title="SuperTrend Line")

// Customizable Signal Shape Inputs
buy_shape = input.string("shape_triangle_up", title="Buy Signal Shape", options=["shape_triangle_up", "shape_circle", "shape_cross", "shape_diamond", "shape_flag"])
sell_shape = input.string("shape_triangle_down", title="Sell Signal Shape", options=["shape_triangle_down", "shape_circle", "shape_cross", "shape_diamond", "shape_flag"])

// Entry Conditions
buy_condition = ta.crossover(low, bb_lower) and direction > 0
sell_condition = ta.crossunder(high, bb_upper) and direction < 0

// Exit Conditions
exit_buy_condition = ta.crossunder(close, supertrend) and direction < 0
exit_sell_condition = ta.crossover(close, supertrend) and direction > 0

// Strategy Logic
if buy_condition
    strategy.entry("Buy", strategy.long)
if sell_condition
    strategy.entry("Sell", strategy.short)

if exit_buy_condition
    strategy.close("Buy")
if exit_sell_condition
    strategy.close("Sell")

// Plot Buy Signal Shape
plotshape(series=buy_condition, title="Buy Signal", location=location.belowbar, color=color.green, style=buy_shape, text="BUY", textcolor=color.white)

// Plot Sell Signal Shape
plotshape(series=sell_condition, title="Sell Signal", location=location.abovebar, color=color.red, style=sell_shape, text="SELL", textcolor=color.white)