Options from a dynamic perspective are a win-win
Author: Inventors quantify - small dreams, Created: 2017-10-18 16:18:41, Updated:Options from a dynamic perspective are a win-win
Diversification of the outflow and use dimensions of mobility If pricing is a science, trading and hedging is an art. The necessity for dynamic hedging and adjustment stems from the strategic risk of all options, regardless of the size and perspective of the strategy, which is not eliminated as a source of potential profits. The scientific nature of dynamic hedging and adjustment stems from the numerical network of options, where the risk of all dimensions and perspectives can be quantified and derived from quantitative management schemes. The co-benefit of dynamic hedging and adjustment stems from the diversification of liquidity overflow and use dimensions.
- #### Overview of the risks of options
The risk of option buyers
The option buyer, also known as the option holder, must unconditionally satisfy the option buyer's requirements when the option buyer exercises the right to buy or sell the underlying asset on the last trading day.
Therefore, the maximum risk that the option buyer assumes is locked in as the principal amount, while the maximum return is unlimited. However, there are still some risk points that the option buyer needs to pay special attention to.
1.权利金风险
The profit of the option buyer is derived from the difference in the amount of the rights during the sale of the option. Although there is no possibility of an unlimited loss to the investor, the investor may lose all the rights when the price of the underlying asset changes in an unfavorable direction. Therefore, the investor should establish a good stop loss awareness.
2.高溢价风险
Both the time value of the option and the gold value of the option at the expiration date will be zero, and the investor may face a loss at expiration if he raises and buys the option at this time, just like the investor who raises during a housing bubble.
- ### The risk of option sellers
The option seller is usually defined as the option obligor, when the option buyer exercises the right to buy or sell the underlying asset on the last trading day, the obligor must unconditionally satisfy the option buyer's requirements. In the case of a purely sold option, the maximum gain is already locked in as entitlement income, while the losses incurred can be substantial.
1.保证金风险
The seller of the option pays the collateral during the transaction and adjusts accordingly according to the change in the price of the option. As with futures, additional collateral is required when the collateral is insufficient. The seller of the option is exposed to a high level of risk when the collateral reaches a strong horizon.
2.巨额亏损风险
Due to the non-linear nature of the option loss-profit, the option seller's maximum gain is locked in as the rights income. The option seller has no concept of maximum loss when the price of the underlying asset moves in an unfavorable direction. This places a higher requirement on the option seller's investors to have a sense of control and stop-loss awareness.
【1】 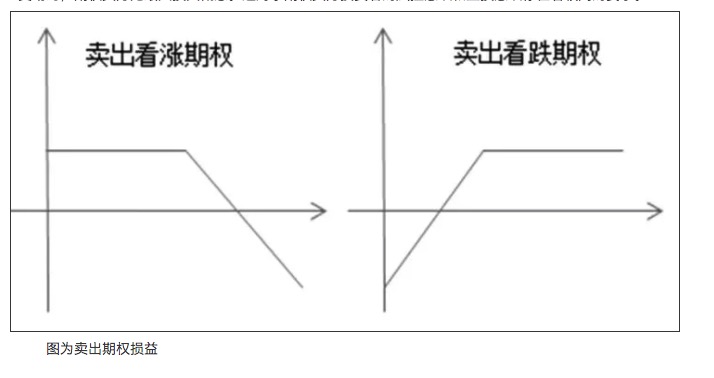
Graph of gain or loss on option sale
3.流动性风险
Liquidity risk refers to the risk that an investor is unable to trade at a specified price in a timely manner. It is a shared risk of the option seller and the option buyer, and is widespread in financial markets.
- #### Options are dynamic hedging
Statically, there is an unlimited risk in the seller's strategy, such as selling a wide spread, but the road is easy and easy, and it is not difficult to control the risk with small skills such as strategy adjustment, part adjustment and dynamic hedging.
1.Delta释义
The change in the price of an option caused by a change in the price of an option delta measure, which in a mathematical sense is the ratio of the price of the option to the price of the benchmark, or the price bias of the price of the option to the benchmark. For example:
If the Delta of a bean sprout 1801 option is 0.5, then the price of the bean sprout 1801 contract will increase by 1 yuan/tonne, and the option price will increase by 0.6 yuan/tonne, if other factors do not change.
2.联动规律
The first option is a delta + a delta = 1.
3.标的价格影响规律
The delta range is 0 to 1, the depth of the real value is 1 and the depth of the null value is 0.
The delta range is from -1 to 0, the depth of the real value is trending towards -1, and the depth of the null value is trending towards 0.
【2】 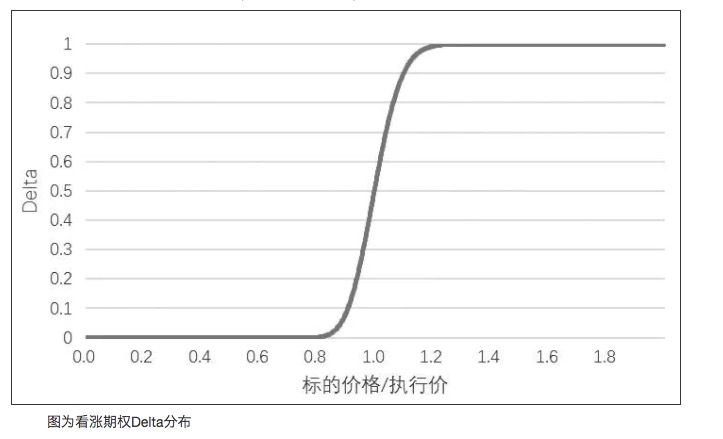
Graph for the delta distribution of options
【3】 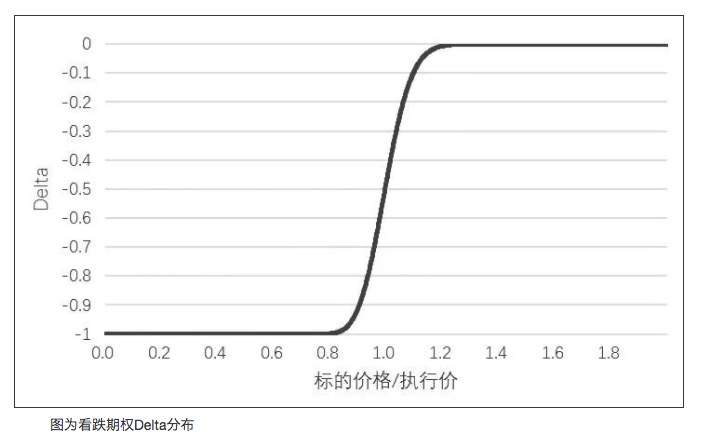
Graph of the Delta distribution of bear options
- #### 4. Due date affects the law
As the expiration date approaches, the absolute value of the delta of a real-valued option will gradually move towards 1, the absolute value of the delta of an even-valued option will remain near 0.5, and the absolute value of the delta of a zero-valued option will move towards 0.
【4】 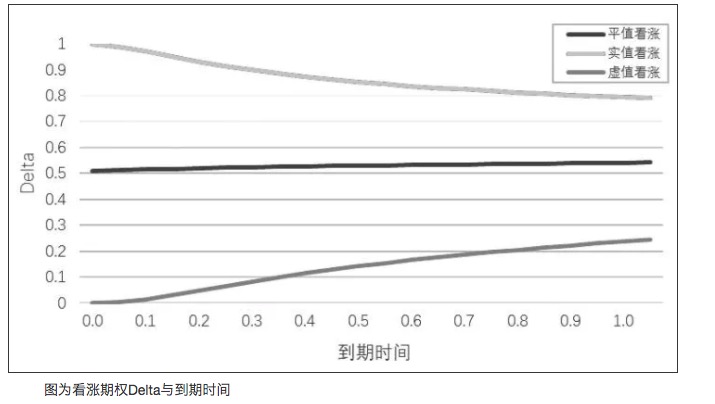 Figure for the option delta and expiration date
【5】 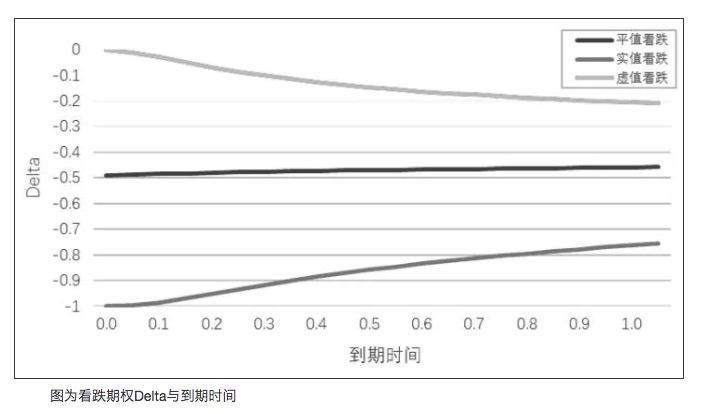 Figure for the delta and expiration date of the bear option
- #### 5. Fluctuations affect the law
If other factors do not change, the absolute value of the delta of the option will gradually move towards 0.5 as the volatility increases, i.e. the delta of the zero-value option will increase and the delta of the real-value option will decrease. When the volatility decreases, the delta of the zero-value option will decrease and the delta of the real-value option will increase.
- #### 6. Delta Neutrality and Hedging
Sometimes an investor may want the portfolio to be affected by unquoted price fluctuations, which is known as a delta-neutral portfolio, and to achieve this effect, the portfolio must be delta-hedged. For example, M1801 futures contract is priced at $2860/tonne, and the investor constructs and sells a broad-based portfolio as follows:
In order to keep the portfolio neutral, the investor needs to buy a 30-handed futures contract. In fact, Delta will change as the price, expiration time and volatility change, and Delta neutral hedging is a dynamic process. At the close, net Delta of the wide-span portfolio is sold to -10, at which point the investor needs to sell or buy back the 10-handed M1709 futures contract, adjusting the Delta of the option futures portfolio to neutral.
- #### 7. Hedge difficulty and speculation
It is important to note that the above Delta hedging is also an ex post adjustment, and there are difficulties in adjusting backlogs, passive follow-up of the market and fees. Different hedging mechanisms, different Greeks calculations, will produce different profit and loss curves and hedging results. In the face of different Delta caps and market characteristics, investors can also choose different hedging instruments.
Options hedging difficulty based on volatility distribution
Volatility is a measure of the speed and direction of price movements of a pair, and its specific value is the annualized standard deviation of the daily rate of return. Assuming that the current Dow Deep 300 index is 2000 points, the trader believes that the current market has an annualized volatility of 20%, the daily volatility is about 1.25% (25 points).
Options pricing relies on the measurement of volatility, which has significant practical implications. The higher the volatility, the greater the probability of exiting a potential big trend or big swing.
1.波动率分布
As with the trend of the spread, there is a higher margin of safety if the volatility distribution of the indicated futures is concentrated, the variation is regular, the disruption is small, the option hedge and the option strategy is built. The volatility curve is based on the idea of mean value return, which makes the future direction and extremes of the volatility rate analyzable.
【6】 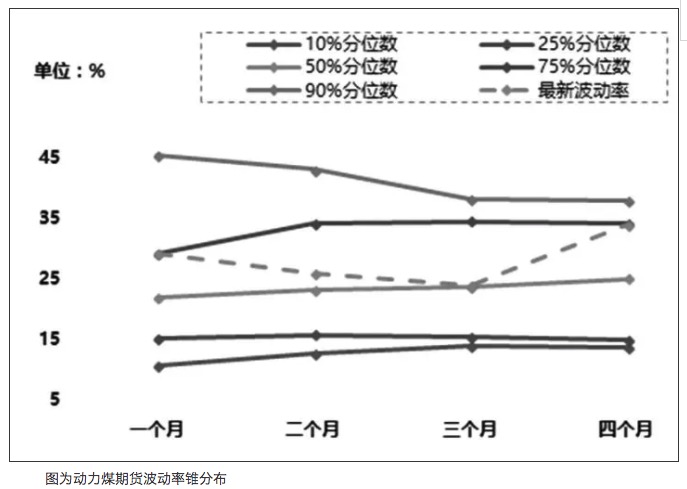
Chart showing the volatility of power coal futures
【7】 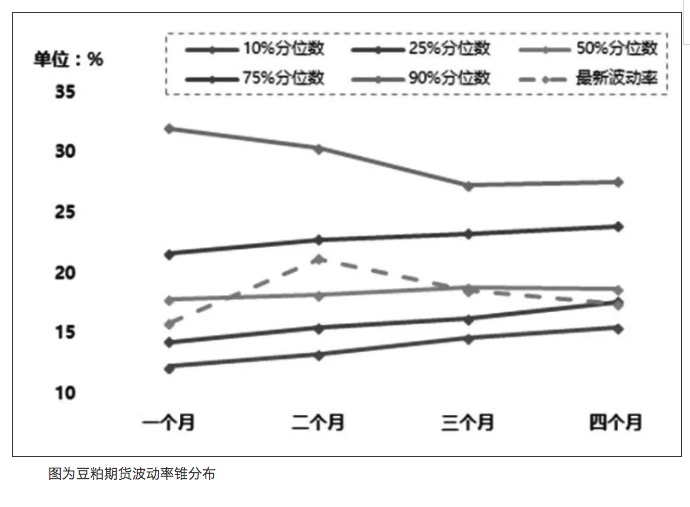
Graph showing the volatility of soybean futures
2.波动率预测
The GARCH model family introduced the long-term mean-difference level of expected response, which solves the problem of the inability of the EWMA to achieve volatility mean regression. The results of the GARCH model analysis are influenced by estimates, sampling frequency and prediction methods, and cannot comprehensively reflect factors such as major events, fundamental information and financial information.
- #### The difficulty of options hedging from the shape of the delta curve What do you mean? Dynamic delta-neutral hedging strategies, while widely and effectively used to control risk, neither the delta-based hedging strategy nor the fixed delta-ranged hedging strategy can effectively offset the effect of delta-specific volatility on hedging performance under different term structures and implied volatility of options. What do you mean? For this reason, it is not possible to effectively consider the effect of time decay factors on Gamma under different options term structures, i.e. the closer the contract is to the expiration date, the more dramatic the changes in Gamma near the equilibrium. If automated hedging with the same frequency and span is done, the problem of a larger position threshold with a lower hedging frequency arises.
How hard is it to hedge options based on the spread?
Since the sharp decline in the stock market in 2015, the IH index 50 futures have been significantly diluted and show an overall trend of gradual recovery. In other words, for investors who sell IH hedges, the gradual recovery of the key difference is a potential risk that may lead to hedge inefficiency. In addition, the dividend mechanism of the 50 ETF causes the diluted rate to show certain seasonal variations, adding additional disruption to the option hedge. Of course, investors can also design a corresponding adjustment strategy based on the analysis of seasonal laws.
On commodity options, the monthly margin of the commodity is not constant, or there is a strong regularity, or is strongly influenced by fundamental factors. Cross-contract option hedging can greatly discount the effectiveness of the hedge and the overall loss gains if it is not able to effectively cover the consumption of the margin changes.
- #### The difficulty of option hedging depends on the type of option What do you mean? U.S. options can be exercised at any time before or on the expiration date. European options can only be exercised on the expiration date. Both white sugar and soybean options are U.S. options.
1. The implied volatility of options What do you mean? Buyers of U.S. options can exercise the option on or before the expiration date. Currently, wholesalers use BAW to price soybean options, while dealers use the binary tree model to price white sugar options.
For most investors, the most intuitive feeling is the difference in the implied volatility of the options under the same circumstances. US options have subtle differences in implied volatility due to the premium of the up-front warranty compared to European options.
The implied volatility of commodity options settlement is calculated at the settlement price, not the closing price. According to the calculations, the implied volatility calculated at the closing price will increase slightly compared to the settlement price. What do you mean? 2. Prior authorization
Buyers of US options have the right to advance. It is noteworthy that the advance will waive the time value of the option, giving up the potential gains from rising volatility rates.
After the buyer has the option, the seller's position layout will inevitably change. The hedging of passive positions involves issues of slippage, fees, and quoted prices. At the same time, the option buyer has the right to waive the option, and it is necessary for the option seller to estimate the approximate number of positions that may be allocated.
- ### Options are a premium
1.交易维度立体化
Options prices are influenced not only by the numerical value of the quoted price, but also by factors such as the time of the period, the magnitude of the price fluctuation in the index, forming three main strategic dimensions with direction, time and volatility at its core.
On the directional side, investors can not only realize price differential gains from traditional futures price fluctuations, but also adapt well to fluctuating markets and can effectively leverage the leverage of options to magnify the profit multiplier.
For example, on October 13, 2017, soybean futures jumped about 3%, and investors can earn a positive return of 14% if they buy multiple futures in half positions, and a positive return of about 50% if they buy a single set of options in half positions.
2.风控维度可视化
Based on the traditional collateral risk control dimension, the option implements a quantified system of continuity risk control. The maturity loss and profit chart implements a graphical presentation and quantified definition of the option expiration risk, and the Greek letter implements a measurement and adjustment basis for continuity risk.
For example, if an investor builds a bull market portfolio with a 50 ETF option, the components of the portfolio are purchased for 50 ETFs on October 2.80 and sold for 50 ETFs on October 2.85 and the profit and loss distribution of the portfolio is shown as follows:
【8】 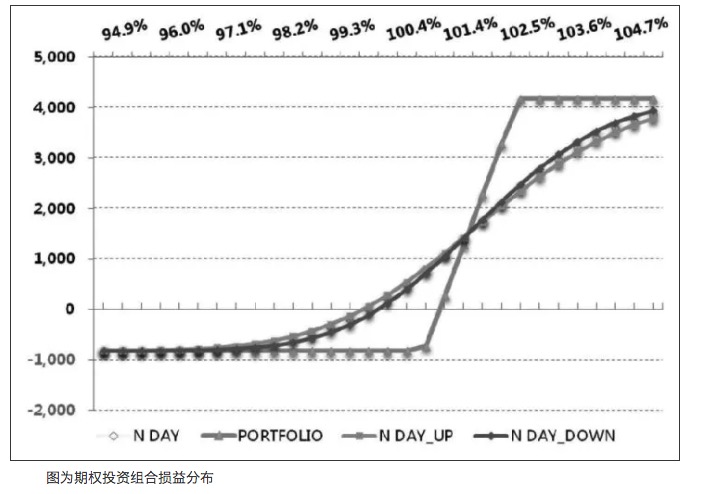 Graph showing the profit and loss distribution of an option portfolio
For the portfolio, if the futures on the next trading day rise 100 points, the investor's interest in the portfolio will essentially be able to run to gain from the decline in time value. If the futures on the index do not fluctuate significantly, but the implied volatility of the options shows an upward trend, there is also a high possibility of compensating for the erosion of time value.
3.盈利来源多元化
Traditional futures markets have a fixed trading participant within the futures market, and trading in the futures market is essentially a zero-sum game. For options, the hedged world opens up a link between the options and other indicated commodities, forming liquidity support for other commodities.
It is clear that after the IPO of the option at the end of March, the volume of futures on the non-core contract, the 1707 Futures, was significantly higher than last year, increasing by almost three or four times, and the bid-ask spread also shrank accordingly, greatly improving liquidity.
Translated from Options House
- Please tell me which time point the data retrieved when the API was called is based on?
- The code for the Bitcoin coin.
- Why is there only four pairs of BCH_USD, BTC_USD, ETH_USD, and LTC_USD in bitfinex?
- The advantages and disadvantages of the three major categories of machine learning algorithms
- In the meantime, I'm going to start a new blog, and I'm going to start a new blog, and I'm going to start a new blog.
- Mechanism of final viewing
- Submitted Bug: An interaction button without a default parameter value when creating a policy failed to save
- Can the retargeting system select other currencies?
- Please translate the buy plan page
- Bitfinex has three markets, how do you get the robot to choose?
- Bitfinex counter-measurement and counter-measurement currency units are inconsistent
- How do you view the effectiveness of the backsliding and gold forks?
- Bithumb received account information in error
- Feature request : please add support for JavaScript like console for ᴀᴘɪ access
- How do you make gold forks?
- Built-in function_Cross analysis and instructions
- “Plan expired” while I never bought a plan…
- How do we get data from decentralized exchanges?????
- Digital currency price monitoring analysis real-time analysis Bitcoin and Bitfinex failed to operate successfully
- Poloniex has reported an error?Error: (Exchange_Register): platformId: 27, currency: BTC_ETC, Msg: Peroid does not support Register FILE: 803 reg FILE:1264