Quantified research on the basics of coin circles - stop believing in all kinds of crazy professors, data is objective!
Author: Written by TradeMan, Created: 2024-04-07 20:59:09, Updated: 2024-06-13 14:08:29
Hello~Welcome come to my channel!
Welcome to my channel, I'm an expert, a Quant Developer, and a full-time developer of trading strategies such as CTA & HFT & Arbitrage.
Thanks to the FMZ platform, I will be sharing more content related to quantitative development on my quantitative channels and working with traders to maintain the prosperity of the quantitative community.
For more information, please go to my channel.The cottage is now in the hands of a craftsman.
Do you still not know where the big plate is? Do you feel anxious and anxious when you don't get in the car? Do you know if you should or shouldn't sell coins in your car? Have you ever watched the various yoga teachers and their families point fingers at the river?
Please don't forget we are Quant, we analyze data, we speak with objectivity!
Today I'm here to share some of my research on the fundamental quantification of the coinage ring. Each week we will monitor a large number of fundamental quantification indicators on all fronts, objectively presenting the current state of the market and proposing hypothetical future expectations. We will draw a comprehensive picture of the market from macro fundamental data, cash inflows, exchange data, derivatives and market data, and numerous quantitative indicators (chain, miners, etc.). Bitcoin has a strong cyclical and logical multiplicity, which can be found in many historical references.
The first is macro basic data.
1, market value and share of industry
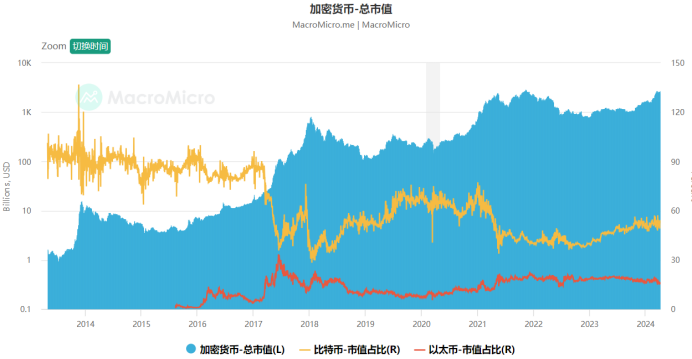 The total market capitalization of cryptocurrencies is close to $2.5 trillion, and it is still a step away from the previous high breakthrough, in the context of Bitcoin has broken the previous historical high, if again the upsurge brings the total market capitalization breakthrough, then it can be considered as a new round of bull market in the world of the industry systematically come. At the same time, Bitcoin's share of the world is maintained at about 50%, this number has decreased from the previous 21 years of bull market of about 60% and recently due to the impact of the ETF is in fact the hottest variety of tokens in the market, the market share is still steadily decreasing per bull, I think that in addition to Bitcoin's share of the crypto industry, various projects are likely to have more attention, if the bull market develops further, Bitcoin's share of the market will begin to fall, more funds from various sectors and varieties will flow in.
2, the world's four largest central bank money supply
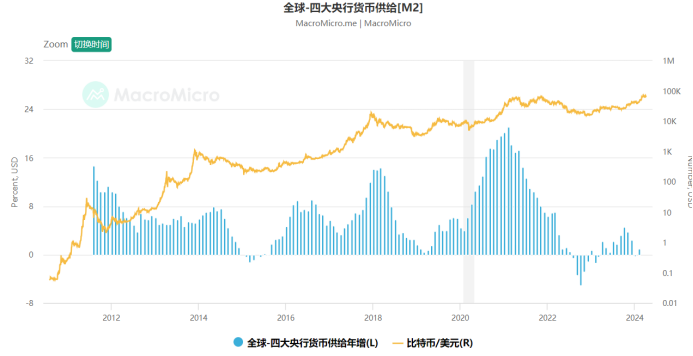 Let's look at the amount of money supplied by the four major central banks (US, EU, Japan and China) M2, thus representing the amount of fiat money in the market. Compared to fiat currencies that can be created in large quantities, Bitcoin has the characteristics of "limited supply", and was created in 2008 with the purpose of resisting the constant depreciation of fiat wealth by ordinary people. When the four central banks' money supply continues to rise, it may strengthen market doubts about the value of fiat currencies, which is favorable to bitcoin; on the contrary, when global monetary policy begins to collect fiat currencies, it is less favorable than the trend.
Second, the flow of money.
1, Bitcoin ETFs
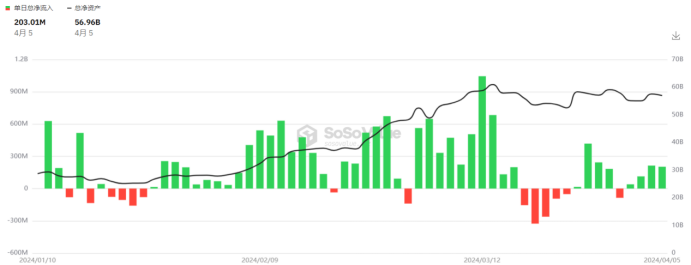 Bitcoin ETFs are flooding in, with total ETF assets at 56B, which is strongly correlated with the price of Bitcoin, and we need to continue to monitor the flow of ETFs.
2, Stabilization of the dollar
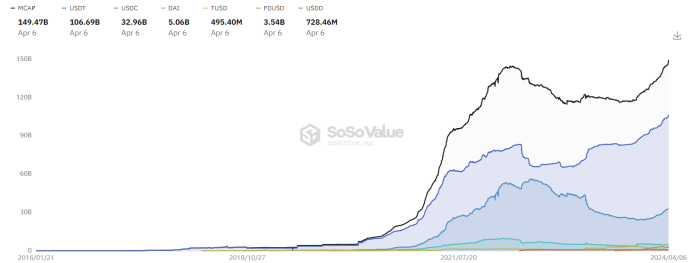 The total market capitalization of the USD stablecoin reached 150B, the USDT market share stabilized first, and the supply of stablecoins broke new historical highs, indicating that the new historical high of Bitcoin is strongly supported by the dollar level.
Third, the flow of data into and out of the exchange.
1, Token reserves of the exchange
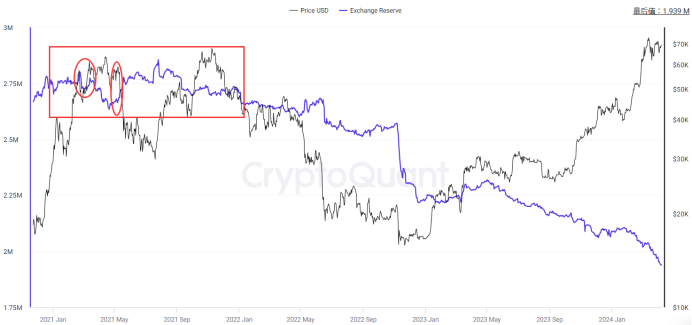 Let's look at the exchange's Bitcoin reserve data, which is defined as the total amount of tokens held at the exchange's address. The total reserve of the exchange is an indicator of the market's sales potential. As the value of the reserve continues to rise, for spot trading, a high value indicates increased selling pressure. For derivatives trading, a high value indicates that there may be high volatility.
2, the flow of tokens into and out of the exchange
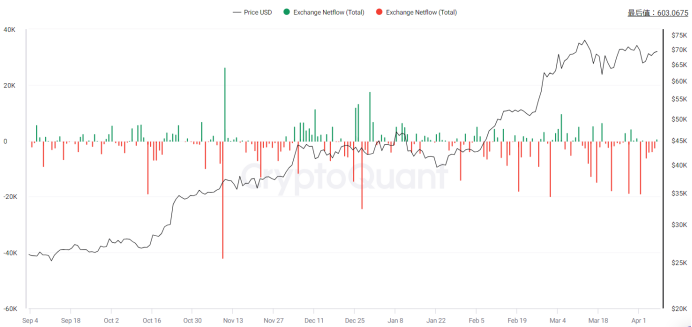 We further look at net inflows and outflows of exchanges, where exchange inflows refer to the movement of a certain amount of cryptocurrency into an exchange wallet, and outflows refer to the movement of a certain amount of cryptocurrency out of an exchange wallet. Net inflows are the difference between the flow of BTC into and out of the exchange. Increased inflows may mean the sale of individual wallets (including sharks) and indicate selling power. On the other hand, an increase in exchange inflows may mean that traders have increased their DL position in order to store DLs in their wallets.
Fourth, derivatives and market transactions
1, the rate of permanent capital
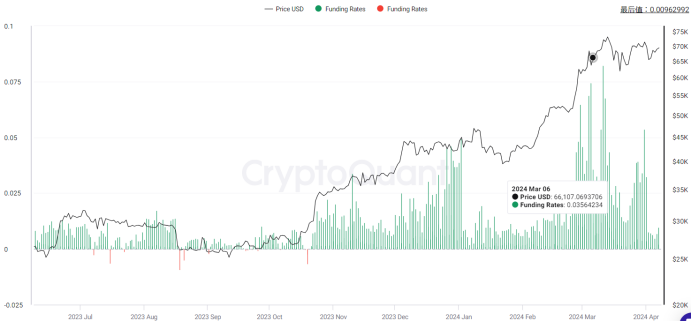
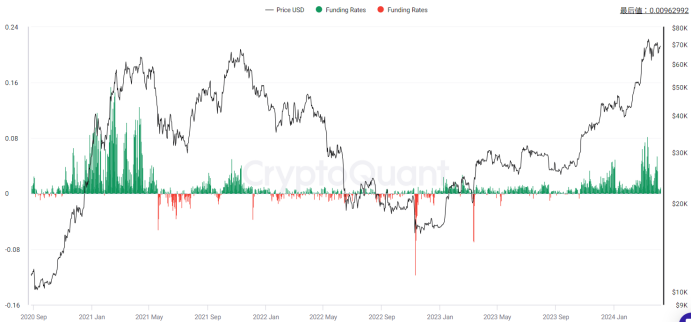 A capital fee is a fee paid periodically to a multi-head or short-head trader based on the difference between the spot and the perpetual contract market price. The capital fee makes the price of a perpetual contract close to the index price. All cryptocurrency derivatives exchanges use a perpetual contract financing rate, giving the capital rate for periodic and exchange rates, the standard unit being a percentage. The capital fee represents a trader's view of betting positions in a perpetual short-term market.
With the price rising, the current Bitcoin fee is significantly increasing, peaking at 0.1%, indicating the dry heat of the short-term market, but has been slowly declining. In the long run, there is still a gap with the 21st year of the overall bull market, and individuals believe that from the level of the fee alone, it is far from the long-term top. We need to constantly monitor the fee, pay attention to the extreme situation of the fee and whether it is close to the historical highs, individuals believe that the focus is on the departure of the fee from the price, i.e. the price continues to rise, but the price peak has exceeded the previous high, showing that the market price is overestimated and is not able to support the real group, if this happens, it will be a signal of the top.
2, the whole network is more empty than
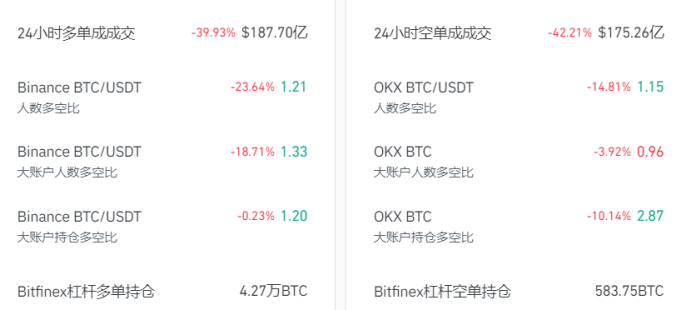 The role of this data is to show the tendency of retailers and big players. It is well known that the total position value of many parties in the market and the total position value is equal. The total position value is equal, but the number of holders is different, which means that the per capita position value of one party with a large number of holders is small, mainly retailers, while the other is mainly large and institutional.
Fifth, quantify the indicators.
1, MAVR ratio
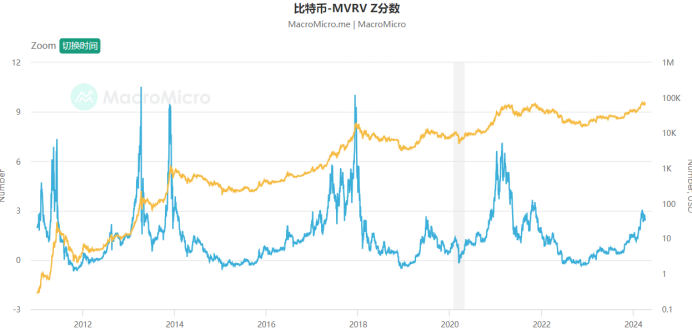
Definition: The MVRV-Z score is a relative indicator of Bitcoin's "market value in circulation" minus "market value achieved" and then standardized by the standard of market value achieved, with the formula: MVRV-Z Score = (market value achieved) /Standard Deviation (market value achieved) where the "market value" is based on the value of transactions on the Bitcoin chain, the "final total moving price" of all Bitcoin on the chain is added. Therefore, if the indicator is too high, it indicates that the Bitcoin market presents a high, unfavorable price of the coin relative to the actual value; on the contrary, it presents a low valuation.
Explanation: In a nutshell, the average cost to observe the network-wide chip, generally the low point below 1 is more concerned, when buying is lower than the cost of most people's chips, has a price advantage. The general high point around 3 is already very hot, and is the appropriate range for short-term chip sales. Currently, Bitcoin MVRV has risen a lot, gradually entered the sell-out range, but there is still a little room, you can prepare for a gradual sell-out plan.
2, the Puell Multiple
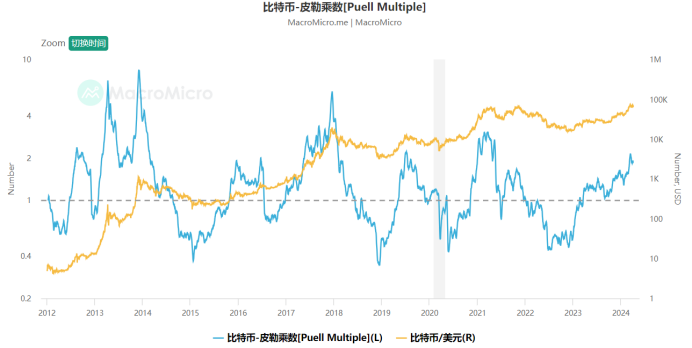
Definition: The Pillar multiplier calculates the ratio of "current miner revenue to the average over the past 365 days", where the miner revenue is mainly the market value of newly issued bitcoins (the newly increased supply of bitcoins will be obtained by the miner) and the associated transaction fees, and can be used to estimate the miner earnings status, with the formula: Pillar multiplier = miner earnings (the newly issued bitcoin market value) / 365 days moving average miner earnings (all in dollars) The sale of mined bitcoins is the main revenue of mined bitcoin miners, with subsidies for the capital investment of mining equipment and electricity costs in the mining process, so the average miner earnings interval over the past period of time can be considered the lowest threshold to maintain the operating costs of the mine.
Explanation: Currently, the Piler multiple is high, greater than 1 and close to the historical high, considering the extreme decline in the value of the bull market per round, it should be started to consider the plan to sell gradually.
3, the cost of each transaction is in dollars
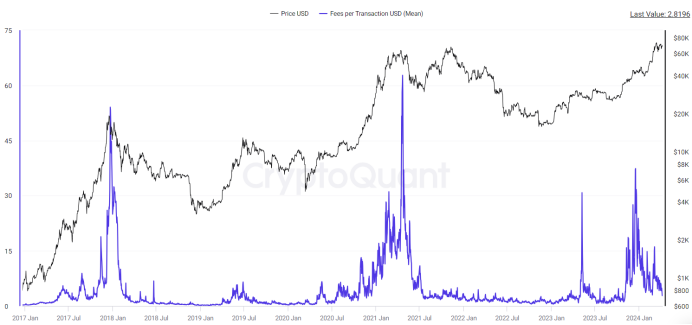
Definition: The average cost of each transaction, calculated in dollars.
Explanation: Attention is needed to extreme transfer fees, where each transfer on the chain has meaning, extreme transfer fees represent urgent large-scale action, historically an important reference at the top, and currently there are no overly exaggerated single transfer fees.
4, the number of Bitcoin retail addresses
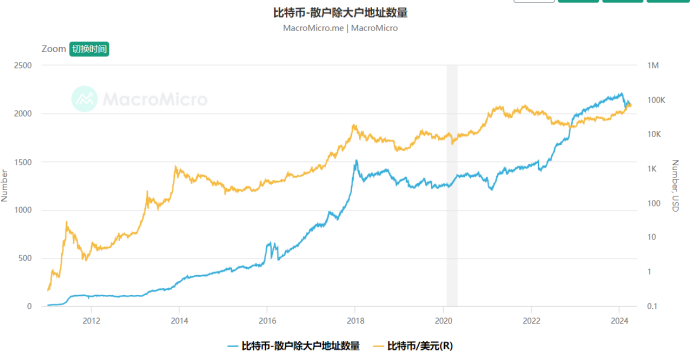
Definition: From the address distribution of the number of Bitcoin holders, the trend of Bitcoin holdings can be approximated. We separate retailers (holding less than 10 Bitcoins) from large households (holding more than 1000 Bitcoins) to calculate the "Bitcoin retailers/large households address ratio". When the ratio rises, it means that retailers hold more Bitcoin, and Bitcoin congregants send their chips to more retailers at the end of the bull market, and the upward trend in the price of Bitcoin is relatively loose; conversely, it means that the price of Bitcoin is relatively stable.
Explanation: There is a need for continuous monitoring and a gradual withdrawal can be considered when large households are continuously distributing chips to retailers.
5, Bitcoin mining costs
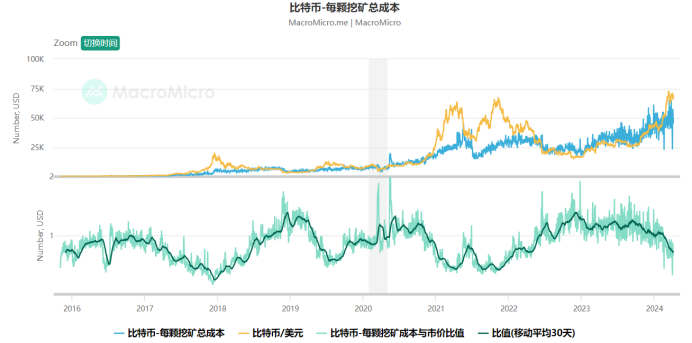
Definition: An estimate of the average cost of each bitcoin produced by all miners can be made based on global Bitcoin "power consumption" and "number of newly issued pieces per day". When the price of Bitcoin is greater than the cost of production, miners may benefit from expanding the mining equipment or adding more new miners, which increases the difficulty of mining and increases the cost of production. Conversely, when the price of Bitcoin is lower than the cost of production, miners scale down or withdraw, which will reduce the difficulty of mining and reduce the cost of production.
Explanation: It is necessary to pay attention to the ratio of Bitcoin mining costs to the market value, this indicator presents an average regression state, reflecting the volatility and regression of the relative value of the price, which is extremely important in the long term!!! The ratio is fluctuating around 1 and is currently below 1, indicating that the price has begun to be relatively overvalued, gradually approaching the historical low and can begin to withdraw.
6, proportion of long-term sleeping age
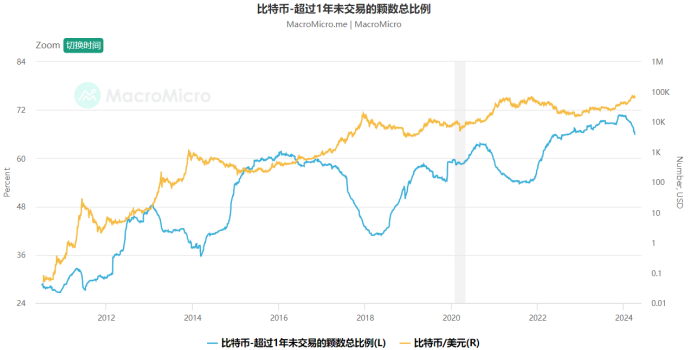
Definition: This indicator statistically represents the total percentage of the number of bitcoins most recently traded over a year. When the indicator value is larger, it indicates that the more shares of bitcoin are held on a long-term basis, which favors the cryptocurrency market; conversely, it represents the more shares of bitcoin are traded, which may reveal a profitable end of the market, unfavorable market performance. Based on the experience of the past few Bitcoin bull market cycles, the indicator shows a downtrend usually before the end of the Bitcoin bull market, and the indicator is located at a historical low, more likely than at the end of the Bitcoin bull market, so it can be used as a leading indicator to judge Bitcoin below.
Explanation: As the bull market progresses, more and more dormant Bitcoin starts to revive trading, it is necessary to pay attention to the stability of this downward trend, which shows the characteristics of the top.
7, long and short coin age ratio
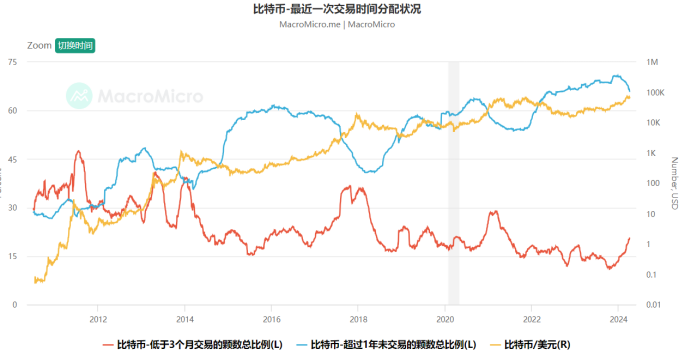
Definition: The percentage of all bitcoins traded in the last 3 months is calculated as the percentage of all bitcoins traded in the last 3 months as a whole. The formula is: the most recent transaction is the number of bitcoins/all bitcoins traded in the last 3 months, when the indicator trends up, representing the larger share of the bitcoins that have been traded, the frequency of switching is higher, revealing a heated market; conversely, the trend is down, meaning that the frequency of switching is decreasing.
Explanation: This indicator focuses on the upward trend of short-term values and the downward trend of long-term values, showing the peak characteristics.
Six, to conclude:
In summary, we are in the middle of the bull market, and many indicators are performing well, but we should gradually take into account the overheating situation, and we can start to develop an exit plan, gradually withdraw when one or more basic quantitative indicators do not support the bull market. Of course, these are just some of the representatives of basic quantitative analysis, I will integrate later to collect more basic quantitative research systems of the coinage circle.
We are Quant, we use data analysis, we no longer have to believe in all sorts of bull and snake gods, we construct and modify our expectations objectively!
- Digital currency pairing trading strategy source code and the latest API of FMZ platform
- Detailed Explanation of Digital Currency Pair Trading Strategy
- FMZ Quant & OKX: How Do Ordinary People Master Quantitative Trading? The Answers Are All Here!
- The digital currency pairing trading strategy is detailed
- Detailed Explanation of FMZ Quant API Upgrade: Improving the Strategy Design Experience
- Detailed Explanation of New Features of Strategy Interface Parameters and Interactive Controls
- FMZ Quantify & OKX: How can ordinary people play Quantify?
- Inventors quantify trading platform API upgrades: enhancing the strategic design experience
- Policy interface parameters and interactive controller additions
- Quantifying Fundamental Analysis in the Cryptocurrency Market: Let Data Speak for Itself!
- An Essential Tool in the Field of Quantitative Trading - FMZ Quant Data Exploration Module
- The inventor of the Quantitative Data Exploration Module, an essential tool in the field of quantitative trading.
- Mastering Everything - Introduction to FMZ New Version of Trading Terminal (with TRB Arbitrage Source Code)
- Get all the details about the new FMZ trading terminal (with the TRB suite source code)
- FMZ Quant: An Analysis of Common Requirements Design Examples in the Cryptocurrency Market (II)
- How to Exploit Brainless Selling Bots with a High-Frequency Strategy in 80 Lines of Code
- FMZ quantification: common demands on the cryptocurrency market design example analysis (II)
- How to exploit brainless robots for sale with high-frequency strategies of 80 lines of code
- FMZ Quant: An Analysis of Common Requirements Design Examples in the Cryptocurrency Market (I)
- FMZ quantification: common demands of the cryptocurrency market design instance analysis (1)
m0606Based on the statistical chain data, I feel that there is one area that is more difficult to deal with, which is centralized exchanges, where a large number of chips are distributed, and the process of sending them from the big house to the retail one takes place inside the exchange.
Inventors quantify - small dreamsYou're a teacher, you're productive.
Written by TradeManIt is possible to monitor the exchange's token balance, which increases the demand for spot transactions (more are sold) and increases the volatility effect on derivatives.