FMZ simulation level backtest mechanism explanation
Author: Goodness, Created: 2020-06-04 09:46:50, Updated: 2023-11-01 20:32:27
Backtest architecture
The FMZ platform backtest program is a complete control process, and the program is polling non-stop according to a certain frequency. The data returned by each market and trading API also simulates the actual running time according to the calling time. It belongs to the onTick level, not the onBar level of other backtest systems. Better support for backtest of strategies based on Ticker data (strategies with higher operating frequency).
The difference between simulation level backtest and real market level backtest
- Simulation level backtest
The simulation level backtest is based on the bottom K-line data of the backtest system, and according to a certain algorithm, the ticker data interpolation is simulated within the framework of the values of the highest, lowest, opening, and closing prices of the given bottom K-line Bar into this Bar time series.
- Real market level backtest
The real market level backtest is the real ticker level data in Bar’s time series. For strategies based on ticker-level data, using real market level backtest is closer to reality. Backtest at the real market level, ticker is real recorded data, not simulated.
Simulation level backtest mechanism-bottom K line
There is no bottom K-line option for real market backtest (because ticker data is real, no bottom K-line is needed to simulate the generation).
In the simulation level backtest, the generated ticker is simulated based on the K-line data. This K-line data is the bottom K-line. In the actual use of simulation level backtest, the period of the bottom K line must be less than the period of calling the API to obtain the K line when the strategy is running. Otherwise, due to the large cycle of the bottom K line and insufficient number of generated tickers, the data will be distorted when calling the API to obtain the K line of the specified period. When using the large-period K-line backtest, you can appropriately increase the bottom K-line cycle.
How to generate ticker data for the bottom K line
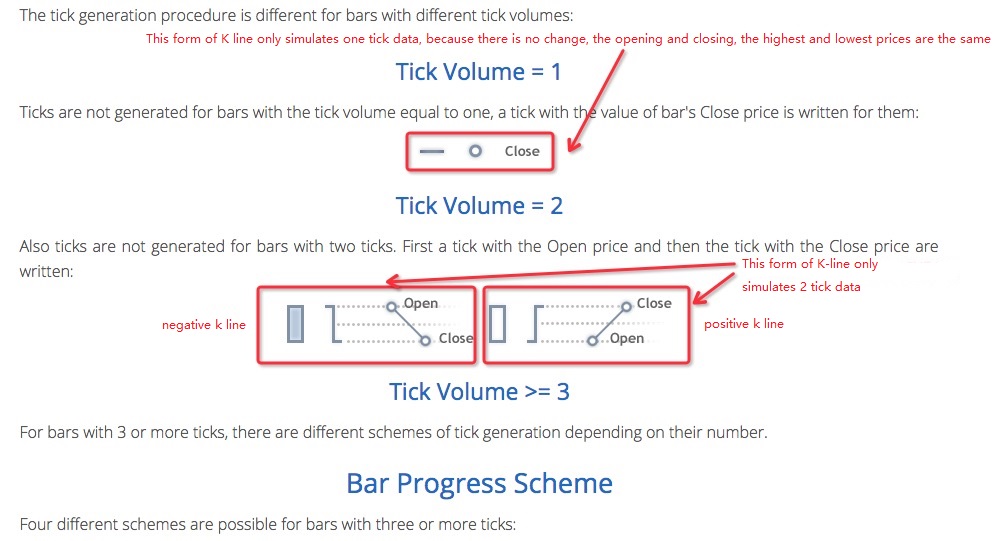
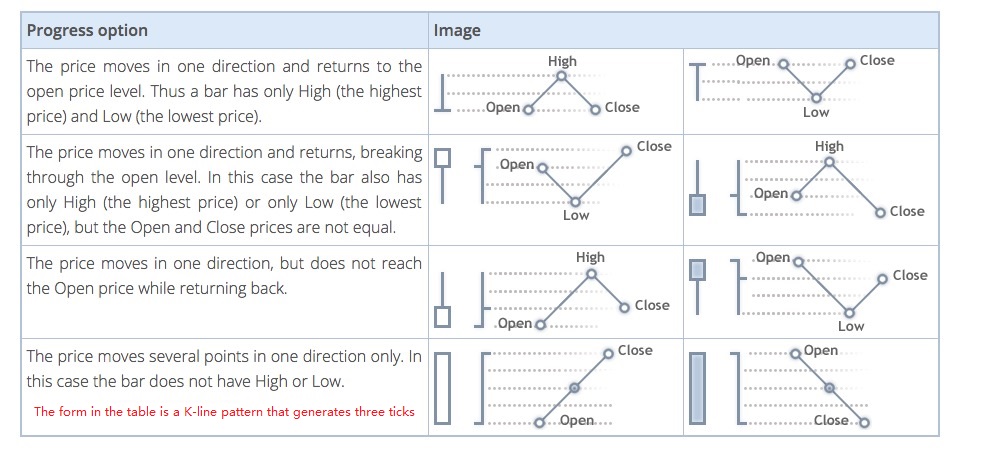
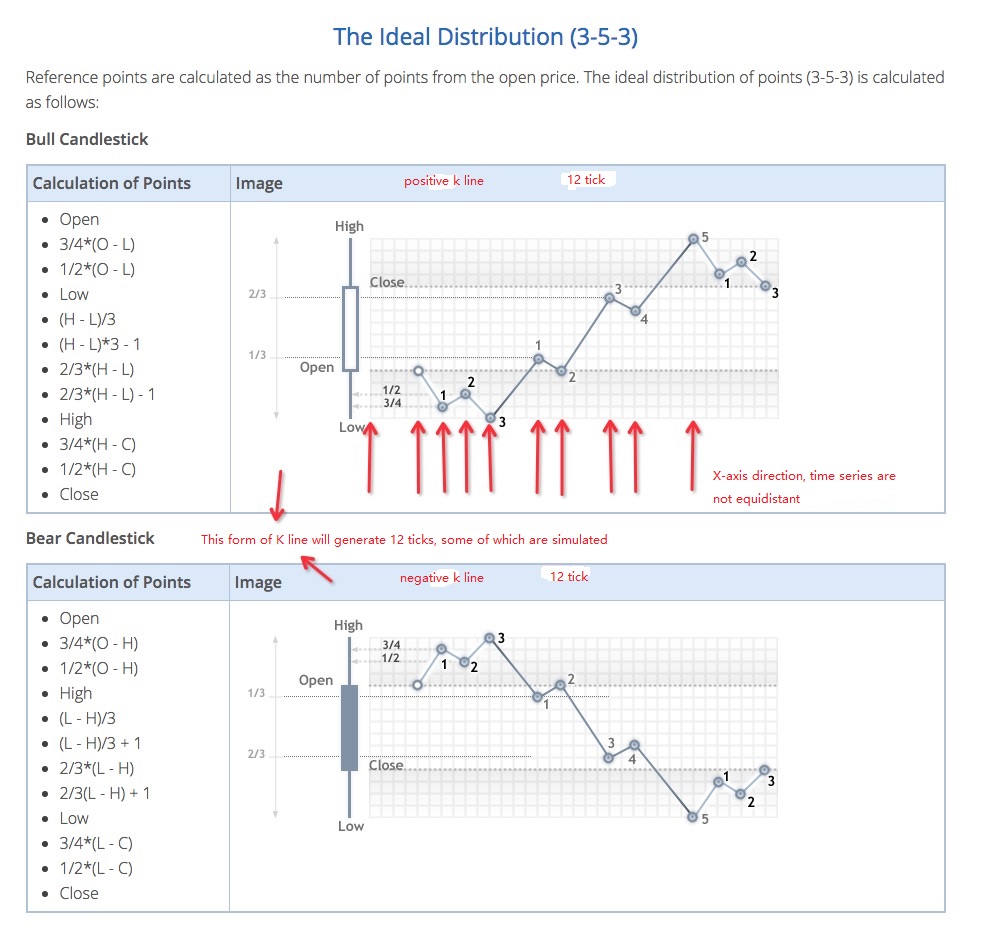
The mechanism for generating simulated tickers on the bottom K line is the same as the famous trading software MetaTrader 4


Algorithm code for generating ticker data
Specific algorithm for simulating tick data from the bottom K-line data:
function recordsToTicks(period, num_digits, records) {
    // http://www.metatrader5.com/en/terminal/help/tick_generation
    if (records.length == 0) {
        return []
    }
    var ticks = []
    var steps = [0, 2, 4, 6, 10, 12, 16, 18, 23, 25, 27, 29]
    var pown = Math.pow(10, num_digits)

    function pushTick(t, price, vol) {
        ticks.push([Math.floor(t), Math.floor(price * pown) / pown, vol])
    }

    for (var i = 0; i < records.length; i++) {
        var T = records[i][0]
        var O = records[i][1]
        var H = records[i][2]
        var L = records[i][3]
        var C = records[i][4]
        var V = records[i][5]
        if (V > 1) {
            V = V - 1
        }
        if ((O == H) && (L == C) && (H == L)) {
            pushTick(T, O, V)
        } else if (((O == H) && (L == C)) || ((O == L) && (H == C))) {
            pushTick(T, O, V)
        } else if ((O == C) && ((O == L) || (O == H))) {
            pushTick(T, O, V / 2)
            pushTick(T + (period / 2), (O == L ? H : L), V / 2)
        } else if ((C == H) || (C == L)) {
            pushTick(T, O, V / 2)
            pushTick(T + (period * 0.382), (C == L ? H : L), V / 2)
        } else if ((O == H) || (O == L)) {
            pushTick(T, O, V / 2)
            pushTick(T + (period * 0.618), (O == L ? H : L), V / 2)
        } else {
            var dots = []
            var amount = V / 11
            pushTick(T, O, amount)
            if (C > O) {
                dots = [
                    O - (O - L) * 0.75,
                    O - (O - L) * 0.5,
                    L,
                    L + (H - L) / 3.0,
                    L + (H - L) * (4 / 15.0),
                    H - (H - L) / 3.0,
                    H - (H - L) * (6 / 15.0),
                    H,
                    H - (H - C) * 0.75,
                    H - (H - C) * 0.5,
                ]
            } else {
                dots = [
                    O + (H - O) * 0.75,
                    O + (H - O) * 0.5,
                    H,
                    H - (H - L) / 3.0,
                    H - (H - L) * (4 / 15.0),
                    H - (H - L) * (2 / 3.0),
                    H - (H - L) * (9 / 15.0),
                    L,
                    L + (C - L) * 0.75,
                    L + (C - L) * 0.5,
                ]
            }
            for (var j = 0; j < dots.length; j++) {
                pushTick(T + period * (steps[j + 1] / 30.0), dots[j], amount)
            }
        }
        pushTick(T + (period * 0.98), C, 1)
    }
    return ticks
}
Therefore, when using the simulation level backtest, there will be price jumps in the time series.
- Quantitative Practice of DEX Exchanges (2) -- Hyperliquid User Guide
- DEX exchange quantitative practices ((2) -- Hyperliquid user guide
- Quantitative Practice of DEX Exchanges (1) -- dYdX v4 User Guide
- Introduction to Lead-Lag Arbitrage in Cryptocurrency (3)
- DEX exchange quantitative practice ((1) -- dYdX v4 user guide
- Introduction to the Lead-Lag suite in digital currency (3)
- Introduction to Lead-Lag Arbitrage in Cryptocurrency (2)
- Introduction to the Lead-Lag suite in the digital currency (2)
- Discussion on External Signal Reception of FMZ Platform: A Complete Solution for Receiving Signals with Built-in Http Service in Strategy
- Discussing FMZ platform external signal reception: a complete set of strategies for the reception of signals from built-in HTTP services
- Introduction to Lead-Lag Arbitrage in Cryptocurrency (1)
- Python version of Commodity Futures Intertemporal Bollinger Hedge Strategy (Study purpose only)
- Interfacing with FMZ robot using "Tradingview" indicator
- FMZ Quantified My Language - Parameters of the My Language Exchange Library
- Commodity "futures and spots" Arbitrage Chart Based on FMZ Fundamental Data
- High-frequency backtest system based on each transaction and the defects of K-line backtest
- Python version of commodity futures intertemporal hedging strategy
- Some Thoughts on the Logic of Crypto Currency Futures Trading
- Enhanced analysis tool based on Alpha101 grammar development
- Teach you to upgrade the market collector backtest the custom data source
- Defects in high-frequency echo systems based on pen-to-pen transaction and K-line echoes
- The best way to install and upgrade FMZ docker on Linux VPS
- Commodity Futures R-Breaker Strategy
- A bit of thinking about the logic of digital currency futures trading
- Teach you to implement a market quotes collector
- Python Version Commodity Futures Moving Average Strategy
- Market quotes collector upgrade again
- Upgraded case collector - support for CSV file import to provide custom data sources
- Commodity Futures High Frequency Trading Strategy written by C++
- Larry Connors RSI2 Mean Reversion Strategy
- OK hands-on teaches you how to use JS to pair FMZ extension APIs