Larry Connors RSI2 Mean Reversion Strategy
 0
2011
0
2011
From
Many friends asked me to write a grid and market maker strategy,But I generally decline directly. Regarding these strategies, first of all, you must have a strong mathematical knowledge, at least a doctor of mathematics.
In addition, high-frequency quantitative trading is more about financial resources, such as the amount of funds and broadband network speed. The most important thing is that these violate my understanding of the trading.
Is there any other way to do high-frequency trading? Today we will introduce this RSI mean regression strategy based on Larry Connors.
Introduction
The RSI2 strategy is a fairly simple mean regression trading strategy developed by Larry Connors, mainly operate during the price correction period.
When RSI2 falls below 10, it is considered over-selling and traders should look for buying opportunities.
When RSI2 rises above 90, it is considered over-buying and traders should look for selling opportunities.
This is a fairly aggressive short-term strategy aimed at participating in continuing trends. It is not intended to identify the main top or bottom of the price.
Strategy
There are four steps to this strategy.
Use the long-term moving average to determine the main trends
Connors recommends the 200-day moving average. The long-term trend rises above the 200-day moving average, and declines below it.
Traders should look for buying opportunities above the 200-day moving average and short selling opportunities below it.
Select the RSI range to determine buying or selling opportunities
Connors tested RSI levels between 0 and 10 to buy and 90 to 100 to sell. (Based on closing price)
He found that when the RSI fell below 5, the return on buying was higher than the return below 10. The lower the RSI, the higher the return on subsequent long positions.
Correspondingly, when the RSI is higher than 95, the return on short selling is higher than the return on above 90.
Regrading of the actual buying or short selling orders and their placing order time
Connors advocates the “close” method. Waiting for the closing price to open positions gives the trader more flexibility and can increase the winning rate.
Set the appearance position
Where should stop-loss be?
Connors does not advocate the use of stop loss. In a quantitative test of hundreds of thousands of transactions, Connors found that the use of stop-loss actually “damaged” performance.
But in the example, Connors recommends to stop-loss long positions above the 5-day moving average and short positions below the 5-day moving average.
Obviously, this is a short-term trading strategy that can exit quickly, or consider setting up trailing stop loss or adopting SAR synthetic stop loss strategy.
Sometimes the market does indeed price drift upwards. Failure to use stop loss may result in excess losses and large losses.
This requires traders to consider and decide.
Verification
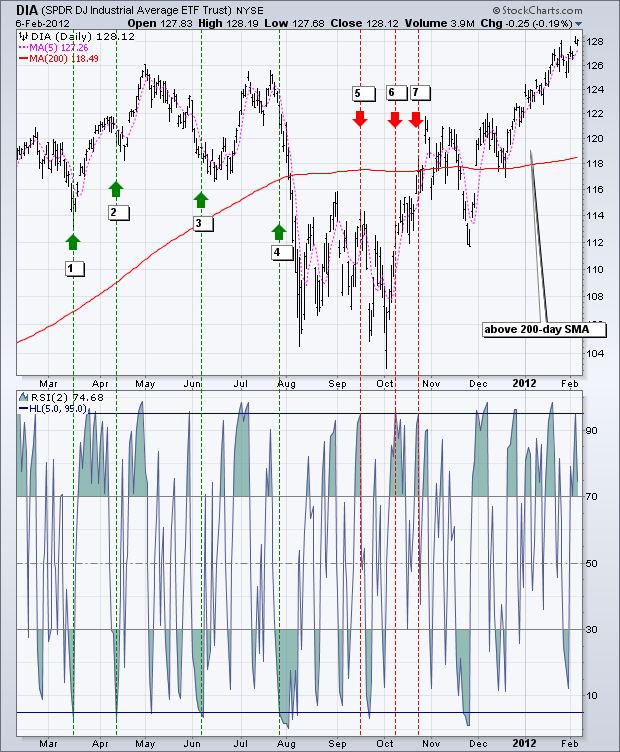
The chart below shows the Dow Jones Industrial Average SPDR (DIA) and 200-day SMA (red), 5-period SMA (pink) and 2-period RSI.
When the DIA is higher than the 200-day SMA and the RSI (2) falls to 5 or lower, a bullish signal appears.
When the DIA is below the 200-day SMA and the RSI (2) rises to 95 or higher, a bearish signal will appear.
In these 12 months, there are 7 signals, 4 bullish and 3 bearish.
Among the 4 bullish signals, DIA rose by 3 of 4 times, which means that these signals may be profitable.
Among the four bearish signals, DIA fell only once.
After a bearish signal in October, DIA broke the 200-day moving average.
Once the 200-day moving average is exceeded, RSI2 will not fall to 5 or lower to generate another buying signal.
As for profit and loss, it will depend on the level of stop-loss and take- profit.
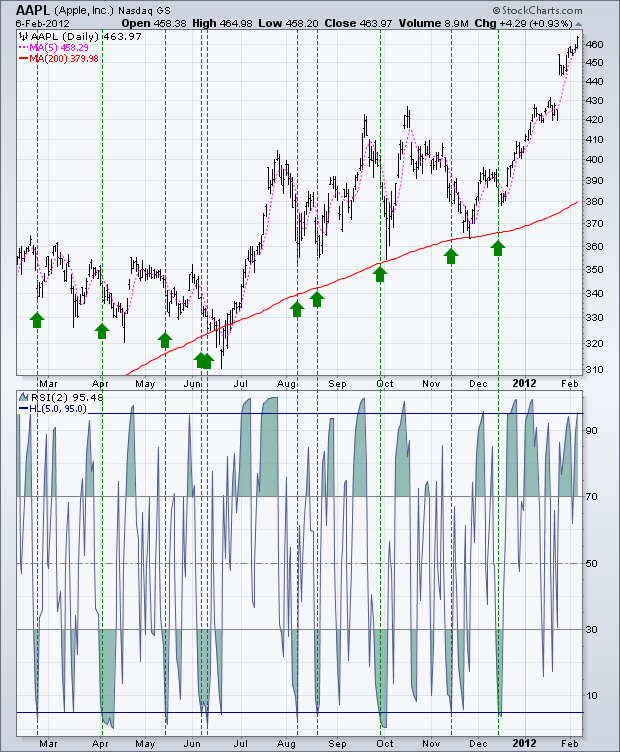
The second example shows Apple (APL), which is above the 200-day moving average for most of the time period.
During this period, there are at least ten buying signals.
Since APL saw a sawtooth decline from late February to mid-June 2011, it is difficult to avoid the loss of the first five indicators.
As the APL rose in a jagged pattern from August to January, the last five signals performed much better.
As can be seen from the chart, many signals are very early.
In other words, Apple fell to a new low after the initial buy signal and then rebounded.
Conclusion
The RSI2 strategy provides traders with the opportunity to participate in continuing trends.
Connors pointed out that traders should buying at price retracement point, not breakouts point.
also, traders should sell at oversold rebounds, not price support breakouts point.
This strategy is in line with his philosophy.
Even though Connors’ tests indicate that stop loss affects performance, it is prudent for traders to develop exit and stop loss strategies for any trading system.
When the situation becomes over-buying or a stop loss is set, the trader can exit the long position.
Similarly, when conditions are oversold, traders can withdraw from short positions.
Use these ideas to enhance your trading style, risk-reward preferences and personal judgment.
FMZ source code display
Connors’ strategy is relatively simple, it is simply written in M language. (Everyone can understand)
Because the original strategy design target was US stocks, the 200-day moving average was used as a reference.
In the violently volatile digital currency market, it is just suitable for short-term value return.
So we adjusted the time range to 15 minutes, and the MA period was 70, and use 1 times the leverage for backtest.
(*backtest
start: 2019-01-01 00:00:00
end: 2020-05-12 00:00:00
period: 15m
basePeriod: 5m
exchanges: [{"eid":"Futures_OKCoin","currency":"BTC_USD"}]
args: [["TradeAmount",5000,126961],["MaxAmountOnce",5000,126961],["ContractType","quarter",126961]]
*)

liang:=INTPART(1*MONEYTOT*REF(C,1)/100);
//1 times the leverage
LC := REF(CLOSE,1);
RSI2: SMA(MAX(CLOSE-LC,0),2,1)/SMA(ABS(CLOSE-LC),2,1)*100;
//RSI2 value
ma1:=MA(CLOSE,70);
//MA value

CLOSE>ma1 AND RSI2>90,SK(liang);
CLOSE>ma1 AND RSI2<10,BP(SKVOL);
//When it is greater than the moving average,rsi>90 open short position,rsi<10 close short position


CLOSE<ma1 AND RSI2<10,BK(liang);
CLOSE<ma1 AND RSI2>90,SP(BKVOL);
//When it is less than the moving average,rsi<10 open long position,rsi>90 close long position

AUTOFILTER;
Strategy Copy https://www.fmz.com/strategy/207157
Backtest effect
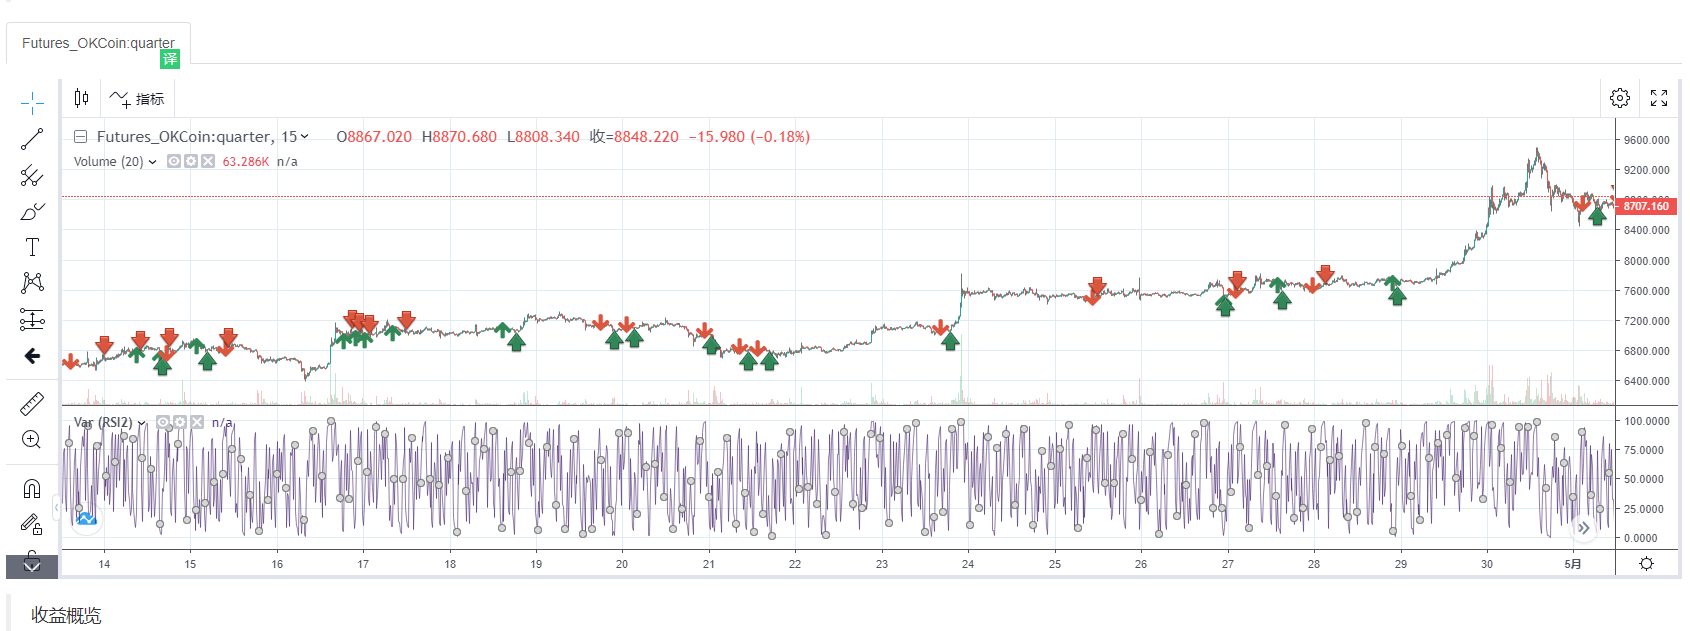
After a systematic backtest, we see that the overall winning rate of the RSI strategy is high. Its performance satisfied us.
The maximum retracement occurs at 312, and extreme market conditions will do more harm to the strategy of shock return.
Tweaking
After RSI2 rise above 95, the market can continue to rise; After RSI2 drops below 5, the market can continue to fall. To correct this situation, we may need to involve OHLCV analysis, intraday chart patterns, other momentum indicators, etc.
After RSI2 rise above 95, the market can continue to rise and it is dangerous to establish a short position.
Traders may consider filtering this signal by waiting for RSI2 to return below its centerline 50.
References
https://school.stockcharts.com https://www.tradingview.com/ideas/connorsrsi/ https://www.mql5.com/zh/code/22421
- 基于逐笔成交的高频回测系统兼论K线回测的缺陷
- FMZ simulation level backtest mechanism explanation
- The best way to install and upgrade FMZ docker on Linux VPS
- Commodity Futures R-Breaker Strategy
- 数字货币期货交易逻辑的一点思考
- Teach you to implement a market quotes collector
- Python Version Commodity Futures Moving Average Strategy
- Market quotes collector upgrade again
- 行情收集器再升级--支持CSV格式文件导入提供自定义数据源
- Commodity Futures High Frequency Trading Strategy written by C++
- 奥克手把手教你用JS对接FMZ扩展API
- Based on the use of a new relative strength index in intraday strategies
- Research on Binance Futures Multi-currency Hedging Strategy Part 4
- Larry Connors拉里·康纳斯 RSI2均值回归策略
- Research on Binance Futures Multi-currency Hedging Strategy Part 3
- Research on Binance Futures Multi-currency Hedging Strategy Part 2
- Research on Binance Futures Multi-currency Hedging Strategy Part 1
- 手把手教你给行情收集器升级回测自定义数据源功能
- Crocodile line trading system Python version
- 使用发明者量化交易平台扩展API实现TradingView报警信号交易(推荐)