Overview
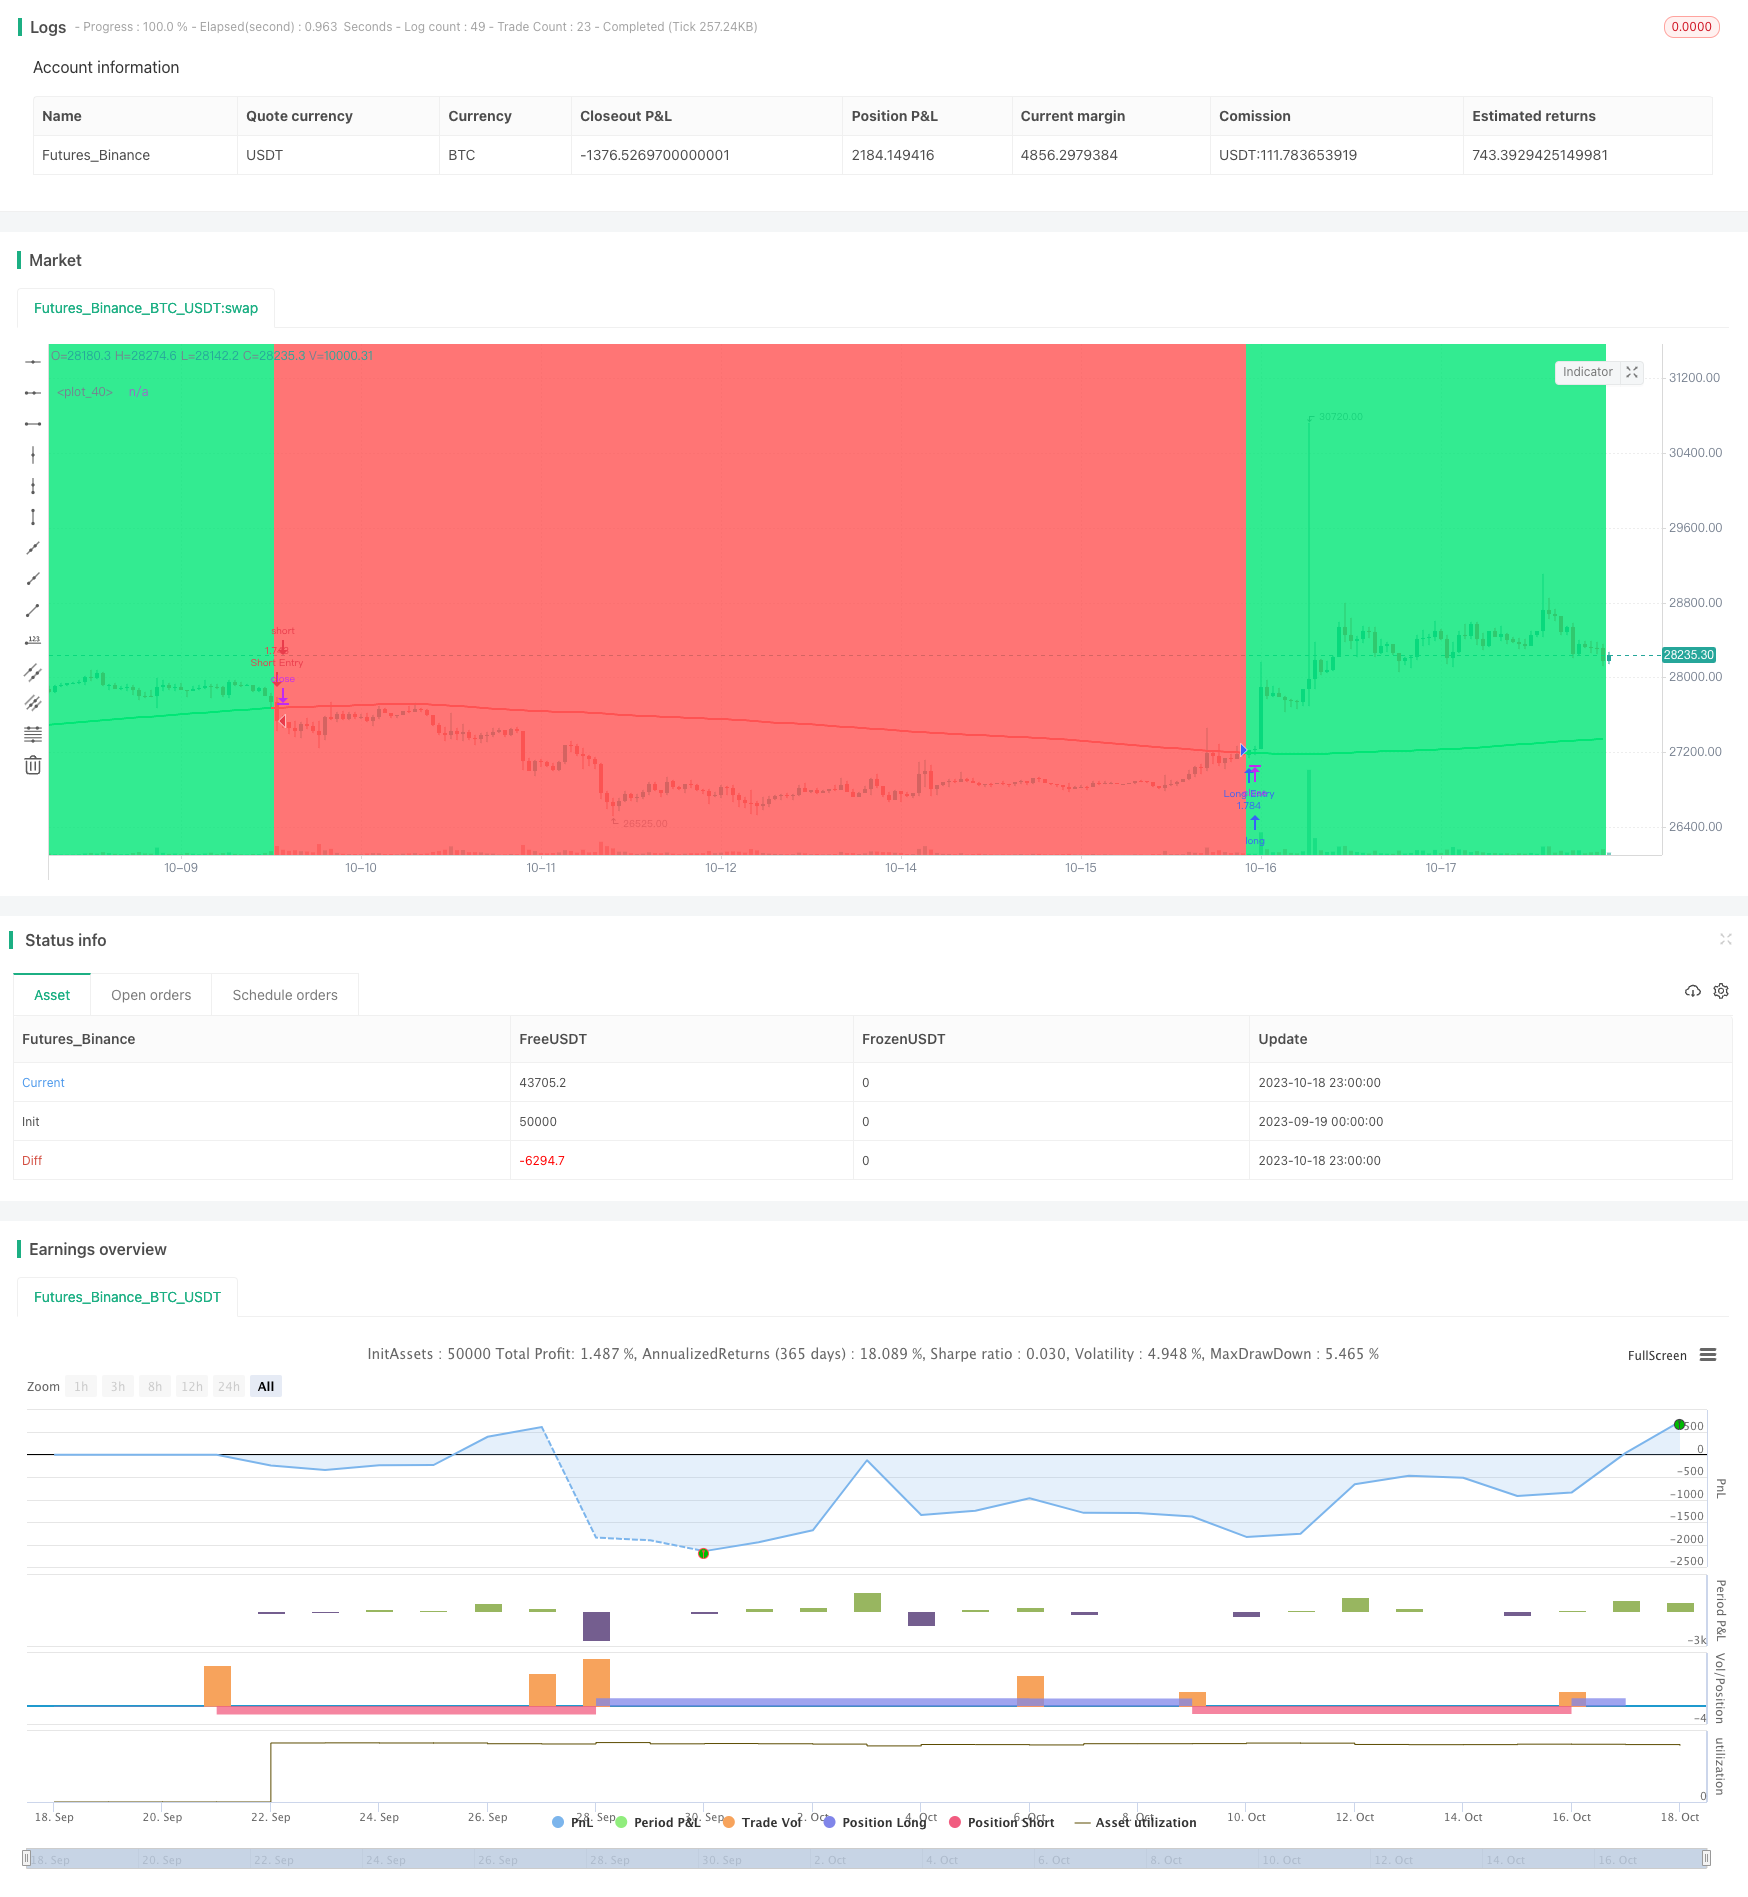
The moving average tracking strategy is a trend-following strategy based on simple moving average. It uses a 200-day simple moving average to determine the price trend direction. When the price crosses above the moving average, it goes long. When the price crosses below the moving average, it goes short. This strategy tracks the trend to profit.
Strategy Logic
The strategy is based on the following principles:
- Use a 200-day simple moving average (slowMA) to determine the price trend.
- When the closing price (close) crosses above slowMA, it signals an upward trend, so go long.
- When the closing price (close) crosses below slowMA, it signals a downward trend, so go short.
- Use last_long and last_short variables to record the last long and short entry time.
- Use crossover function to detect the crossover between last_long and last_short to generate trade signals.
- In the backtest period, go long when receiving the long signal (long_signal), and go short when receiving the short signal (short_signal).
The strategy tracks the trend by moving average direction and makes reverse trades when the MA crossover happens, to profit from the trend.
Advantage Analysis
The strategy has the following advantages:
- The strategy logic is simple and easy to understand and implement.
- The long-period moving average filters out noise and locks in the major trend.
- Timely reverse trades can capture significant price swings around trend reversals.
- It only uses one indicator, avoiding the complexity of multiple indicators.
- Clear entry and exit rules without much human intervention.
Risk Analysis
There are also some risks:
- Long-period MA is not sensitive to short-term corrections, missing short-term opportunities.
- Weak ability in identifying major trend reversal, with reversal losses.
- No stop loss mechanism, leading to large drawdowns.
- Fixed parameters have weak adaptability across different products and market environments.
- Backtest overfitting risk as the strategy is only tested on historical data.
The risks can be addressed through the following optimizations:
- Add short-period MA to also capture short-term trends.
- Add volume filters to avoid false breakout signals.
- Add trend-following indicators to improve trend reversal identification.
- Add dynamic stop loss to control single trade loss.
- Use parameter optimization methods to improve adaptability.
- Robustness test across different market environments.
Optimization Directions
The strategy can be further optimized in the following aspects:
Optimize the MA period parameter using methods like Walk Forward Analysis to find the optimal parameters.
Add a short-period MA to track both long and short-term trends.
Incorporate trend indicators like MACD to improve trend reversal identification.
Add stop loss mechanisms like trailing stop loss to control single trade loss.
Robustness test on different products and time periods.
Use machine learning for parameter adaptive optimization.
Conclusion
The moving average tracking strategy is a simple and practical trend-following strategy. It has a clear logic and is easy to implement for capturing trends. But it also has some weaknesses like being insensitive to short-term corrections and weak risk control. We can optimize the strategy from multiple aspects to make it more robust, better parameterized and with stronger risk management. Overall, the moving average tracking strategy has good application value and is an important trend trading concept in quantitative trading.
/*backtest
start: 2023-09-19 00:00:00
end: 2023-10-19 00:00:00
period: 1h
basePeriod: 15m
exchanges: [{"eid":"Futures_Binance","currency":"BTC_USDT"}]
*/

//@version=4
strategy("MA X 200 BF", overlay=true, initial_capital=10000, default_qty_type=strategy.percent_of_equity, default_qty_value=100, commission_type=strategy.commission.percent, commission_value=0.0)

/////////////// Time Frame ///////////////
testStartYear = input(2012, "Backtest Start Year")
testStartMonth = input(1, "Backtest Start Month")
testStartDay = input(1, "Backtest Start Day")
testPeriodStart = timestamp(testStartYear,testStartMonth,testStartDay, 0, 0)

testStopYear = input(2019, "Backtest Stop Year")
testStopMonth = input(12, "Backtest Stop Month")
testStopDay = input(31, "Backtest Stop Day")
testPeriodStop = timestamp(testStopYear,testStopMonth,testStopDay, 0, 0)

testPeriod() => true

///////////// MA 200 /////////////
slowMA = sma(close, input(200))

/////////////// Strategy ///////////////
long = close > slowMA
short = close < slowMA

last_long = 0.0
last_short = 0.0
last_long := long ? time : nz(last_long[1])
last_short := short ? time : nz(last_short[1])

long_signal = crossover(last_long, last_short)
short_signal = crossover(last_short, last_long)

/////////////// Execution ///////////////
if testPeriod()
    strategy.entry("Long Entry",  strategy.long, when=long_signal)
    strategy.entry("Short Entry", strategy.short, when=short_signal)
    strategy.exit("Long Ex", "Long Entry")
    strategy.exit("Short Ex", "Short Entry")

/////////////// Plotting ///////////////
plot(slowMA, color = long ? color.lime : color.red, linewidth=2)
bgcolor(strategy.position_size > 0 ? color.lime : strategy.position_size < 0 ? color.red : color.white, transp=80)
bgcolor(long_signal ? color.lime : short_signal ? color.red : na, transp=30)