概述
本策略通过组合使用动量指标CMO和反转指标Stochastic,实现多因子模型,以发掘不同市场环境下的交易机会。
原理分析
该策略由两个子策略组成:
123反转策略
- 使用9日Stochastic指标判断超买超卖
- 如果收盘价连续2日上涨,且Stochastic低于50,做多
- 如果收盘价连续2日下跌,且Stochastic高于50,做空
CMO绝对值策略
- 计算CMO的绝对值
- CMO绝对值高于70时,认为处于超买状态,做空
- CMO绝对值低于20时,认为处于超卖状态,做多
最后,如果两个子策略信号一致,则发出交易信号。
该策略充分利用了动量指标CMO和反转指标Stochastic的优势。CMO能较好地识别趋势,Stochastic则可发现短期反转机会。两者结合使用,能在不同阶段发掘交易机会。
优势分析
本策略具有以下优势:
多因子模型,结合动量和反转,能适应不同市场环境
CMO识别趋势能力强,Stochastic判断反转点准确
只在两个信号一致时交易,避免错信号,提高获利概率
参数优化空间大,可以针对不同品种和周期进行调整
采用长短周期指标结合,能发现更多交易机会
规则简单清晰,容易理解实现,适合算法交易
风险分析
本策略也存在以下风险:
子策略发出错误信号的概率存在,需要优化参数
突发事件导致趋势反转,会产生较大亏损
交易频率可能过高,交易成本是需要考虑的因素
子策略均为延迟指标,存在时间滞后问题
需针对不同品种调整参数,对参数优化要求较高
对策:
优化子策略参数,降低错误信号概率
设置止损,控制单笔亏损
调整开仓条件,降低交易频率
使用实时tick数据,减少滞后问题
利用机器学习方法自动优化参数
优化方向
本策略可以从以下方面进行优化:
引入更多因子,如波动率、量价等,形成系统性的多因子模型
构建动态参数优化机制,根据市场情况调整参数
优化开仓逻辑,引入概率和指数平滑等方法
在短期内对冲长期仓位,实现双重目标
利用深度学习提取更多特征,建立非线性交易规则
探索无参数模型,避免人工选择参数带来的偏差
结合高频数据、新闻事件,减少信号滞后问题
总结
本策略通过运用动量指标CMO和反转指标Stochastic,实现多因子模型,在穿越式市场中发掘更多交易机会。相比单一指标,多因子组合能够适应更加复杂的市场环境。同时,本策略参数优化空间大、规则简单,适合算法交易开发。但是也需要注意风险控制,对参数选择和模型优化要求较高。总体来说,多因子动量反转策略是一个可供参考和拓展的系统化交易思路。
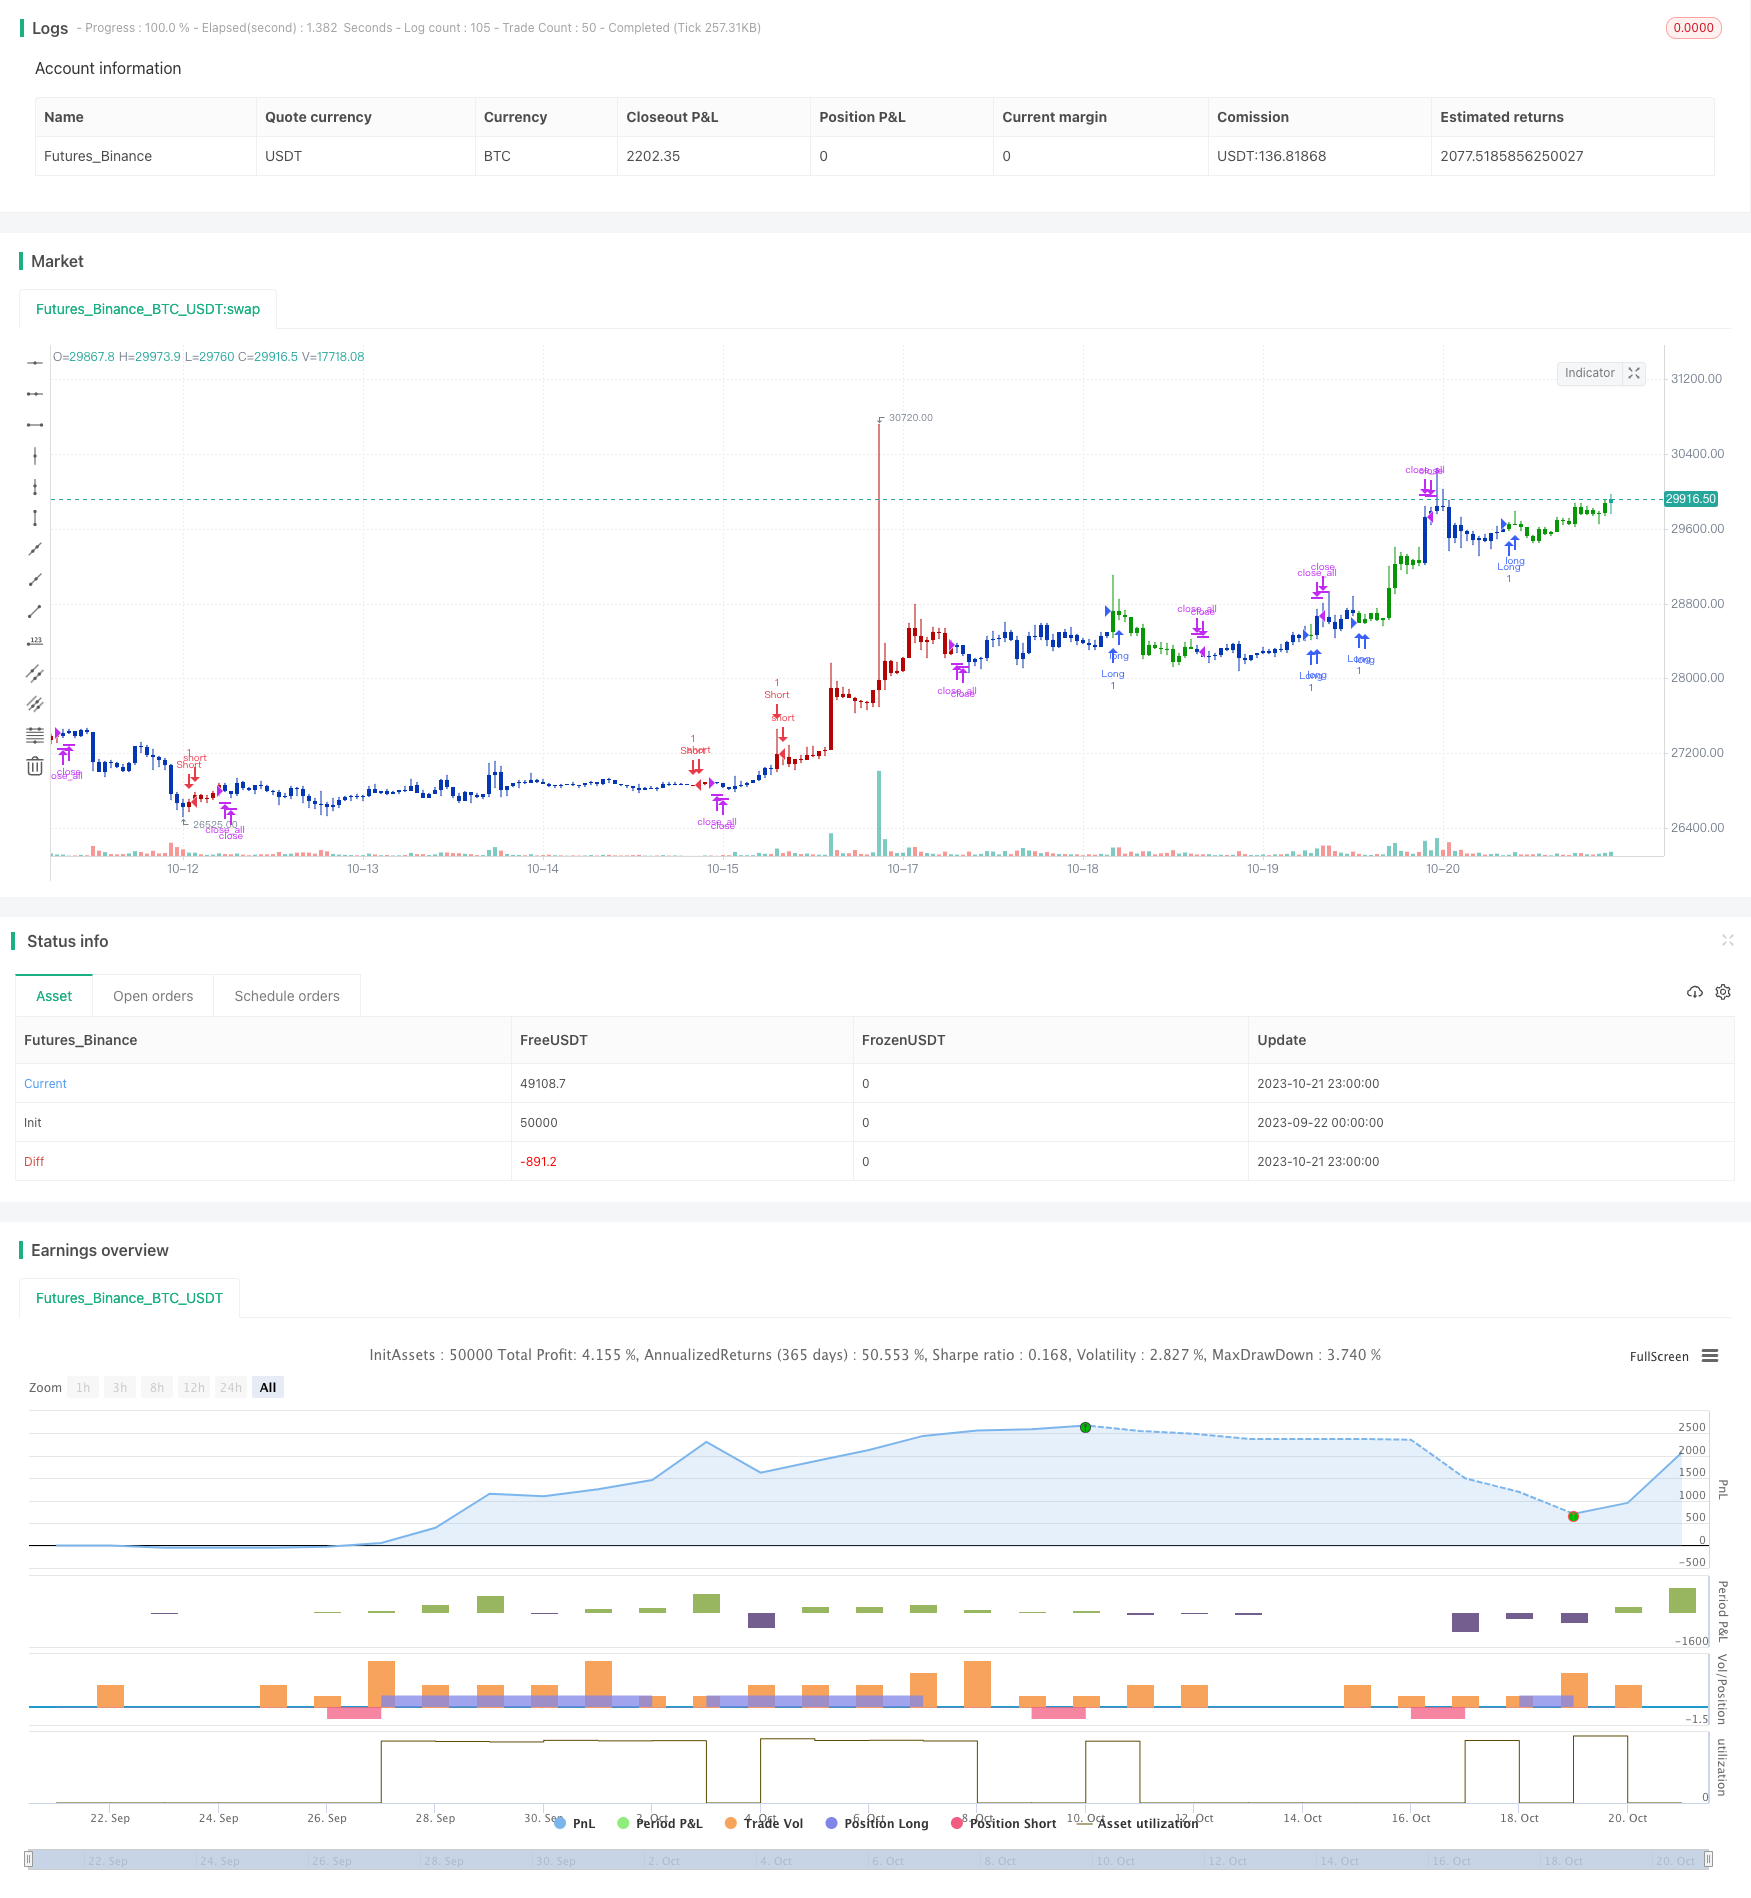
/*backtest
start: 2023-09-22 00:00:00
end: 2023-10-22 00:00:00
period: 1h
basePeriod: 15m
exchanges: [{"eid":"Futures_Binance","currency":"BTC_USDT"}]
*/

//@version=4
////////////////////////////////////////////////////////////
//  Copyright by HPotter v1.0 17/09/2019
// This is combo strategies for get a cumulative signal.
//
// First strategy
// This System was created from the Book "How I Tripled My Money In The
// Futures Market" by Ulf Jensen, Page 183. This is reverse type of strategies.
// The strategy buys at market, if close price is higher than the previous close
// during 2 days and the meaning of 9-days Stochastic Slow Oscillator is lower than 50.
// The strategy sells at market, if close price is lower than the previous close price
// during 2 days and the meaning of 9-days Stochastic Fast Oscillator is higher than 50.
//
// Second strategy
//    This indicator plots the absolute value of CMO. CMO was developed by Tushar
//    Chande. A scientist, an inventor, and a respected trading system developer,
//    Mr. Chande developed the CMO to capture what he calls "pure momentum". For
//    more definitive information on the CMO and other indicators we recommend the
//    book The New Technical Trader by Tushar Chande and Stanley Kroll.
//    The CMO is closely related to, yet unique from, other momentum oriented indicators
//    such as Relative Strength Index, Stochastic, Rate-of-Change, etc. It is most closely
//    related to Welles Wilder`s RSI, yet it differs in several ways:
//        - It uses data for both up days and down days in the numerator, thereby directly
//          measuring momentum;
//        - The calculations are applied on unsmoothed data. Therefore, short-term extreme
//          movements in price are not hidden. Once calculated, smoothing can be applied to
//          the CMO, if desired;
//        - The scale is bounded between +100 and -100, thereby allowing you to clearly see
//          changes in net momentum using the 0 level. The bounded scale also allows you to
//          conveniently compare values across different securities.
//
// WARNING:
// - For purpose educate only
// - This script to change bars colors.
////////////////////////////////////////////////////////////
Reversal123(Length, KSmoothing, DLength, Level) =>
    vFast = sma(stoch(close, high, low, Length), KSmoothing)
    vSlow = sma(vFast, DLength)
    pos = 0.0
    pos := iff(close[2] < close[1] and close > close[1] and vFast < vSlow and vFast > Level, 1,
	         iff(close[2] > close[1] and close < close[1] and vFast > vSlow and vFast < Level, -1, nz(pos[1], 0)))
	pos

CMOabs(Length, TopBand, LowBand) =>
    pos = 0
    xMom = abs(close - close[1])
    xSMA_mom = sma(xMom, Length)
    xMomLength = close - close[Length]
    nRes = abs(100 * (xMomLength / (xSMA_mom * Length)))
    pos := iff(nRes > TopBand, -1,
    	     iff(nRes < LowBand, 1, nz(pos[1], 0)))
    pos

strategy(title="Combo Backtest 123 Reversal & CMOabs", shorttitle="Combo", overlay = true)
Length = input(14, minval=1)
KSmoothing = input(1, minval=1)
DLength = input(3, minval=1)
Level = input(50, minval=1)
//-------------------------
LengthCMO = input(9, minval=1)
TopBand = input(70, minval=1)
LowBand = input(20, maxval=0)
reverse = input(false, title="Trade reverse")
posReversal123 = Reversal123(Length, KSmoothing, DLength, Level)
posCMOabs = CMOabs(LengthCMO, TopBand, LowBand)
pos = iff(posReversal123 == 1 and posCMOabs == 1 , 1,
	   iff(posReversal123 == -1 and posCMOabs == -1, -1, 0))
possig = iff(reverse and pos == 1, -1,
          iff(reverse and pos == -1 , 1, pos))
if (possig == 1)
    strategy.entry("Long", strategy.long)
if (possig == -1)
    strategy.entry("Short", strategy.short)
if (possig == 0)
    strategy.close_all()
barcolor(possig == -1 ? #b50404: possig == 1 ? #079605 : #0536b3 )