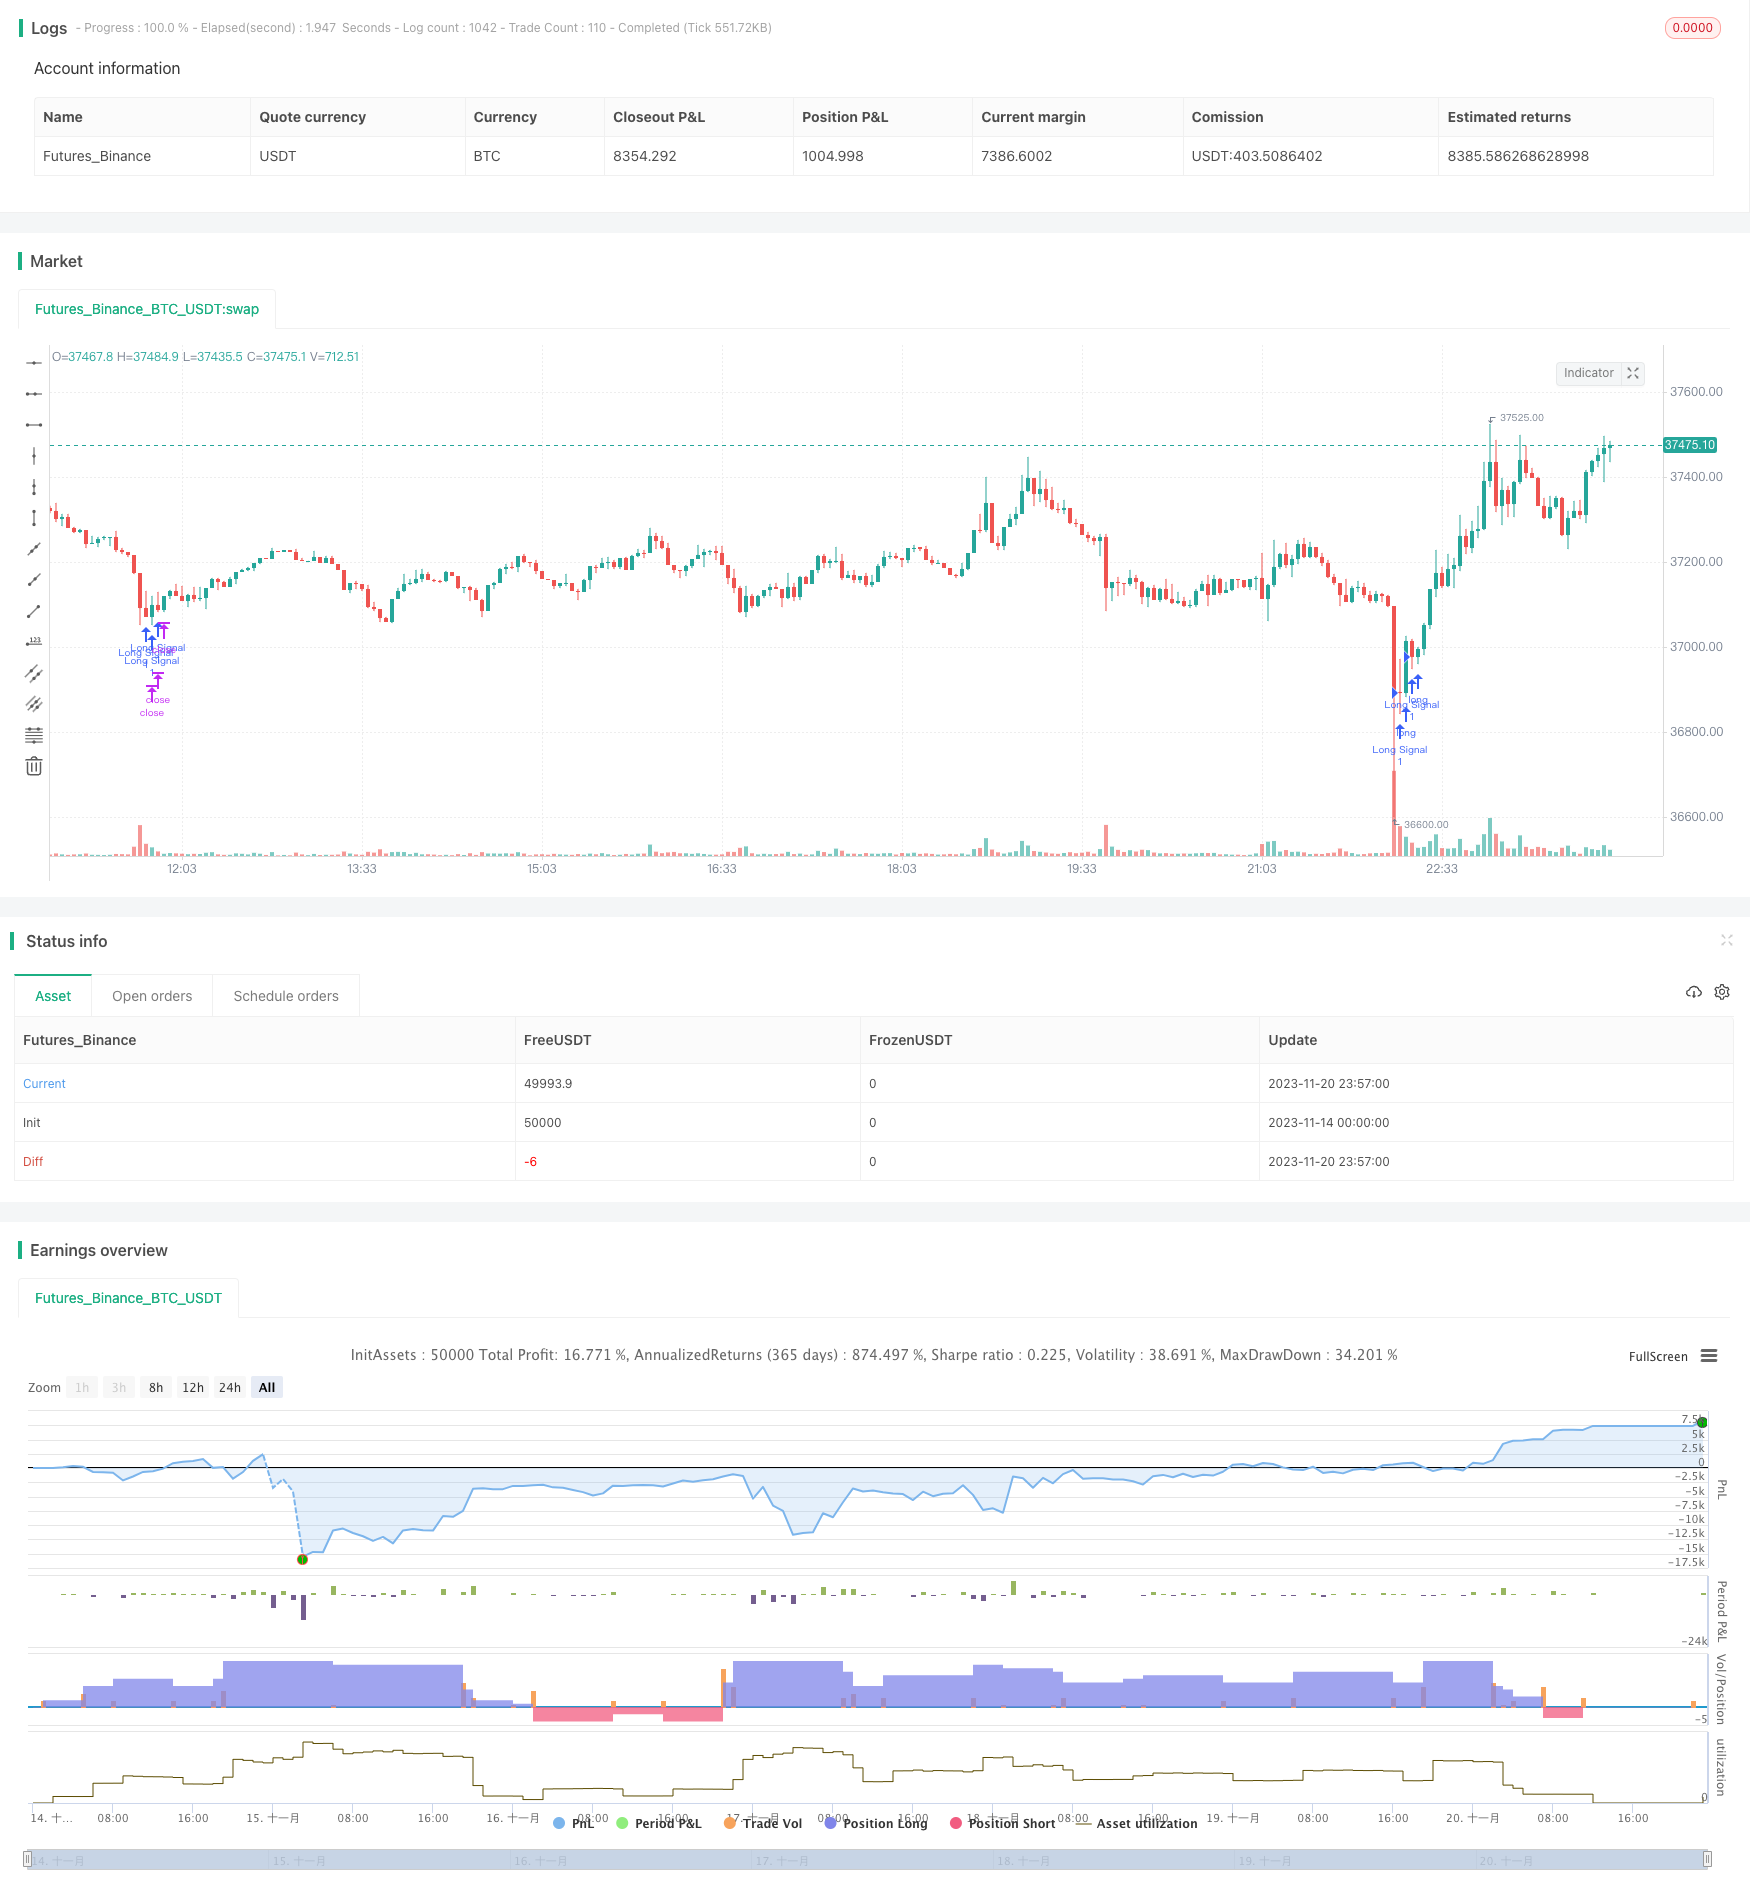
Overview
This strategy combines moving average, CCI indicator, PSAR indicator and ADX trend index to implement a typical breakthrough strategy. It goes long when there is a clear bullish signal and goes short when there is a clear bearish signal, which is very suitable for medium and short-term operations.
Principles
The entry conditions of the strategy include the following aspects:
Moving average: requiring 5-day line breaking through 10-day line, 10-day line breaking through 20-day line and 20-day line breaking through 40-day line, which can effectively filter out most false breakthroughs.
CCI indicator: requiring CCI indicator less than -100 as the long signal, and greater than 100 as the short signal.
PSAR indicator: requiring the direction of PSAR indicator to be consistent with the trend direction determined by the price.
ADX indicator: requiring ADX greater than 20, indicating the market is now in a trend, which is suitable for using breakthrough systems.
At the same time, the exit conditions also take multiple indicators into consideration:
Moving average: the opposite of entry conditions. For example, 5-day line breaking down 10-day line is the signal of closing positions.
CCI and PSAR indicators have opposite meanings to entry conditions. For example, CCI greater than 100 is the signal for closing long positions.
So the entry is strict while the exit is loose for this strategy, which can obtain a relatively high rate of return.
Advantages
This typical multi-indicator combined breakthrough strategy has the following advantages:
The strict entry conditions adopt multiple indicators for filtering, which can reduce the risk of false breakthroughs.
The indicator parameters are optimized for good adaptability to the market.
The trend judgment indicator is adopted to avoid being trapped in the shock market.
Moving averages are used to determine medium and short term trends stably.
CCI indicator can capture short-term overbought and oversold phenomena.
PSAR indicator has strong ability to determine the direction of market trends.
Risks
The strategy also has the following risks:
In extreme markets, the effects of multiple indicator combinations may be compromised and cannot fully filter out risks.
When the trend is huge, using medium and short-term indicators to determine the timing may fail and cannot fully capture the trend.
Improper parameter settings of local indicators like CCI may lead to missing opportunities.
The effect of PSAR indicator is poor at trend turning points.
Counter measures:
Appropriately relax entry conditions and pay more cost for lower risk.
Increase judgment of longer-term indicators, such as 60-day or even longer moving averages.
Dynamically optimize parameters like CCI.
Combine more indicators to judge trends, such as Bollinger Bands.
Optimization Directions
The strategy also has the following optimization directions:
Increase machine learning algorithms to realize real-time parameter optimization and improve adaptability.
Increase model combination techniques, combine more non-correlated strategies to improve stability.
Introduce risk control mechanisms, such as stop loss strategies, to effectively control single stop loss.
Increase trend judgment module to avoid getting into shock markets.
Optimize indicator weights so that the optimal indicators play a leading role under different market environments.
Conclusion
In general, this strategy is a typical and classic multi-indicator breakthrough strategy. Its advantages are rigorous entry conditions, loose exit conditions, and it also contains a trend judgment module. But it also has some risks. It needs continuous optimization to adapt to more complex market environments. Model combination and parameter optimization are its development directions.
/*backtest
start: 2023-11-14 00:00:00
end: 2023-11-21 00:00:00
period: 3m
basePeriod: 1m
exchanges: [{"eid":"Futures_Binance","currency":"BTC_USDT"}]
*/

//@version=4
strategy(title="Bukan Kaleng Kaleng Li", shorttitle="BKKL", overlay=true)

psarDot = sar(0.01, 0.01, 0.2)
up = change(high)
down = -change(low)
plusDM = na(up) ? na : (up > down and up > 0 ? up : 0)
minusDM = na(down) ? na : (down > up and down > 0 ? down : 0)
trur = rma(tr, 14)
plus = fixnan(100 * rma(plusDM, 14) / trur)
minus = fixnan(100 * rma(minusDM, 14) / trur)
sum = plus + minus
adx = 100 * rma(abs(plus - minus) / (sum == 0 ? 1 : sum), 14)

longConditionSMA4020 = sma(close, 40) > sma(close, 20)
longConditionSMA2010 = sma(close, 20) > sma(close, 10)
longConditionSMA105 = sma(close, 10) > sma(close, 5)
longConditionSMA = longConditionSMA4020 and longConditionSMA2010 and longConditionSMA105
longConditionCCI = cci(close, 20) < -100
longConditionPSAR = psarDot > close
longConditionDMI = plus < 10
adxCondition = adx > 20

longCondition = longConditionSMA and longConditionCCI and longConditionPSAR and longConditionDMI
if (longCondition and adxCondition)
    strategy.order("Long Signal", true)

shortConditionSMA4020 = sma(close, 40) < sma(close, 20)
shortConditionSMA2010 = sma(close, 20) < sma(close, 10)
shortConditionSMA105 = sma(close, 10) < sma(close, 5)
shortConditionSMA = shortConditionSMA4020 and shortConditionSMA2010 and shortConditionSMA105
shortConditionCCI = cci(close, 20) > 100
shortConditionPSAR = psarDot < close
shortConditionDMI = minus < 10

shortCondition = shortConditionSMA and shortConditionCCI and shortConditionPSAR and shortConditionDMI
if (shortCondition and adxCondition)
    strategy.order("Short Signal", false)