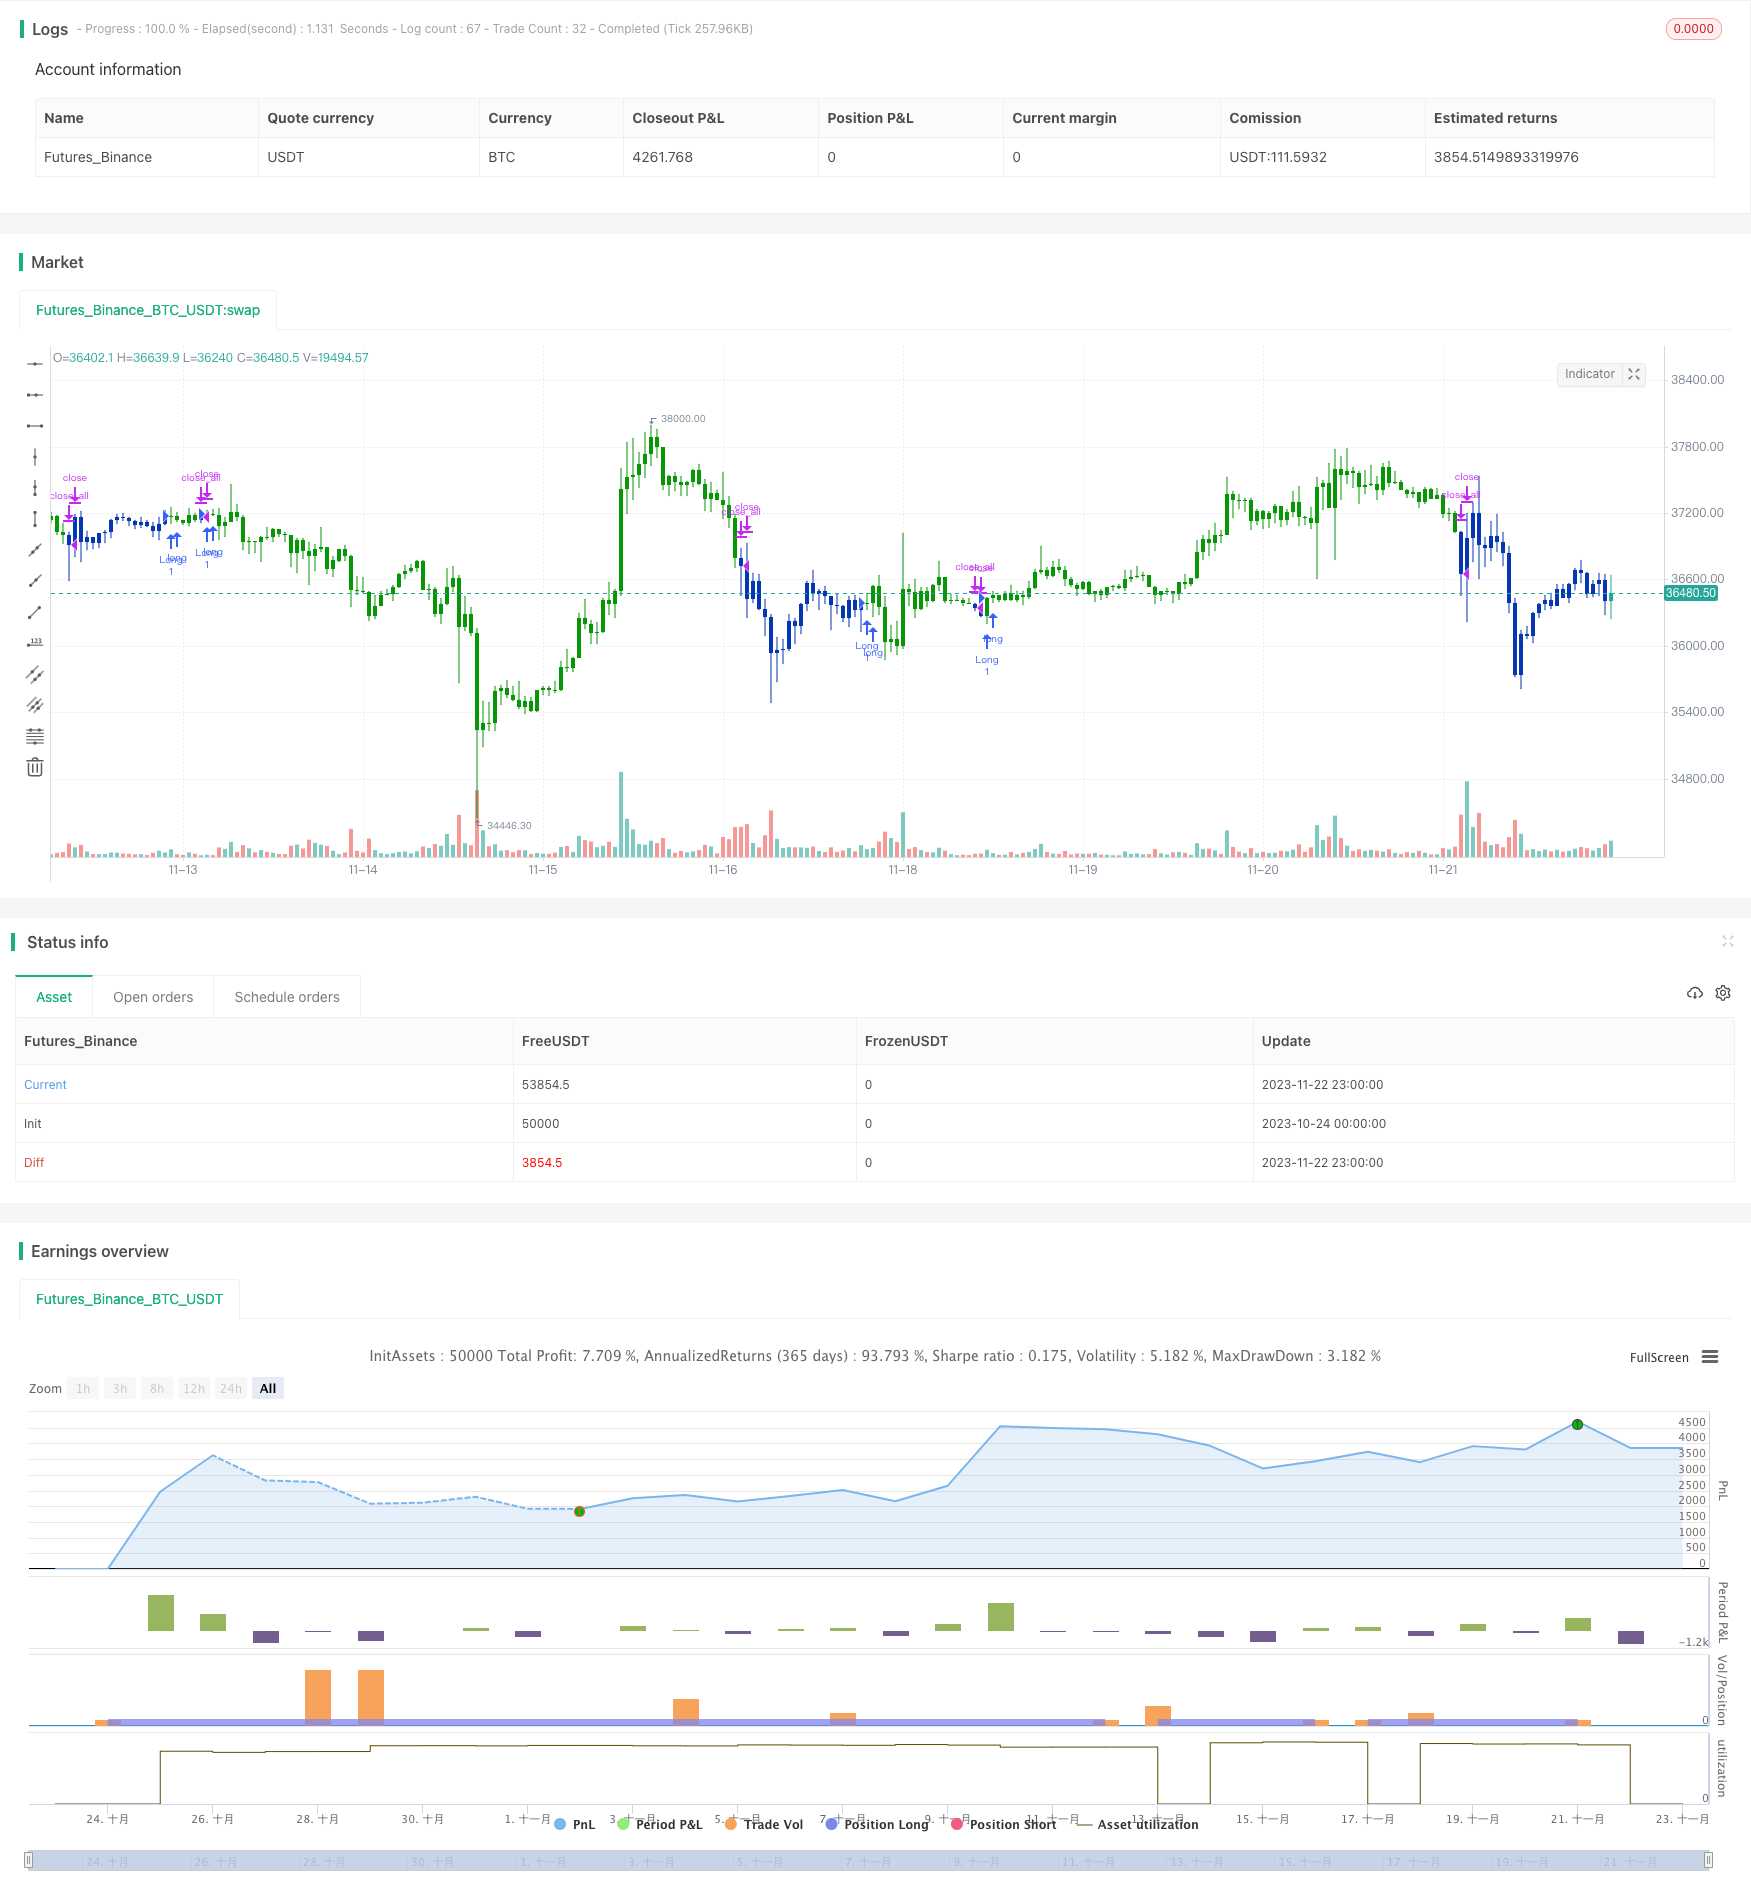
Overview
This strategy combines multiple technical indicators to implement momentum reversal and dual-rail matching to generate trading signals. The strategy uses 123 pattern to determine reversal points and matches signals with the ergodic CSI indicator to track trends. It aims to capture medium-short term trends and achieve high profits.
Principles
The strategy contains two parts:
- 123 pattern to determine reversal points
- Ergodic CSI indicator to generate matching signals
The 123 pattern judges price reversal based on the close prices of the recent 3 bars. Specifically: If the close price of the 3rd bar rises compared to the previous 2 bars, and both fast and slow stoch are below 50, it is a buy signal. If the close price of the 3rd bar falls compared to the previous 2 bars, and both fast and slow stoch are above 50, it is a sell signal.
The ergodic CSI indicator considers multiple factors like price, true range, trend indicators to comprehensively determine market conditions and generate buy/sell zones. When indicator rises above buy zone, it generates a buy signal. When indicator falls below sell zone, it generates a sell signal.
Finally, the reversal signals from 123 pattern and zone signals from ergodic CSI are “ANDed” to produce the final strategy signal.
Advantages
- Captures medium-short term trends, high profit potential
- Reversal pattern determination effectively catches turning points
- Dual-rail matching reduces false signals
Risks
- Individual stocks may diverge, leading to stop loss
- Reversal patterns susceptible to impact from range-bound markets
- Limited parameter optimization space, performance fluctuation high
Optimization Directions
- Optimize parameters to improve strategy profitability
- Add stop loss logic to reduce single trade loss
- Incorporate multi-factor models to improve stock selection
Conclusion
This strategy effectively tracks medium-short term trends by combining reversal patterns and dual-rail matching. Compared to single technical indicators, it has higher stability and profit levels. Next steps are to further optimize parameters, add stop loss and stock selection modules to reduce drawdowns and improve overall performance.
/*backtest
start: 2023-10-24 00:00:00
end: 2023-11-23 00:00:00
period: 1h
basePeriod: 15m
exchanges: [{"eid":"Futures_Binance","currency":"BTC_USDT"}]
*/

//@version=4
////////////////////////////////////////////////////////////
//  Copyright by HPotter v1.0 22/07/2020
// This is combo strategies for get a cumulative signal.
//
// First strategy
// This System was created from the Book "How I Tripled My Money In The
// Futures Market" by Ulf Jensen, Page 183. This is reverse type of strategies.
// The strategy buys at market, if close price is higher than the previous close
// during 2 days and the meaning of 9-days Stochastic Slow Oscillator is lower than 50.
// The strategy sells at market, if close price is lower than the previous close price
// during 2 days and the meaning of 9-days Stochastic Fast Oscillator is higher than 50.
//
// Second strategy
// This is one of the techniques described by William Blau in his book
// "Momentum, Direction and Divergence" (1995). If you like to learn more,
// we advise you to read this book. His book focuses on three key aspects
// of trading: momentum, direction and divergence. Blau, who was an electrical
// engineer before becoming a trader, thoroughly examines the relationship between
// price and momentum in step-by-step examples. From this grounding, he then looks
// at the deficiencies in other oscillators and introduces some innovative techniques,
// including a fresh twist on Stochastics. On directional issues, he analyzes the
// intricacies of ADX and offers a unique approach to help define trending and
// non-trending periods.
// This indicator plots Ergotic CSI and smoothed Ergotic CSI to filter out noise.
//
// WARNING:
// - For purpose educate only
// - This script to change bars colors.
////////////////////////////////////////////////////////////
Reversal123(Length, KSmoothing, DLength, Level) =>
    vFast = sma(stoch(close, high, low, Length), KSmoothing)
    vSlow = sma(vFast, DLength)
    pos = 0.0
    pos := iff(close[2] < close[1] and close > close[1] and vFast < vSlow and vFast > Level, 1,
	         iff(close[2] > close[1] and close < close[1] and vFast > vSlow and vFast < Level, -1, nz(pos[1], 0)))
	pos

fADX(Len) =>
    up = change(high)
    down = -change(low)
    trur = rma(tr, Len)
    plus = fixnan(100 * rma(up > down and up > 0 ? up : 0, Len) / trur)
    minus = fixnan(100 * rma(down > up and down > 0 ? down : 0, Len) / trur)
    sum = plus + minus
    100 * rma(abs(plus - minus) / (sum == 0 ? 1 : sum), Len)

ECSI(r,Length,BigPointValue,SmthLen,SellZone,BuyZone) =>
    pos = 0
    source = close
    K = 100 * (BigPointValue / sqrt(r) / (150 + 5))
    xTrueRange = atr(1)
    xADX = fADX(Length)
    xADXR = (xADX + xADX[1]) * 0.5
    nRes = iff(Length + xTrueRange > 0, K * xADXR * xTrueRange / Length,0)
    xCSI = iff(close > 0,  nRes / close, 0)
    xSMA_CSI = sma(xCSI, SmthLen)
    pos := iff(xSMA_CSI > BuyZone, 1,
             iff(xSMA_CSI <= SellZone, -1, nz(pos[1], 0)))
    pos

strategy(title="Combo Backtest 123 Reversal & Ergodic CSI", shorttitle="Combo", overlay = true)
Length = input(14, minval=1)
KSmoothing = input(1, minval=1)
DLength = input(3, minval=1)
Level = input(50, minval=1)
//-------------------------
r = input(32, minval=1)
LengthECSI = input(1, minval=1)
BigPointValue = input(1.0, minval=0.00001)
SmthLen = input(5, minval=1)
SellZone = input(0.06, minval=0.00001)
BuyZone = input(0.02, minval=0.001)
reverse = input(false, title="Trade reverse")
posReversal123 = Reversal123(Length, KSmoothing, DLength, Level)
posECSI = ECSI(r,LengthECSI,BigPointValue,SmthLen,SellZone,BuyZone)
pos = iff(posReversal123 == 1 and posECSI == 1 , 1,
	   iff(posReversal123 == -1 and posECSI == -1, -1, 0))
possig = iff(reverse and pos == 1, -1,
          iff(reverse and pos == -1 , 1, pos))
if (possig == 1)
    strategy.entry("Long", strategy.long)
if (possig == -1)
    strategy.entry("Short", strategy.short)
if (possig == 0)
    strategy.close_all()
barcolor(possig == -1 ? #b50404: possig == 1 ? #079605 : #0536b3 )