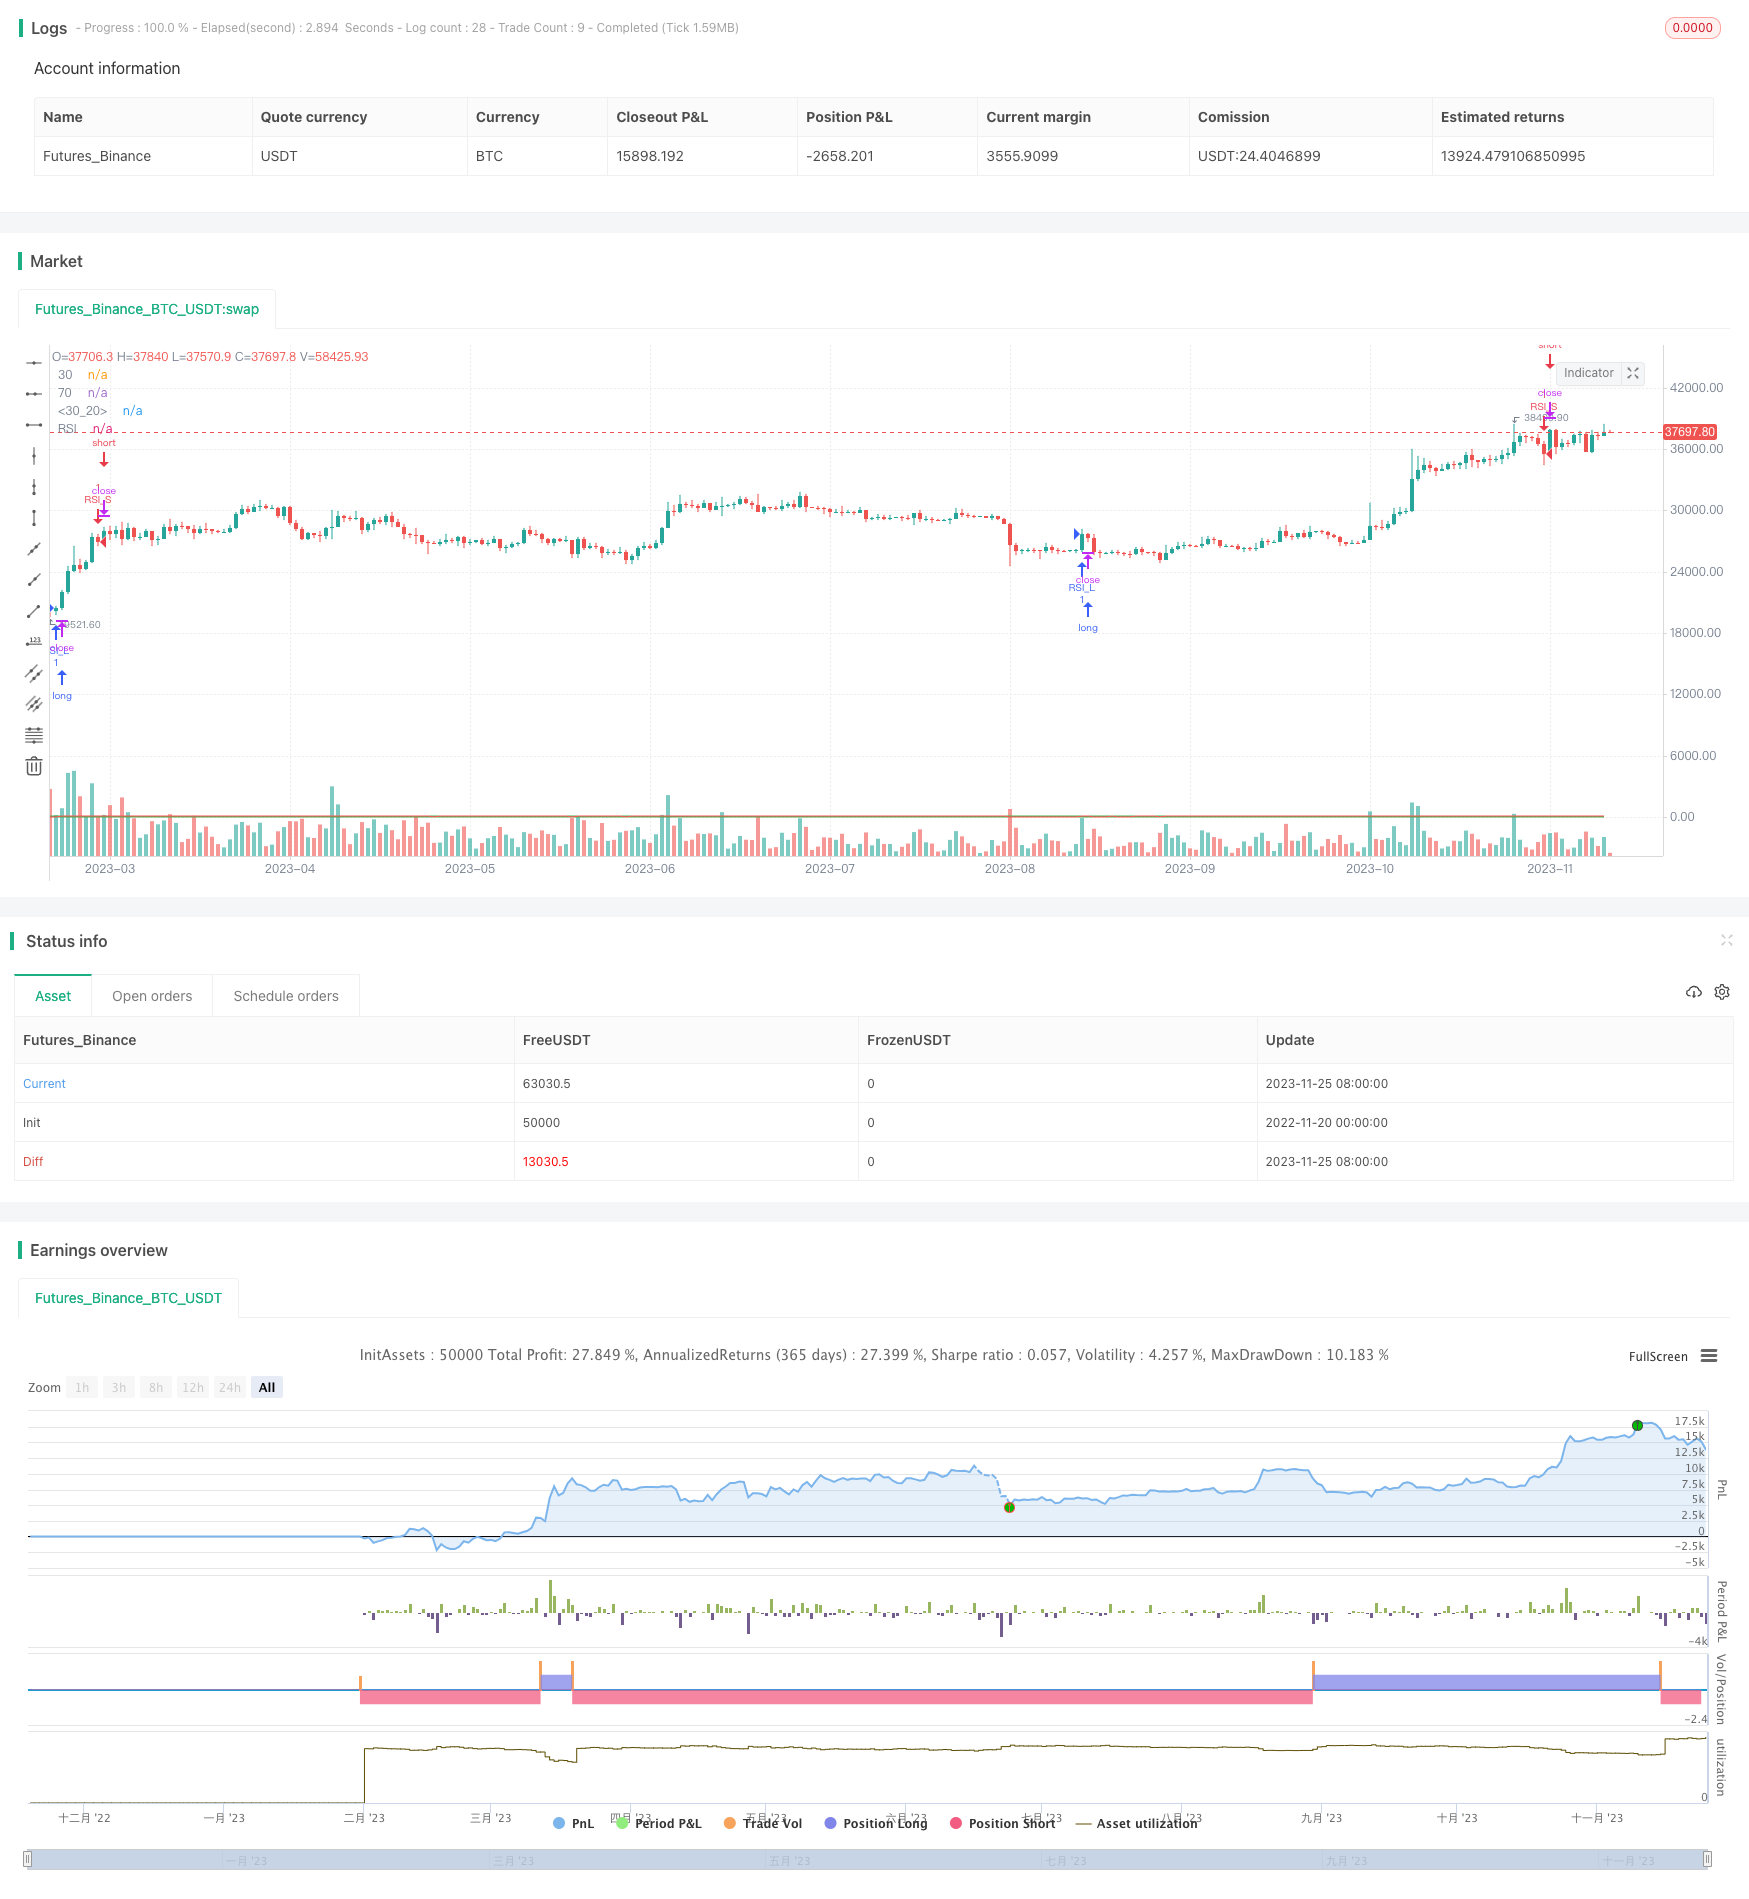
Relative Strength Index Flat Reversal Strategy
Author: ChaoZhang, Date: 2023-11-27 11:25:17Tags:

Overview
The Relative Strength Index Flat Reversal Strategy is a quantitative investment strategy that uses the RSI indicator to identify overbought and oversold signals. This strategy makes long and short reversals based on the oversold and overbought zones of the RSI indicator by opening positions when the RSI enters the extreme zone and closing positions when the RSI exits the extreme zone.
Strategy Principle
This strategy uses a 14-period RSI indicator. The overbought zone is defined as above 70 and the oversold zone is defined as below 30. It goes long when the RSI crosses above 30 from below and goes short when the RSI crosses below 70 from above. After opening the position, it keeps holding until the RSI exits the extreme zone.
Specifically, the strategy logic is as follows:
- Define RSI indicator length as 14 periods
- Define RSI oversold line at 30, overbought line at 70
- When RSI crosses above 30, go long
- When RSI crosses below 70, go short
- When RSI exits 30-70 range, close position
In this way, it captures reversal opportunities from RSI extreme zones using the reversal characteristics of RSI indicator.
Strategy Advantage Analysis
The Relative Strength Index Flat Reversal Strategy has the following advantages:
- The operation logic is simple and clear, easy to understand and implement
- High efficiency, no prediction needed, just follow indicator signals to operate
- Avoid chasing highs and killing lows, effectively control downside risk
- Relatively small drawdowns, meets risk tolerance level of most people
Strategy Risk Analysis
The Relative Strength Index Flat Reversal Strategy also has the following risks:
- Although there is a stop loss mechanism, it cannot avoid huge losses in a strong one-way trend
- There is a chance of RSI failure, cannot effectively reflect overbought and oversold conditions
- Cannot effectively filter out choppy sideways trends, hard to profit
- High trading frequency for ultra short-term operations, so trading costs are high
To hedge these risks, the strategy can be optimized by setting adaptive RSI to dynamically optimize RSI parameters, or adding trend filter etc.
Strategy Optimization
The Relative Strength Index Flat Reversal Strategy can be optimized in the following aspects:
- Add adaptive RSI feature to dynamically adjust RSI parameters, reducing failure risk
- Add trend indicator to avoid failed reversal risk
- Combine with volatility indicator to determine reasonable stop loss level
- Optimize entry conditions to avoid ineffective signals
Conclusion
In general, the Relative Strength Index Flat Reversal Strategy is a simple and practical short-term strategy. It utilizes the reversal trading characteristics of RSI indicator by taking opposite positions when RSI enters extreme zones. This strategy has the advantages of clear operation logic and controllable risk, making it very suitable for beginners to learn. But it also has some profit limitation and RSI failure risks. By introducing mechanisms like adaptive optimization, trend filter etc, the strategy can be further enhanced on its advantages and risk hedging capability, thereby leading to more reliable and stable investment returns.
/*backtest
start: 2022-11-20 00:00:00
end: 2023-11-26 00:00:00
period: 1d
basePeriod: 1h
exchanges: [{"eid":"Futures_Binance","currency":"BTC_USDT"}]
*/

//@version=2
strategy("RSI OverTrend Strategy (by Marcoweb) v1.0", shorttitle="RSI_L_30_Strat_v1.0", overlay=true)

///////////// RSI
RSIlength = input(14, minval=1, title="RSI Period Length")
RSIoverSold = 30
RSIoverBought = 70
RSITriggerLine = 30

RSI = rsi(close, RSIlength)
price = close
vrsi = rsi(price, RSIlength)

source = close
buyEntry = crossover(source, RSITriggerLine)
sellEntry = crossunder(source, RSITriggerLine)
plot(RSI, color=red,title="RSI")
p1 = plot(RSIoverSold, color=green,title="30")
p2 = plot(RSIoverBought, color=green,title="70")
p3 = plot(RSITriggerLine, color=green,title="30")


///////////// RSI Level 30 v1.0 Strategy
if (not na(vrsi))

    if (crossover(RSI, RSITriggerLine))
        strategy.entry("RSI_L", strategy.long,  comment="RSI_L")
    else
        strategy.cancel(id="RSI_L")

    if (crossunder(RSI, RSIoverBought))
        strategy.entry("RSI_S", strategy.short,  comment="RSI_S")
    else
        strategy.cancel(id="RSI_S")

//plot(strategy.equity, title="equity", color=red, linewidth=2, style=areabr)
- London MACD RSI Bitcoin Trading Strategy
- High Low Breaker Backtest Strategy
- A Double Moving Average Crossover Trading Strategy
- Trend Tracking Flag Pattern Strategy Based on EMA Indicators
- Alpha Trend Strategy with Trailing Stop Loss
- Ichimoku Mixed Equilibrium Table Macd and Tsi Combined Strategy
- Price Momentum Tracking Stop Loss Strategy
- Price Reversal Strategy Guided by Price Channel
- KST Indicator Profit Strategy
- Dynamic Two-way Add Position Strategy
- Fast RSI Gap Trading Strategy for Cryptocurrencies
- KDJ RSI Crossover Buy Sell Signals Strategy
- Ichimoku Backtester with TP, SL, and Cloud Confirmation
- Gyroscopic Bands Strategy Based on Multi Time Frame and Average Amplitude
- Dual Moving Average Crossover Reversal Strategy
- Dynamic Moving Average Tracking Strategy
- Reversal-Catcher Strategy
- RSI Gap Reversal Strategy
- 3-Min Short Only Expert Advisor Strategy
- Action Zone ATR Reverse Order Quant Strategy