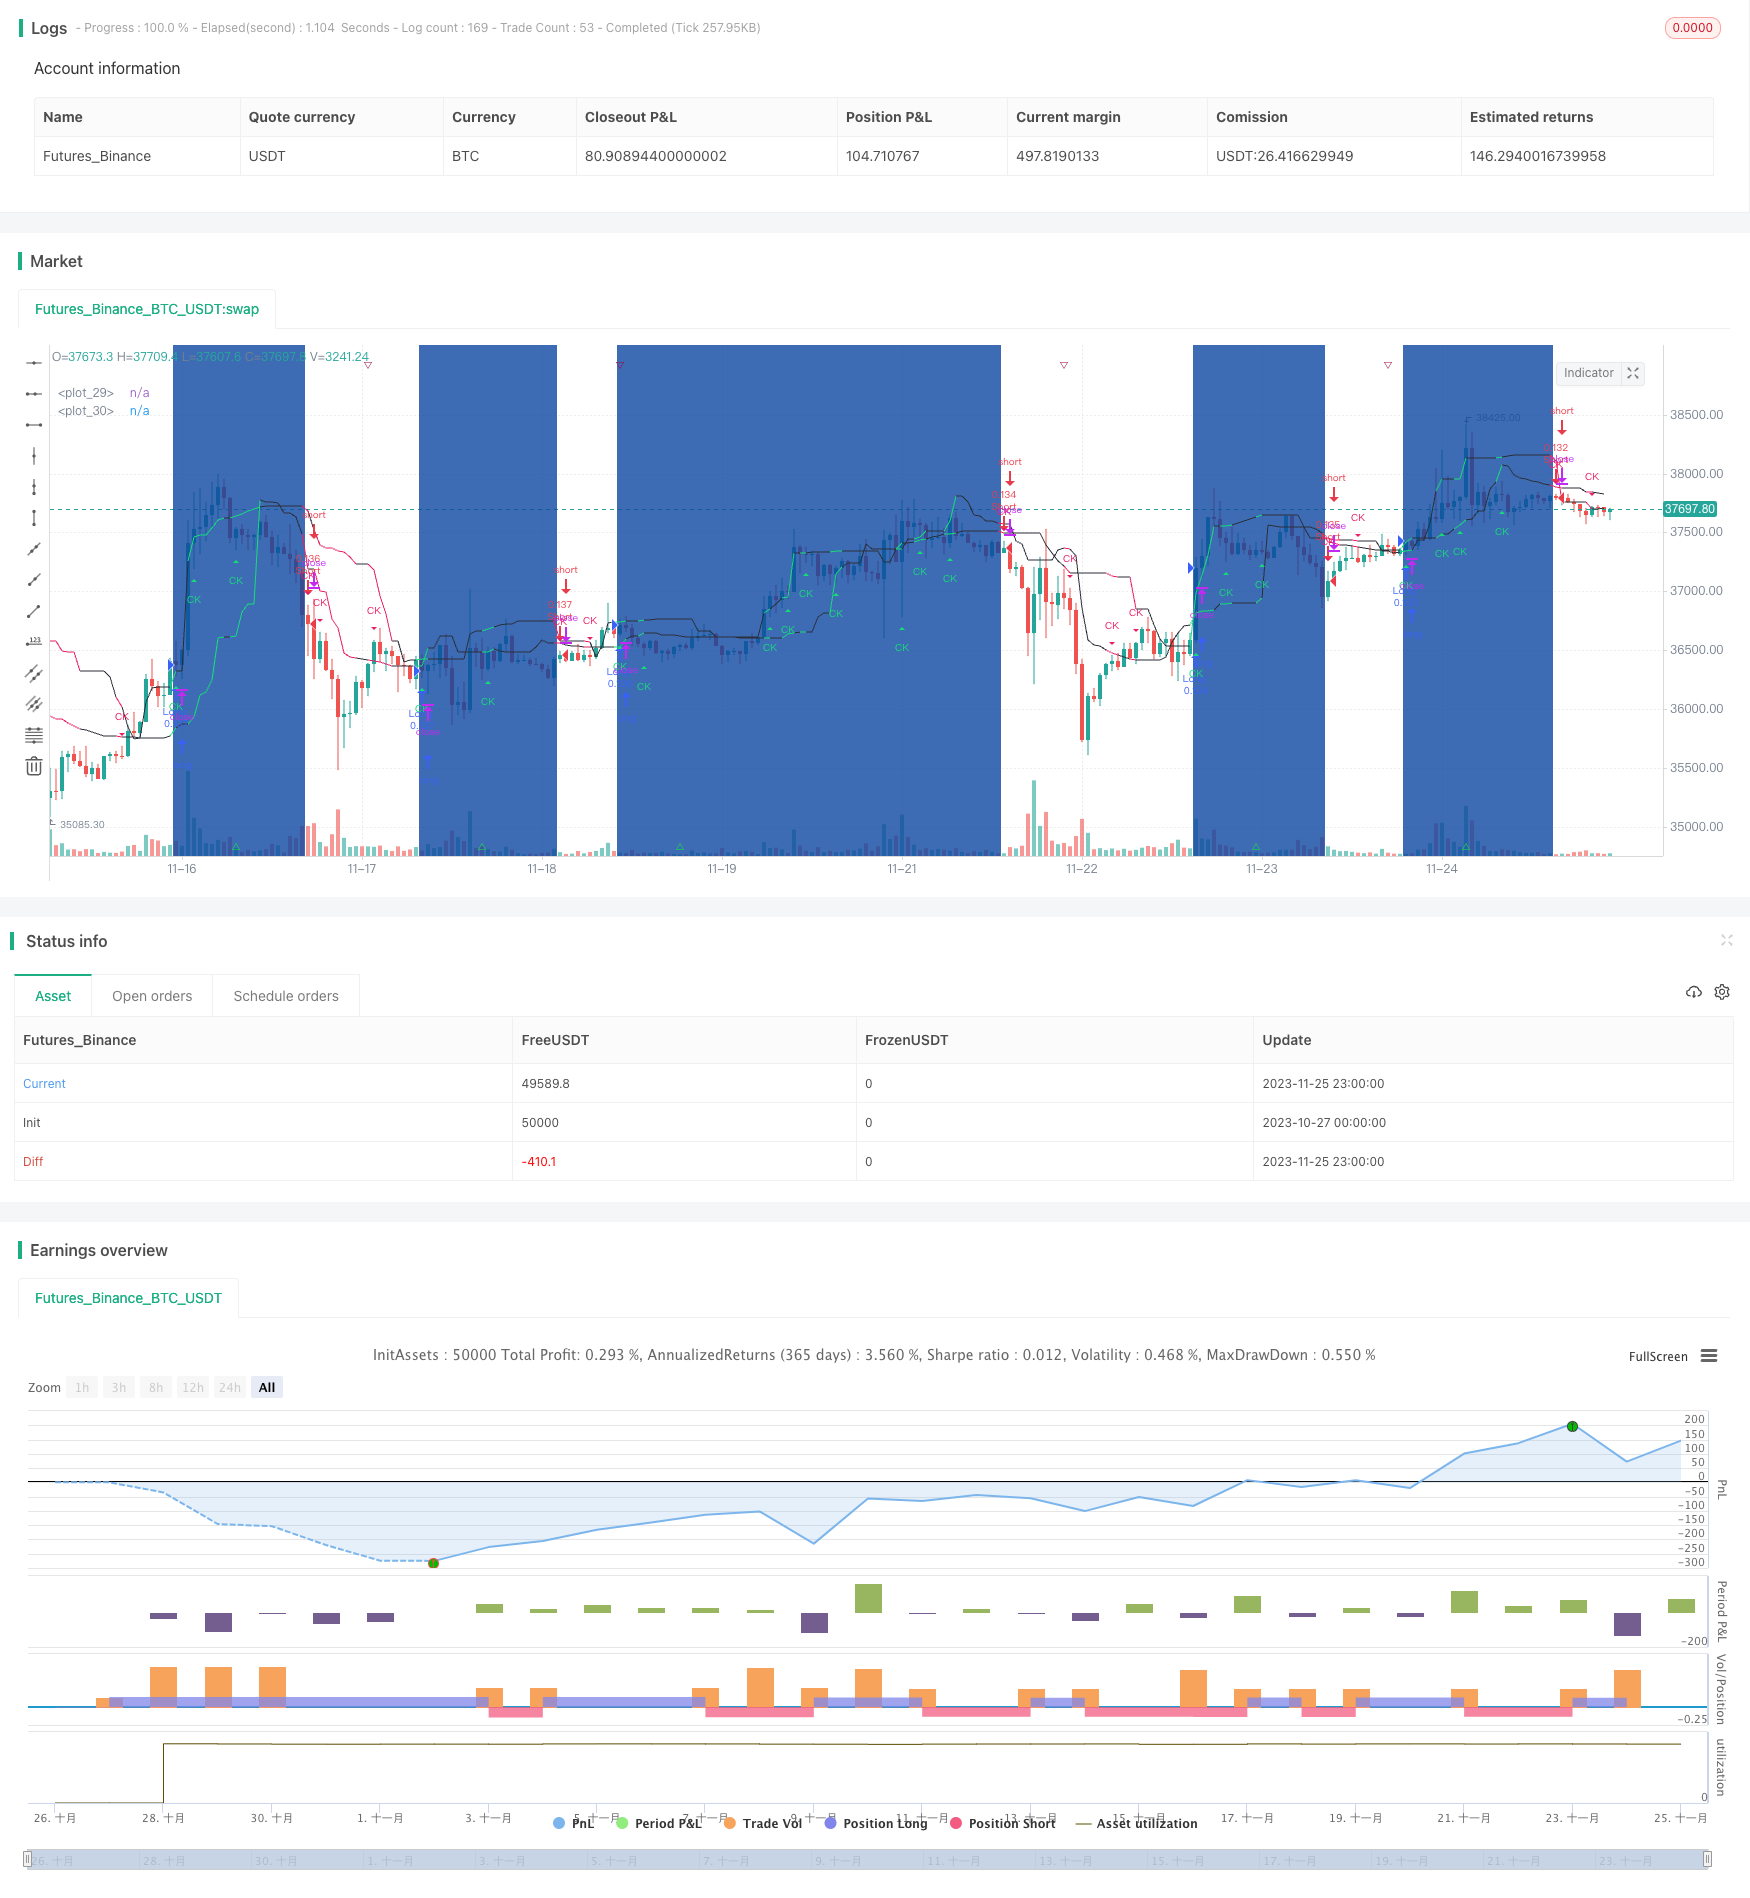
CK Momentum Reversal Stop Loss Strategy
Author: ChaoZhang, Date: 2023-11-27 18:13:58Tags:

Overview
This strategy uses the CK channel to determine price trends and sets dynamic stop loss lines to make reverse operations when price reversal occurs. It belongs to short-term trading strategies.
Strategy Principle
The strategy uses the CK channel to determine price trends and support/resistance. It calculates the upper and lower channel lines. When the price breaks through the channel lines, trading signals are generated. In addition, the strategy also tracks the movement of the channel lines and takes reverse positions when the channel lines reverse, which belongs to reversal trading strategies.
Specifically, the strategy calculates the upper and lower channel lines based on the highest and lowest prices. If the upper channel line starts to fall and the lower channel line starts to rise, it is determined as a price reversal to go short. On the contrary, if the lower channel line starts to fall and the upper channel line starts to rise, it is determined as a price reversal to go long.
Advantages of the Strategy
- Use double channels to determine price reversal points for accurate reverse operations
- Adopt dynamic stop loss to control risks and realize timely stop loss
- The strategy logic is simple and clear, easy to understand and implement
Risks of the Strategy
- When market prices fluctuate violently, the stop loss line may be broken, leading to greater losses
- More frequent trading can increase transaction costs
- Need to choose appropriate parameters to control the stop loss line, avoid too loose or too tight
Optimization of the Strategy
- Optimize stop loss line parameters to make it more reasonable and effective
- Incorporate trend indicators to judge the reliability of reversal signals, avoid reverse operations during the trend
- Increase automatic trading and automatic stop loss modules to reduce transaction costs
Summary
The overall idea of the strategy is clear and easy to understand. It uses double channels to determine price reversals and take reverse operations. And it sets dynamic stop loss to control risks. It belongs to typical short-term trading strategies. The strategy effect can be further optimized, mainly by adjusting the stop loss parameters and assisting other technical indicators to determine entry and exit timing.
/*backtest
start: 2023-10-27 00:00:00
end: 2023-11-26 00:00:00
period: 1h
basePeriod: 15m
exchanges: [{"eid":"Futures_Binance","currency":"BTC_USDT"}]
*/

//@version=4
//

//study(title="Chande Kroll Stop", shorttitle="CK Stop", overlay=true)
strategy(title="Chande Kroll Stop", shorttitle="Chande Kroll Stop回測", overlay=true, initial_capital=100000, calc_on_every_tick=true,default_qty_type=strategy.percent_of_equity, default_qty_value=10)
br_red = #e91e63,Red = #f41818,n_green = #91dc16,dk_green = #004d40,lt_green = #16dc78,lt_blue = #0dbdd8,dk_blue = #0a3577,Blue = #034fed,br_orange = #f57c00,dk_orange = #e65100,dk_gray = #434651,dk_pink = #7c1df0,lt_pink = #e743f5,Purple = #5b32f3,lt_purple = #6b5797

hiP = input(9, "",inline="h")
hix = input(1,"" ,inline="h", step=0.1)
hiQ = input(7,"" ,inline="h")
loP = input(9,"" ,inline="h1")
lox = input(1,"" ,inline="h1", step=0.1)
loQ = input(5,"" ,inline="h1")
Xr=input(false,"反向操作:買/賣",inline="T"),
first_high_stop = highest(high, hiP) - hix * atr(hiP)
first_low_stop = lowest(high, loP) + lox * atr(loP)

stop_short = highest(first_high_stop, hiQ)
stop_long = lowest(first_low_stop, loQ)

cklow = stop_short
ckhigh = stop_long


Xdn = cklow < cklow[1] and ckhigh < ckhigh[1]
Xup = cklow > cklow[1] and ckhigh > ckhigh[1]
longcol = Xup ? lt_green : Xdn ? br_red : #2a2e39
shortcol = Xup? lt_green : Xdn ? br_red : #2a2e39
plot(stop_long, color=longcol)
plot(stop_short, color=shortcol)


plotshape(Xup and not Xup[1] , title="CK Stop Buy", text='CK', style=shape.triangleup, size=size.tiny, location=location.belowbar, color=lt_green, textcolor=lt_green,display=display.none)
plotshape(Xdn and not Xdn[1], title="CK Stop Sell", text='CK', style=shape.triangledown, size=size.tiny, location=location.abovebar, color=br_red, textcolor=br_red,display=display.none)

//       , default_qty_type=strategy.percent_of_equity, default_qty_value=10, calc_on_every_tick=true)

tl=input(true,"Sig",inline="T"), sbg=input(true,"Bgtrend",inline="T"), vbuild="FIREHORSE XRPUSDT"
Xp = 0.0, Xp:=Xdn? -1 : Xup? 1 : Xp[1], Xdf = Xr? Xup and Xp[1] == -1 : Xdn and Xp[1] == 1 ,Xuf = Xr?  Xdn and Xp[1] == 1: Xup and Xp[1] == -1
FY=input(2021,"年",inline="btf"),FM=input(9,"月",inline="btf"),FD=input(01,"日",inline="btf"),
TY = input(2032,"年",inline="to"),TM=input(01,"月",inline="to"),TDy=input(01,"日",inline="to"),
testTF = time>=timestamp(FY,FM,FD,00,00) and time <= timestamp(TY,TM,TDy,23,59)?  true:false


plotchar(tl? Xuf:na,vbuild+" 生門","△",location.bottom, #14e540,10,0," " ,#14e540,1,size.tiny)// ︽  ︾
plotchar(tl? Xdf:na,vbuild+" 傷門","▽",location.top,  #9b0842,10,0," ", #9b0842,1,size.tiny)
bgcolor(sbg ? Xp==1 ? #0d47a1 :na: na, transp=90),
alertcondition(Xuf,vbuild+ "Buy", "Long 💹 \n"+vbuild),  alertcondition(Xdf, vbuild+ " Sell","Short 🈹\n"+vbuild)

if Xuf
    alert("Long " + tostring(close)+"\nLong "+input("My Long  Msg","Long Alert Msg")+vbuild, alert.freq_once_per_bar)
if Xdf
    alert("Short " + tostring(close)+"\nShort"+input("My Short Msg","Short Alert Msg")+vbuild, alert.freq_once_per_bar)


if testTF
    strategy.entry("Long ", strategy.long,  comment=" Long ",when=Xuf), strategy.entry("Short", strategy.short, comment=" Short",when=Xdf )
- Combo Trend Reversal Moving Average Crossover Strategy
- Pivot-based RSI Divergence Strategy
- Golden Ratio Breakout Long Strategy
- Bollinger Bands Strategy with RSI Filter
- A Trend Following Strategy Based on Keltner Channels
- RSI Moving Average Crossover Strategy
- momentum breakout trading strategy
- Dynamic RSI and CCI Combined Multi-factor Quantitative Trading Strategy
- Super Z Quantitative Trend Strategy
- Candlestick Pattern Strategy
- Dual Moving Average Oscillation Breakthrough Strategy
- Momentum Smooth Moving Average Line and Moving Average Line Crossover Strategy
- Moving Average Crossover Trading Strategy
- Range Breakthrough Dual Moving Average Filtering Strategy
- Cross Moving Average Price Strategy
- No Nonsense SSL Channel Trading Strategy
- Momentum Breakout Moving Average Strategy
- Dual Moving Average Crossover Breakout Strategy
- Double Filtering High Frequency Quantitative Trading Strategy
- Quantitative Trading Strategy Based on RSI Indicator