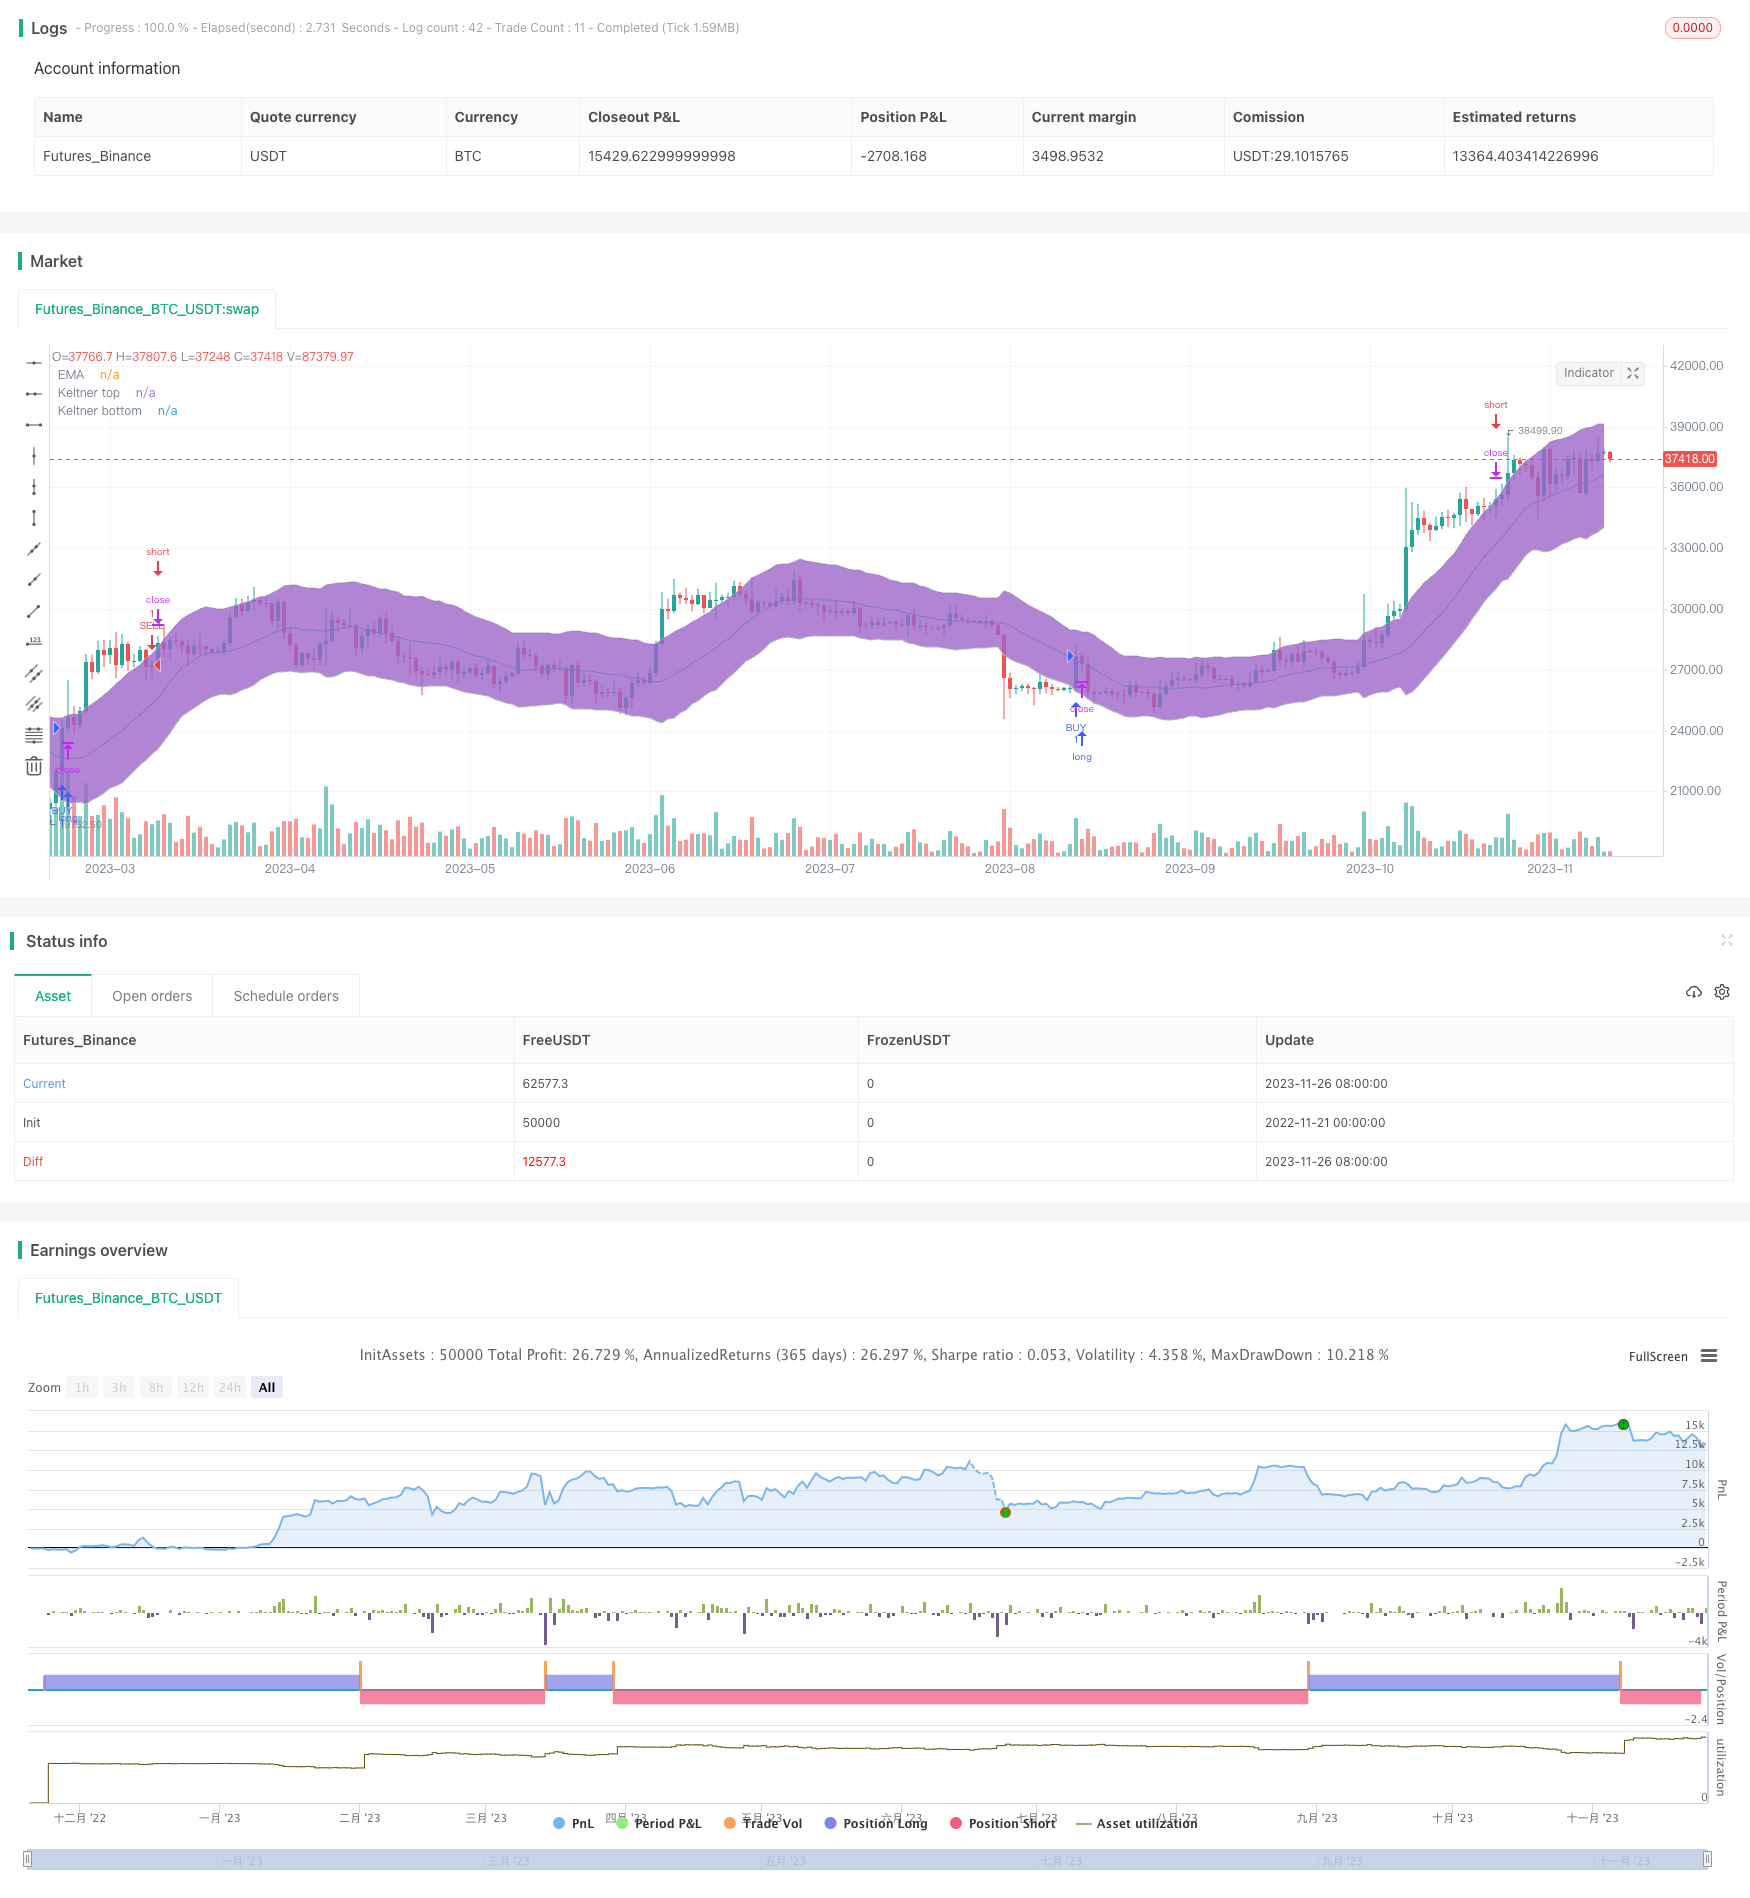
A Trend Following Strategy Based on Keltner Channels
Author: ChaoZhang, Date: 2023-11-28 11:50:09Tags:

Overview
This strategy is designed based on the Keltner Channel indicator of candlestick charts to track trends by judging price breakouts of channel bands. The strategy is suitable for medium-term holding positions and can effectively follow trends with high profit potential.
Strategy Logic
The core of this strategy lies in constructing a Keltner Channel to judge price trends and potential support/resistance levels. Specifically, it first calculates the EMA line of candlesticks, then adds upper and lower bands at a distance of keltnerDeviation times ATR volatility to build the Keltner Channel. When the price breaks above the lower band, a long position is opened. When the price breaks below the upper band, a short position is opened to follow trends. In addition, the strategy also provides a closeOnEMATouch parameter to control whether to take profit when the price touches the EMA line.
The key logic focuses on three parts:
-
Construct the Keltner Channel indicator, including calculating the EMA, ATR volatility, upper and lower bands.
-
Judge entry signals based on breakouts of the channel bands, including going long when the price breaks above the lower band and going short when the price breaks below the upper band.
-
Provide the closeOnEMATouch parameter to control whether to take profit when the price touches the EMA line.
By combining these three parts, a trend following trading strategy based on channel indicators is implemented.
Advantage Analysis
Compared with traditional moving stop loss strategies, this strategy has the following main advantages:
-
Can effectively follow market trends and general direction.
-
Relatively long medium-term holding periods avoid over-frequent trading.
-
By considering volatility, it has a certain filtering effect against abnormal market conditions.
-
Provides risk control mechanisms through stop loss.
Therefore, this strategy is very suitable for quantitative traders who have accurate judgments on market trends and pursue high capital utilization.
Risk Analysis
Despite its advantages, the strategy also faces some key risks in actual trading:
-
Sudden and violent trend reversal poses the biggest risk, which may penetrate the stop loss point and cause huge losses.
-
Price may oscillate within the channel and trigger stop loss repeatedly.
-
High trading frequency may lead to severe impact on profits from trading costs and slippage.
To control these risks, we can adjust parameters to make the channel range more reasonable, choose products with smaller price fluctuations, or properly widen the stop loss distance. But most importantly, we need to keep prudent enough judgments on the markets.
Optimization Directions
Considering the potential risks, we can further optimize the strategy in the following aspects:
-
Increase diversity of stop loss methods. Currently only the closeOnEMATouch method is provided. We can introduce more auxiliary stop loss indicators for more comprehensive and multidimensional risk control.
-
Optimize parameter settings. More automated methods can be introduced to optimize parameters to make the Keltner Channel settings more intelligent and adaptive.
-
Add position sizing control. By introducing capital management modules, we can dynamically adjust positions based on drawdowns or market volatility.
-
Add filtering conditions. More auxiliary filters can be set on both entry and stop loss to avoid unnecessary losses due to wrong signals.
Summary
In summary, this is a typical medium-term trend following strategy based on channel indicators. Compared to simple moving stop loss strategies, it provides a certain risk adjustment function through volatility factors and can effectively follow trends to make profits. However, risks of reversal and oscillation still need to be watched out for in live trading. Parameter optimization, expanding stop loss methods and adding filtering conditions can help further improve the strategy.
/*backtest
start: 2022-11-21 00:00:00
end: 2023-11-27 00:00:00
period: 1d
basePeriod: 1h
exchanges: [{"eid":"Futures_Binance","currency":"BTC_USDT"}]
*/

//@version=2
strategy("Keltner bounce from border. No repaint. (by Zelibobla)", shorttitle="Keltner border bounce", overlay=true)

price = open

// build Keltner
keltnerLength = input(defval=20, minval=1, title="Keltner EMA Period Length")
keltnerDeviation = input(defval=2, minval=1, maxval=5, title="Keltner band width (in ATRs)")
closeOnEMATouch = input(type=bool, defval=false, title="Close trade on EMA touch? (less drawdown, but less profit and higher commissions impact)")
EMA = sma(price, keltnerLength)
ATR = atr(keltnerLength)
top = EMA + ATR * keltnerDeviation
bottom = EMA - ATR * keltnerDeviation

buyEntry = crossover(price, bottom)
sellEntry = crossunder(price, top)
plot(EMA, color=aqua,title="EMA")
p1 = plot(top, color=silver,title="Keltner top")
p2 = plot(bottom, color=silver,title="Keltner bottom")
fill(p1, p2)

if ( crossover(price, bottom))
    strategy.entry("BUY", strategy.long, stop=bottom,  comment="BUY")

if( crossover(price,EMA) and closeOnEMATouch )
    strategy.close("BUY")

if ( crossunder(price, top))
    strategy.entry("SELL", strategy.short, stop=top,  comment="SELL")
if( crossunder(price, EMA) and  closeOnEMATouch )
    strategy.close("SELL")
- Weighted Moving Average Breakout Reversal Strategy
- Moving Average Relative Strength Index Strategy
- ADX Intelligent Trend Tracking Strategy
- RSI Momentum Aggregation Strategy
- Trailing Stop Loss Strategy Based on Price Gaps
- Moving Average Breakout Strategy
- Combo Trend Reversal Moving Average Crossover Strategy
- Pivot-based RSI Divergence Strategy
- Golden Ratio Breakout Long Strategy
- Bollinger Bands Strategy with RSI Filter
- RSI Moving Average Crossover Strategy
- momentum breakout trading strategy
- Dynamic RSI and CCI Combined Multi-factor Quantitative Trading Strategy
- Super Z Quantitative Trend Strategy
- Candlestick Pattern Strategy
- CK Momentum Reversal Stop Loss Strategy
- Dual Moving Average Oscillation Breakthrough Strategy
- Momentum Smooth Moving Average Line and Moving Average Line Crossover Strategy
- Moving Average Crossover Trading Strategy
- Range Breakthrough Dual Moving Average Filtering Strategy