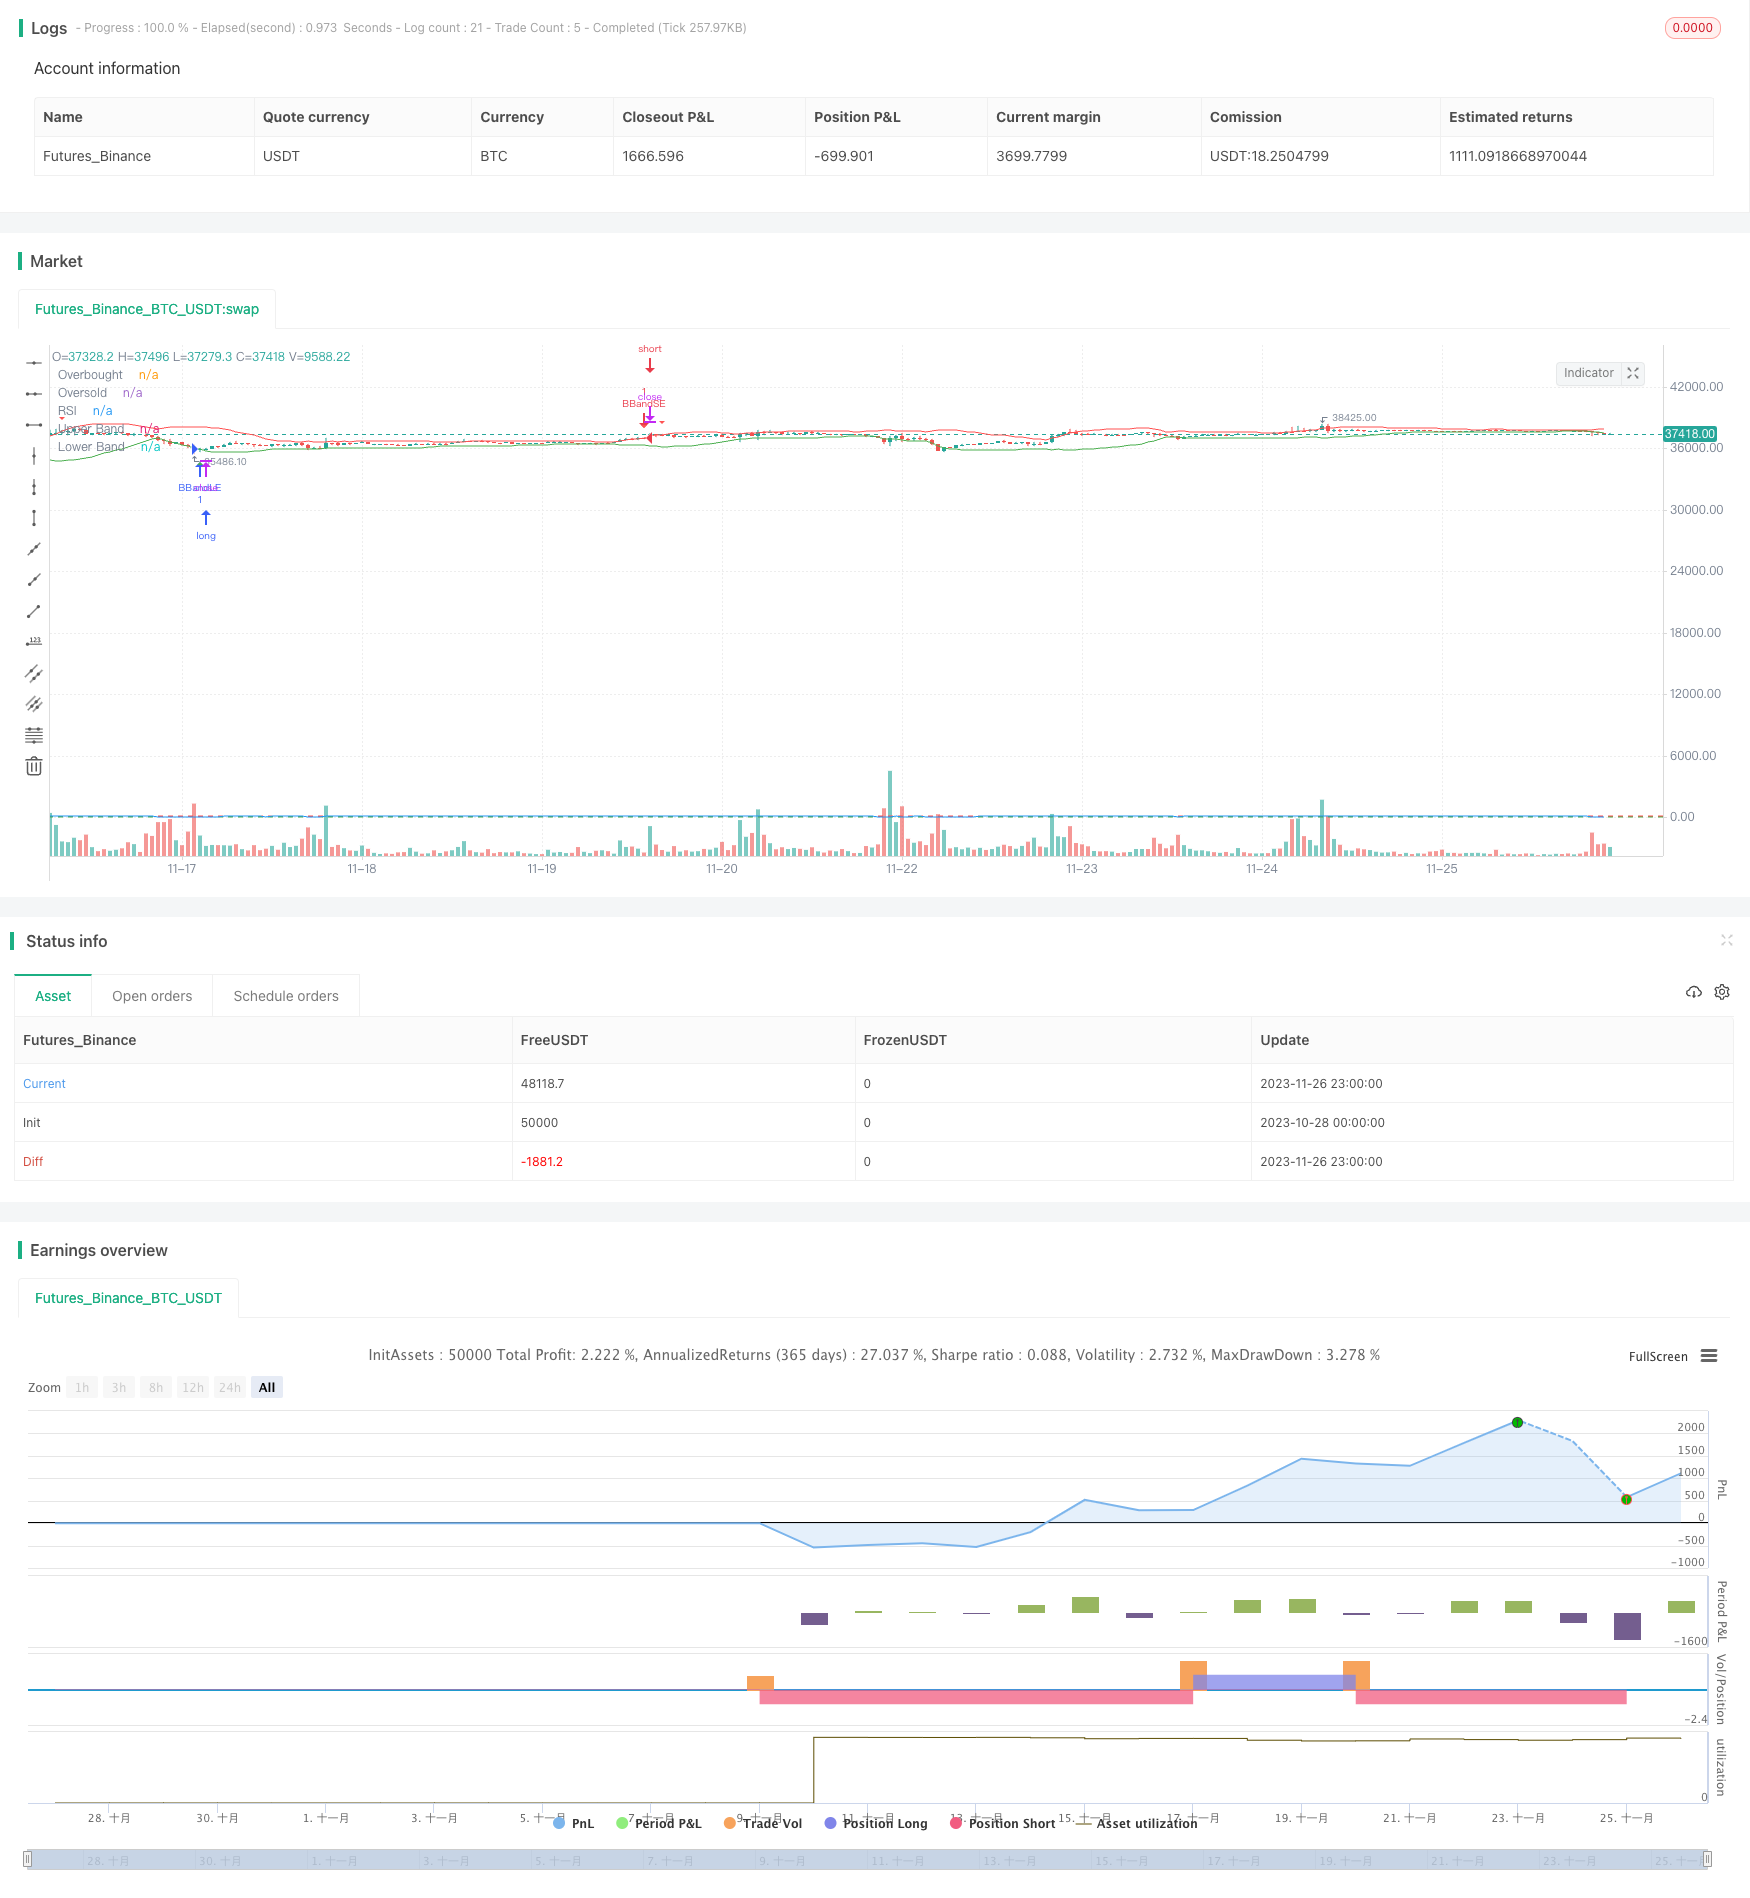
Bollinger Bands Strategy with RSI Filter
Author: ChaoZhang, Date: 2023-11-28 12:12:41Tags:

Overview
The name of this strategy is “Bollinger Bands Strategy with RSI Filter”. It utilizes the principles of Bollinger Bands combined with the RSI indicator as a filter for entry signals. This strategy can effectively determine market trends for buying low and selling high to achieve decent profits.
Strategy Principle
The core indicator of this strategy is Bollinger Bands, consisting of the middle band, upper band and lower band. The middle band is the n-period moving average, the upper band is the middle band plus k times the n-period standard deviation, and the lower band is the middle band minus k times the n-period standard deviation. When the price approaches the upper band, the market is overvalued and short positions should be considered. When the price approaches the lower band, the market is undervalued and long positions should be considered.
In addition to Bollinger Bands, this strategy incorporates the RSI indicator as a filter for entry signals. The RSI judges whether the market is overbought or oversold. Values above 70 indicate overbought conditions and values below 30 indicate oversold conditions. This strategy only enters trades when Bollinger Bands give signal concurrently with RSI reaching overbought or oversold levels.
Specifically, when the price breaks above the lower Bollinger Band from below while the RSI is below 30, a buy signal is generated. When the price breaks below the upper Bollinger Band from above while the RSI is above 70, a sell signal is generated.
Advantage Analysis
This strategy combines Bollinger Bands with the RSI indicator to effectively identify overbought and oversold market conditions, avoiding unnecessary losses from false breakouts. The RSI acts as a filter to remove some market noise, making entry timing more accurate.
The strategy has few parameters and is simple to implement, suitable for quantitative traders of all skill levels. A mid to long-term holding strategy avoids interference from short-term market fluctuations.
In summary, the advantages are:
- Stronger judgment integrating Bollinger Bands and RSI
- Reduces losses from false breakouts
- Simple parameters, easy to implement
- Smaller drawdowns with mid to long-term holdings
Risk Analysis
Some risks to be aware of with this strategy include:
- Inappropriate Bollinger Bands parameter settings worsen signal quality
- Bollinger Bands tend to follow price action in trending markets
- RSI divergences affect signal accuracy
- Infrequent trading signals risk long-term losses
To control these risks:
- Optimize parameters to find best combinations
- Consider higher timeframe structure to avoid ranging markets
- Confirm RSI signals with other indicators to avoid false signals
- Adjust holding period to prevent severe losses
Optimization Directions
Further improvements:
- Test different RSI parameters
- Incorporate stop losses to better control risk
- Add other indicators to combine confirmations
- Utilize machine learning for automated parameter optimization
These enhancements can improve stability, optimize parameters, and strengthen risk management.
Conclusion
The “Bollinger Bands Strategy with RSI Filter” integrates Bollinger Bands’ overbought/oversold identification with RSI’s momentum gauge to form a robust quantitative strategy. The strategy has unique advantages in determining market opportunities across timeframes, capable of generating significant alpha.
Nonetheless, there is room for improvement via parameter optimization and risk control to adapt performance across diverse market conditions, an area warranting further research.
/*backtest
start: 2023-10-28 00:00:00
end: 2023-11-27 00:00:00
period: 1h
basePeriod: 15m
exchanges: [{"eid":"Futures_Binance","currency":"BTC_USDT"}]
*/

//@version=5
strategy("Bollinger Bands Strategy with RSI Filter", overlay=true)
source = close
length = input.int(20, minval=1)
mult = input.float(2.0, minval=0.001, maxval=50)
basis = ta.sma(source, length)
dev = mult * ta.stdev(source, length)
upper = basis + dev
lower = basis - dev

// RSI Filter
rsiLength = input(14, title="RSI Length")
rsiOverbought = input(70, title="RSI Overbought Level")
rsiOversold = input(30, title="RSI Oversold Level")
rsiValue = ta.rsi(source, rsiLength)

// Buy and Sell Conditions with RSI Filter
buyEntry = ta.crossover(source, lower) and rsiValue < rsiOversold
sellEntry = ta.crossunder(source, upper) and rsiValue > rsiOverbought

// Entry and Exit Logic
if (buyEntry)
    strategy.entry("BBandLE", strategy.long, stop=lower, oca_name="BollingerBands", comment="BBandLE")
else
    strategy.cancel(id="BBandLE")

if (sellEntry)
    strategy.entry("BBandSE", strategy.short, stop=upper, oca_name="BollingerBands", comment="BBandSE")
else
    strategy.cancel(id="BBandSE")

// Plot Bollinger Bands on the chart
plot(upper, color=color.red, title="Upper Band")
plot(lower, color=color.green, title="Lower Band")

// Plot RSI on the chart
hline(rsiOverbought, "Overbought", color=color.red)
hline(rsiOversold, "Oversold", color=color.green)
plot(rsiValue, color=color.blue, title="RSI")

// Plot buy and sell signals on the chart
plotshape(series=buyEntry, title="Buy Signal", color=color.green, style=shape.triangleup, location=location.belowbar)
plotshape(series=sellEntry, title="Sell Signal", color=color.red, style=shape.triangledown, location=location.abovebar)
- SuperTrend Strategy with Trailing Stop Loss
- Weighted Moving Average Breakout Reversal Strategy
- Moving Average Relative Strength Index Strategy
- ADX Intelligent Trend Tracking Strategy
- RSI Momentum Aggregation Strategy
- Trailing Stop Loss Strategy Based on Price Gaps
- Moving Average Breakout Strategy
- Combo Trend Reversal Moving Average Crossover Strategy
- Pivot-based RSI Divergence Strategy
- Golden Ratio Breakout Long Strategy
- A Trend Following Strategy Based on Keltner Channels
- RSI Moving Average Crossover Strategy
- momentum breakout trading strategy
- Dynamic RSI and CCI Combined Multi-factor Quantitative Trading Strategy
- Super Z Quantitative Trend Strategy
- Candlestick Pattern Strategy
- CK Momentum Reversal Stop Loss Strategy
- Dual Moving Average Oscillation Breakthrough Strategy
- Momentum Smooth Moving Average Line and Moving Average Line Crossover Strategy
- Moving Average Crossover Trading Strategy