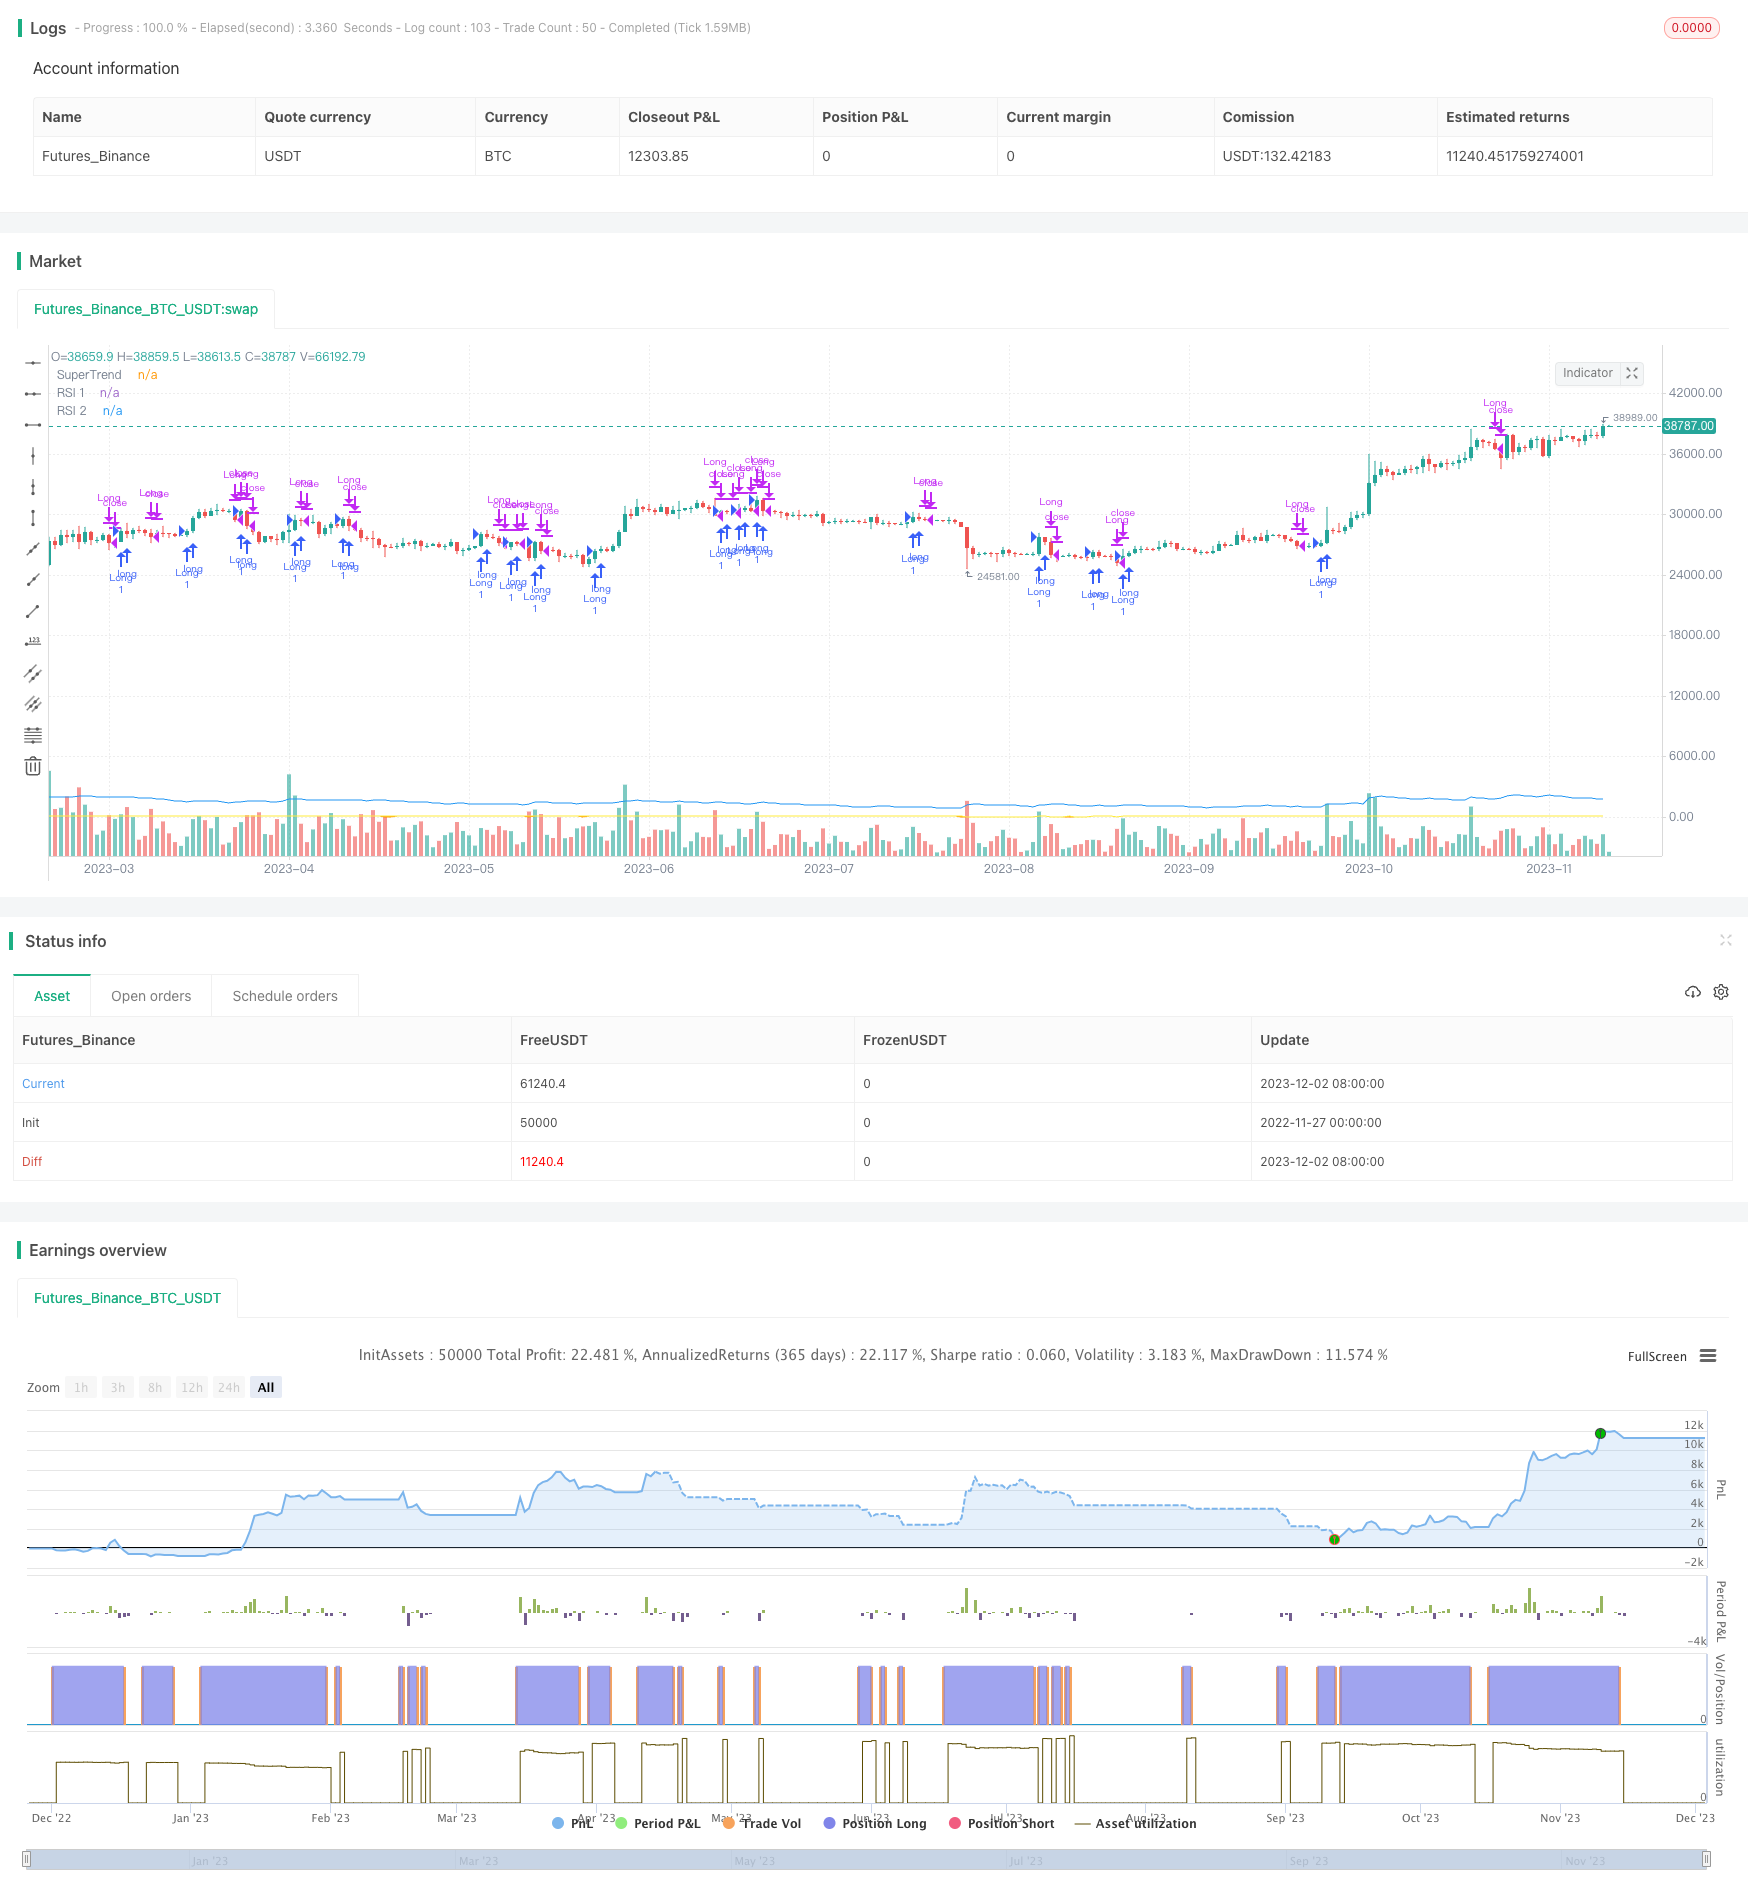
Momentum Breakout Moving Average Trading Strategy
Author: ChaoZhang, Date: 2023-12-04 15:57:06Tags:

Overview
This strategy integrates Relative Strength Index (RSI), SuperTrend indicator and Average True Range (ATR) to construct a comprehensive and practical quantitative trading strategy.
Strategy Logic
Relative Strength Index (RSI)
RSI is a powerful oscillating indicator that judges if the market is overbought or oversold by measuring the velocity and magnitude of price movements. RSI below oversold region indicates oversold signal, while RSI above overbought region is overbought signal.
SuperTrend Indicator
SuperTrend is a trend following indicator that helps identify current trend direction. Price above SuperTrend line indicates an uptrend while price below SuperTrend line an downtrend.
Average True Range (ATR)
ATR measures the degree of market volatility and risk level. Higher ATR represents higher market volatility while lower means relatively calm. This strategy leverages ATR to set stop loss and profit target.
Strategy Execution Logic
Long Signal: When fast RSI crosses below slow RSI while price is above SuperTrend line to go long.
Short Signal: When fast RSI crosses above slow RSI while price is below SuperTrend line to go short.
Exit Rule: If holding long position, exit when fast RSI crosses above slow RSI OR price falls below SuperTrend line. If holding short position, exit when fast RSI crosses below slow RSI OR price rises above SuperTrend line.
Advantages
-
Trend Following: SuperTrend identifies trend clearly.
-
Momentum Confirmation: RSI ensures trades align with market sentiment.
-
Volatility Adaptive: ATR-driven stop loss adapts to varying market conditions.
Risks & Solutions
-
Trend Misalignment Risk: Probability of conflicts between SuperTrend and actual trend direction resulting losses. Parameter optimization helps to improve accuracy.
-
Premature Stop Loss Risk: Stop loss too close may get hit unintentionally. Reasonable stop distance should be set.
-
Parameter Risk: Improper RSI parameters setting affects timing of entries and exits. Careful backtests required to determine proper parameters.
Enhancement Recommendations
-
Add other technical indicators to filter signals improving system stability.
-
Optimize RSI parameters based on maximum drawdown constraints.
-
Leverage heuristic algorithms to search optimal SuperTrend parameters.
Conclusion
This strategy integrates trend, momentum and volatility indicators constructing a quantitative model with clear signals, flexible parameter tuning, and sound risk control. With continuous testing and enhancement, it is promising to achieve steady above-average returns over the long run.
/*backtest
start: 2022-11-27 00:00:00
end: 2023-12-03 00:00:00
period: 1d
basePeriod: 1h
exchanges: [{"eid":"Futures_Binance","currency":"BTC_USDT"}]
*/

//@version=5
strategy("RSI, SuperTrend, and ATR Strategy", overlay=true)

// Define input parameters
rsiLength1 = input(14, title="RSI Length 1")
rsiLength2 = input(21, title="RSI Length 2")
supertrendMultiplier = input(1.5, title="SuperTrend Multiplier")

// Calculate indicators
rsi1 = ta.rsi(close, rsiLength1)
rsi2 = ta.rsi(close, rsiLength2)
supertrend = ta.atr(14) * supertrendMultiplier

// Define trading conditions
rsiLongCondition = rsi1 > rsi2
rsiShortCondition = rsi1 < rsi2
supertrendLongCondition = close > supertrend
supertrendShortCondition = close < supertrend

// Execute trades
if (rsiLongCondition and supertrendLongCondition)
    strategy.entry("Long", strategy.long)

if (rsiShortCondition and supertrendShortCondition)
    strategy.entry("Short", strategy.short)

if (strategy.position_size > 0 and (rsiShortCondition or supertrendShortCondition))
    strategy.close("Long")

if (strategy.position_size < 0 and (rsiLongCondition or supertrendLongCondition))
    strategy.close("Short")

// Plot indicators on the chart
plot(rsi1, color=color.orange, title="RSI 1")
plot(rsi2, color=color.yellow, title="RSI 2")
plot(supertrend, color=color.blue, title="SuperTrend")
- SuperTrend Multi Timeframe Backtest Strategy
- Eight Days Reversal Momentum Strategy
- Dual Moving Average Breakthrough Strategy
- Golden Cross Moving Average Trading Strategy
- Multi Indicator Quantitative Trading Strategy
- Full Crypto Swing ALMA Cross MACD Quantitative Strategy
- Dual Moving Average Reversal Trading Strategy
- Adaptive Price Channel Strategy
- Turtle Breakout Strategy
- Mean Reversion Envelope Moving Average Strategy
- Dynamic Grid Trading Management Strategy
- Dynamic Moving Average Tracking Strategy
- Double Moving Average Oscillation Trading Strategy
- EMA bands + Leledc + Bollinger bands trend following strategy
- Fast RSI Strategy Analysis
- Adaptive Volatility Breakout Trading Strategy
- High Minus Exponential Moving Average Stock Strategy
- Donchian Channel Breakout Strategy
- Bitcoin - MA Crossover Strategy
- Fisher Transform Backtest Strategy