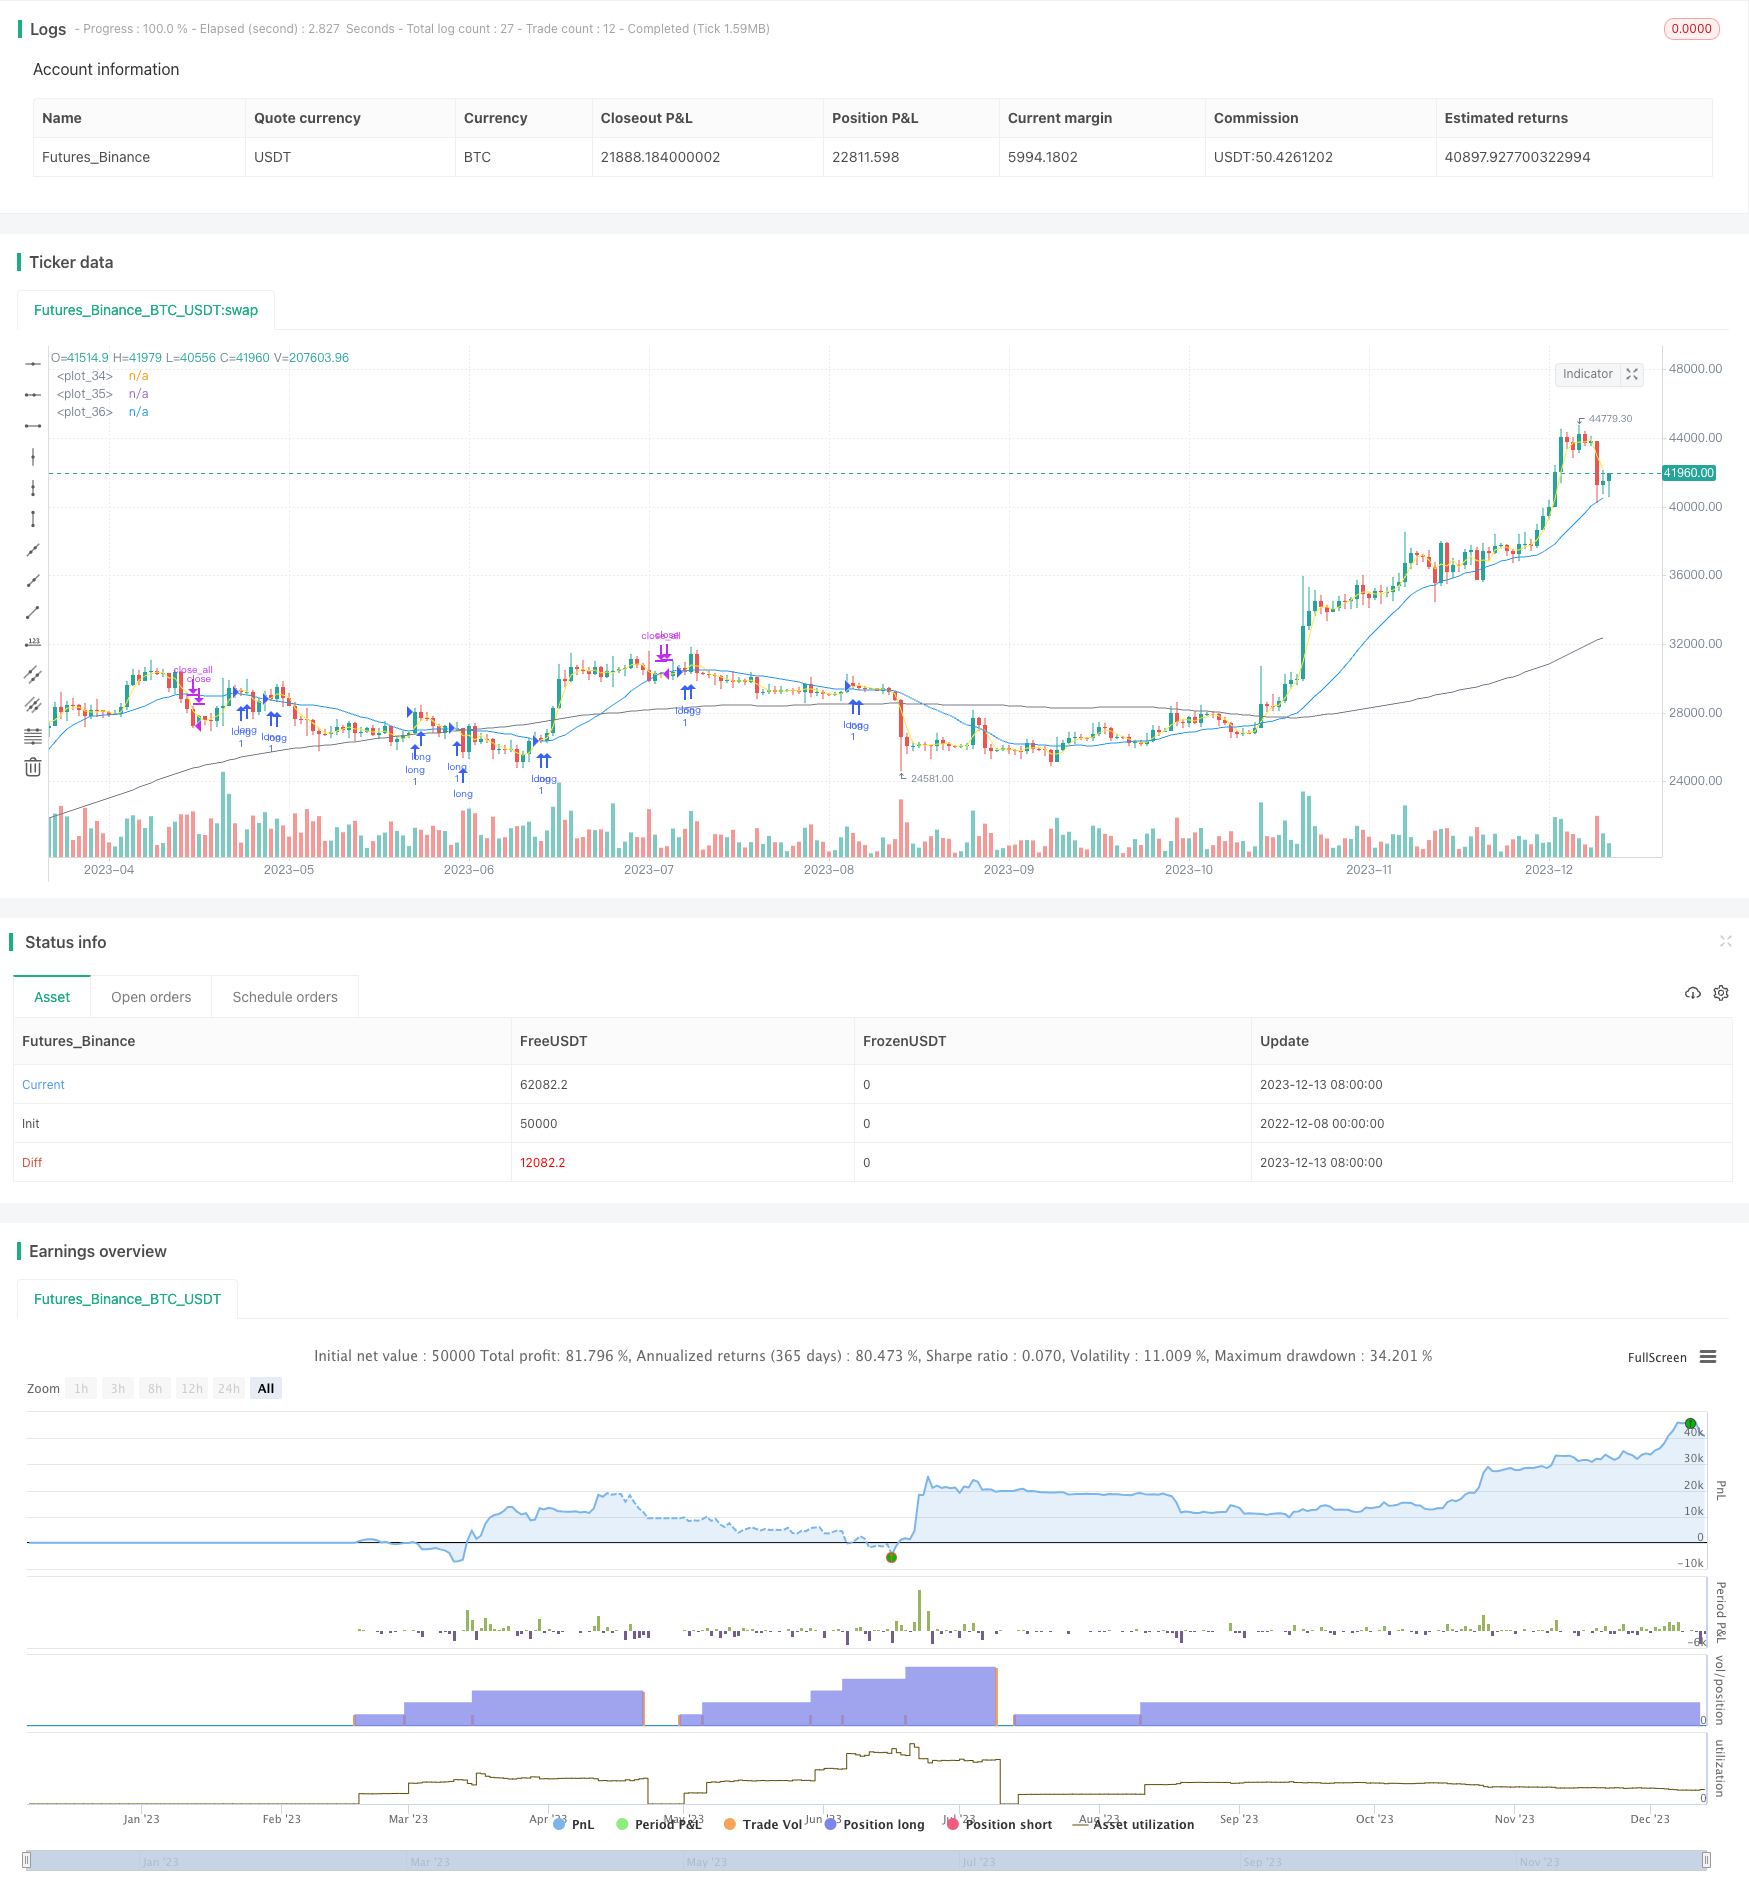
Golden Dead Cross Trend Tracking Strategy
Author: ChaoZhang, Date: 2023-12-15 16:10:24Tags:

Overview
The golden dead cross trend tracking strategy determines the timing of entry and exit by calculating the crossovers between short-term and long-term moving averages. At the same time, it also combines the judgment of larger time frame trends. It would only go long when the major trend goes up to avoid going against the trend.
Strategy Logic
The core indicators of this strategy are the short-term and long-term moving averages. The short-term line usually chooses relatively short periods like 5-day and 10-day to sensitively reflect the recent price changes. The long-term line usually chooses relatively long periods like 20-day and 60-day to reflect the major trend. When the short-term line goes above the long-term line, a golden cross is formed, indicating an uptrend. When the short-term line goes below the long-term line, a dead cross is formed, indicating a downtrend.
This strategy also uses an even longer period moving average to determine the direction of the major trend. It would only go long on golden crosses when the major trend is up. After going long, it would lock in profits based on the configured profit target. When the price rise hits the profit target, it would actively lock in profits and exit.
In downtrends, this strategy uses dead crosses to cut losses. When the short-term MA crosses below the long-term MA forming a dead cross, if the current position already has some profits at that point, it would choose to cut losses and exit to avoid risks associated with downtrends.
Advantages
The rules of using golden dead crosses are simple and clear, easy to understand and implement. Also, combining with trend analysis helps reduce the risk of being caught in trend trades. The advantages are:
1. Accurate entry, tracking strengths
The golden cross indicates the short-term trend has turned bullish and prices may breakout and rise. Entering at this point allows accurately capturing potential breakout opportunities. Also, only going long when the major trend is up avoids going against the trend.
2. Reasonable profit-taking, ensuring partial profits
By setting a fixed percentage as the profit target and actively taking profits when it is reached, this profit-taking approach is simple and practical to lock in partial profits after big rises.
3. Timely stop loss, controlling risks
Using dead crosses to determine trend reversal and cut losses in downtrends allows maximum avoiding risks and losses during downtrends, effectively controlling risks.
Risks
The main risks come from two aspects:
1. Inaccurate signal risks
In complex market environments, purely relying on simple indicators like golden dead crosses to determine trends can lead to some inaccurate signals. Price action patterns can be more accurate in complex environments.
2. Improper profit target and stop loss risks
Fixed percentage profit targets and stop losses cannot fully adapt to market changes. If profit percentage is too low, it would exit too early leading to lost profits. If stop loss percentage is too high, it may lead to larger losses.
To address these risks, some optimization methods include:
Using more indicators like baseline, channel lines to improve trend and key points recognition accuracy.
Use dynamic profit targets and stop losses instead of fixed percentages, with the ability to adjust based on market changes.
Conclusion
The golden dead cross trend tracking strategy uses simple indicators for trend determination, which is easy to understand. It also filters signals using trend analysis to reduce being caught in traps. It has the advantages of clear rules, dynamic profit-taking and timely stop losses. But the accuracy of cross signals needs improvement and profit targets and stop loss mechanisms require further optimization, which are the main problems and improvement directions.
/*backtest
start: 2022-12-08 00:00:00
end: 2023-12-14 00:00:00
period: 1d
basePeriod: 1h
exchanges: [{"eid":"Futures_Binance","currency":"BTC_USDT"}]
*/

// This source code is subject to the terms of the Mozilla Public License 2.0 at https://mozilla.org/MPL/2.0/
// © Ta3MooChi
//@version=5
strategy("전략", overlay=true,process_orders_on_close = true, pyramiding = 100)

short_ma = ta.sma(close,input.int(3, "단기 이평", minval = 1))
long_ma = ta.sma(close, input.int(19,"장기 이평", minval = 1))

trend_ma = ta.sma(close, input.int(100," 추세 이평", minval = 20, group = "추세 이평"))
up_trend = (trend_ma > trend_ma[1])
use_trend_ma = input.bool(true, title = "추세용 이평 사용", group = "추세 이평" )
inTrendMa = not use_trend_ma or up_trend

useDateFilter = input.bool(true, title = "특정 기간 백테스트", group = "기간 백테스트")
backtestStartDate = input(timestamp("1 Jan 2021"), title = "시작날짜", group = "기간 백테스트")
backtestEndDate = input(timestamp("1 Jan 2022"), title = "종료날짜", group = "기간 백테스트")
inTradeWindow = true

longStopPerc = 1 + input.float(3, "최소수익률%", minval = 1)*0.01

longcondition = ta.crossover(short_ma, long_ma)
shortcondition = ta.crossunder(short_ma, long_ma)

if (longcondition) and inTradeWindow and inTrendMa
    strategy.entry("long", strategy.long)

if (shortcondition) and (close > strategy.position_avg_price*longStopPerc) and inTradeWindow
    strategy.close_all()

if not inTradeWindow and inTradeWindow[1]
    strategy.cancel_all()
    strategy.close_all(comment = "매매 종료")

plot(short_ma,color = color.yellow)
plot(long_ma,color = color.blue)
plot(trend_ma,color = color.gray)
- SMA and RSI Long Only Strategy
- Dual Moving Average Reversal Breakout Strategy
- Trend Following Strategy Based on Ichimoku Cloud
- High Frequency Trading Strategy Based on Bollinger Bands and StochRSI Indicators
- Dual Reversion Balance Strategy
- HYE Mean Reversion SMA Strategy
- Dual Moving Average Reversal Strategy
- Dual Direction Price Breakthrough Moving Average Timing Trading Strategy
- Bollinger Breakout Stock Strategy
- Seven Candlestick Oscillation Breakthrough Strategy
- Quantitative Trading Strategy Based on TRSI and SUPER Trend Indicators
- An Intraday Trend Following Quantitative Strategy Based on Multi-indicator Condition Filtering
- Bollinger Bands and RSI Short Selling Strategy
- Reverse Trading Strategy Based on Overlapping Price Differentials
- Price Deviation from Daily Average Trading Strategy
- Dual Moving Average Triple Exponential Indicator Trading Strategy
- Momentum Indicator Decision Trading Strategy
- MACD Long Reversal Strategy
- Dual Timeframe Trend Tracking Strategy
- Breakout Strategy with Confirmation on Multiple Time Frames