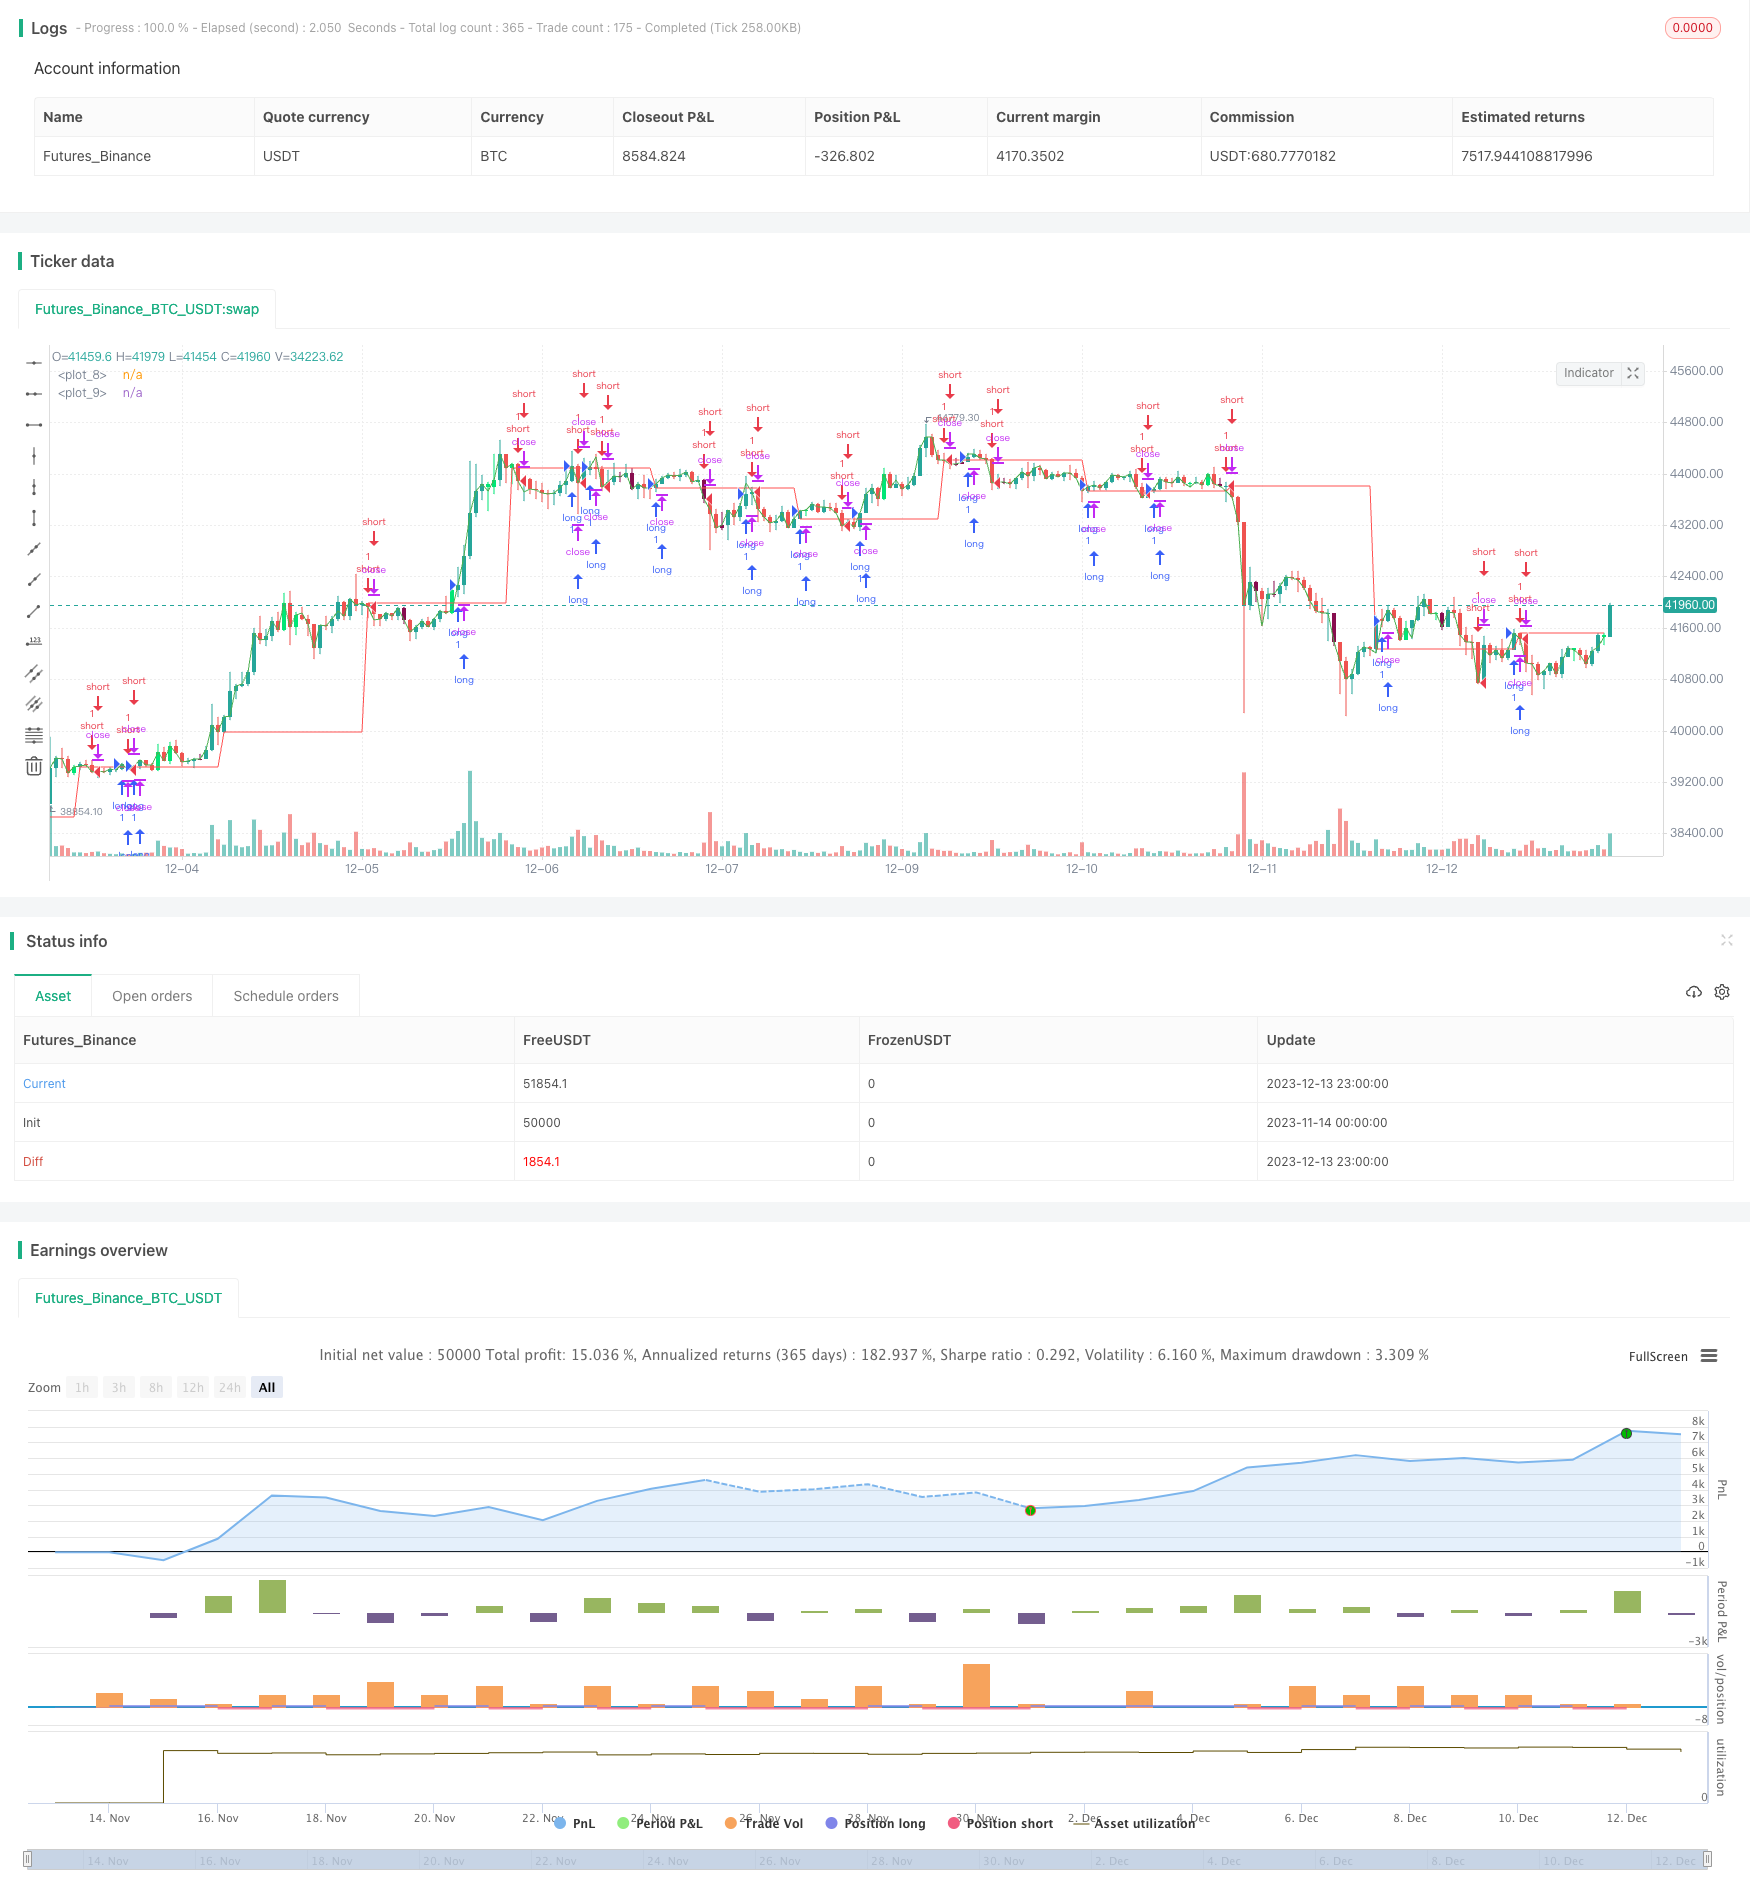
概述
该策略融合了4小时时间周期和日线时间周期上的突破信号,在发出交易信号前会校验K线形态,从而实现更可靠的突破交易策略。
策略原理
双重确认突破策略通过组合使用短周期和长周期的突破信号,在考虑长短周期趋势一致性的前提下,识别更有效的突破点。具体来说,该策略在4小时和日线时间周期上分别计算平均线,当短周期的平均线突破长周期的平均线时产生买入信号,相反的突破产生卖出信号。此外,该策略还会在交易信号发出前,对当前K线的形态进行校验,避免在apsing的K线上打开仓位。
通过上述双重确认和K线过滤的机制,可以有效避免多头止损或空头被套的风险,提高交易信号的质量。
优势分析
双时间周期突破,可提高信号质量。4小时和日线的结合,使信号同时兼具追踪短期趋势和参考长期趋势的优点。
K线形态校验,可避免错信号。在发出信号前校验形态,可过滤一些假突破或者异动突破,避免亏损。
自动优化,灵活方便。该策略的突破参数和周期参数可自定义设置,用户可以根据不同交易品种和市场选择最佳参数组合。
风险分析
双突破策略对暴涨暴跌的行情追随能力较弱。当短周期和长周期同时出现剧烈行情时,该策略有可能错过最优点位。
K线形态验证机制可能会错过部分机会。极端行情下K线常常出现扭曲,校验机制会使策略保守,错过一定机会。
参数不当也会产生错误信号。用户需要根据具体品种选择合适的双突破参数和K线参数,不恰当的参数会使策略效果大打折扣。
针对上述风险,可通过调整参数组合、设置止损止盈条件等方法进行改进和优化。
优化方向
结合波动率指标对突破进行二次验证。例如在 Bollinger Bands 挤压时发出的突破信号,质量会更高。
增加止损止盈模块。适当的止盈止损设置可以锁定利润并主动规避风险。
优化双突破参数。参数可参考品种的日内波动率、日线波动率等特征进行调整。
优化 K 线校验参数。不同周期和参数组合的 K 线校验,可以获得更稳定的结果。
总结
双重确认突破策略通过融合双时间周期和K线形态验证的机制,实现了资金效率和信号质量的有效平衡,是一个值得推荐的短线突破策略。使用者可根据自身需要,调整相关参数以获得更好的效果。
/*backtest
start: 2023-11-14 00:00:00
end: 2023-12-14 00:00:00
period: 1h
basePeriod: 15m
exchanges: [{"eid":"Futures_Binance","currency":"BTC_USDT"}]
*/

//@version=2
strategy("breakout ", overlay=true)
tim=input('1440')
sim=input('370')

out1 = request.security(syminfo.tickerid, tim, open)
out2 = request.security(syminfo.tickerid, sim, close)
plot(out1,color=red)
plot(out2,color=green)

length = input(20, title="BB Length")
mult = input(2.0,title="BB MultFactor")
lengthKC=input(20, title="KC Length")
multKC = input(1.5, title="KC MultFactor")

useTrueRange = input(true, title="Use TrueRange (KC)", type=bool)

// Calculate BB
source = close
basis = sma(source, length)
dev = multKC * stdev(source, length)
upperBB = basis + dev
lowerBB = basis - dev

// Calculate KC
ma = sma(source, lengthKC)
range1 = useTrueRange ? tr : (high - low)
rangema = sma(range1, lengthKC)
upperKC = ma + rangema * multKC
lowerKC = ma - rangema * multKC

sqzOn  = (lowerBB > lowerKC) and (upperBB < upperKC)
sqzOff = (lowerBB < lowerKC) and (upperBB > upperKC)
noSqz  = (sqzOn == false) and (sqzOff == false)

val = linreg(source  -  avg(avg(highest(high, lengthKC), lowest(low, lengthKC)),sma(close,lengthKC)),lengthKC,0)

bcolor = iff( val > 0,iff( val > nz(val[1]), lime, green),iff( val < nz(val[1]), red, maroon))
scolor = noSqz ? blue : sqzOn ? black : gray
//plot(val, color=bcolor, style=histogram, linewidth=4)
//plot(0, color=scolor, style=cross, linewidth=2)

// this section based on Almost Zero Lag EMA [LazyBear]
// Fast MA - type, length
matype   = input(defval="HullMA", title="Fast MA Type: SMA, EMA, WMA, VWMA, SMMA, DEMA, TEMA, HullMA, TMA, ZEMA ( case sensitive )")
malength = input(defval=20, title="Moving Average Length", minval=1)
src      = input(close,title="Moving average Source")

// Returns MA input selection variant, default to SMA if blank or typo.
variant(type, src, len) =>
    v1 = sma(src, len)                                                  // Simple
    v2 = ema(src, len)                                                  // Exponential
    v3 = wma(src, len)                                                  // Weighted
    v4 = vwma(src, len)                                                 // Volume Weighted
    v5 = na(v5[1]) ? sma(src, len) : (v5[1] * (len - 1) + src) / len    // Smoothed
    v6 = 2 * v2 - ema(v2, len)                                          // Double Exponential
    v7 = 3 * (v2 - ema(v2, len)) + ema(ema(v2, len), len)               // Triple Exponential
    v8 = wma(2 * wma(src, len / 2) - wma(src, len), round(sqrt(len)))   // Hull
    ema1 = ema(src, len)
    ema2 = ema(ema1, len)
    v10 = ema1+(ema1-ema2)                                              // Zero Lag Exponential
    v11 = sma(sma(src,len),len)                                         // Trianglular
    // return variant, defaults to SMA if input invalid.
    type=="EMA"?v2 : type=="WMA"?v3 : type=="VWMA"?v4 : type=="SMMA"?v5 : type=="DEMA"?v6 : type=="TEMA"?v7 : type=="HullMA"?v8 : type=="ZEMA"?v10 : type=="TMA"?v11 : v1

// Calculate selected MA and get direction of trend from it.
zlema= variant(matype,src,malength)
col =  zlema > zlema[1] ? green : red
up = zlema > zlema[1] ? 1 : 0
down = zlema < zlema[1] ? 1 : 0
//plot(zlema,color=col, style=line, linewidth=4, transp=0)


// Find all Fractals.
// This section based on [RS]Fractal Levels  by RicardoSantos
hidefractals = input(false)
hidelevels = input(false)
topfractal = high[2] > high[1] and high[2] > high and high[2] > high[3] and high[2] > high[4]
botfractal = low[2] < low[1] and low[2] < low and low[2] < low[3] and low[2] < low[4]

//plotshape(hidefractals ? na : topfractal, color=green, transp=0, style=shape.triangleup, location=location.abovebar, offset=-2, size=size.tiny)
//plotshape(hidefractals ? na : botfractal, color=red, transp=0, style=shape.triangledown, location=location.belowbar, offset=-2, size=size.tiny)

topfractals = topfractal ? high[2] : topfractals[1]
botfractals = botfractal ? low[2] : botfractals[1]

topfcolor = topfractals != topfractals[1] ? na : green
botfcolor = botfractals != botfractals[1] ? na : red

//plot(hidelevels ? na : topfractals, color=topfcolor, transp=0, linewidth=2)
//plot(hidelevels ? na : botfractals, color=botfcolor, transp=0, linewidth=2)

//
// This section based on Candlestick Patterns With EMA by rmwaddelljr
//
ufb  = input(false, title="Use Fractal S/R Cross Patterns")
udc  = input(true, title="Use Dark Cloud Cover Patterns" )
upl  = input(true, title="Use Piecing Line Patterns" )
ube  = input(true, title="Use Engulfing Candle Patterns" )
ubh  = input(true, title="Use Harami Candle Patterns" )
upb  = input(true,  title="Use Defined PinBar Patterns")
pctP = input(66, minval=1, maxval=99, title="Directional PBars, % of Range of Candle the Long Wick Has To Be")
// This section based on CM_Price-Action-Bars by ChrisMoody
// Change the pin bar calculation, so can be used for market direction.
urpb= input(false, title="Use CM Price Action Reversal Pin Bars")
usb = input(false, title="Use CM Price Action Shaved Bars")
uob = input(false, title="Use CM Price Action Outside Bars")
uib = input(false, title="Use CM Price Action Inside Bars")
pctRP = input(72, minval=1, maxval=99, title="CM Reversal PBars, % of Range of Candle the Long Wick Has To Be")
pctS = input(5, minval=1, maxval=99, title="CM Shaved Bars, % of Range it Has To Close On The Lows or Highs")
pblb =input(6,minval=1,title="CM Reversal Pin Bar Lookback Length")
//
stnd = input(true, title="Alert Only Patterns Following Trend")
//
// Get MACD for Alert Filtering
umacd  = input(true,title="Alert Only Patterns Confirmed by MACD")
fastMA = input(title="MACD Fast MA Length",  defval = 12, minval = 2)
slowMA = input(title="MACD Slow MA Length",  defval = 26, minval = 7)
signal = input(title="MACD Signal Length",defval=9,minval=1)

//
sgb = input(false, title="Check Box To Turn Bars Gray")
salc = input(true, title="Show Alert condition Dot")
//
[currMacd,_,_] = macd(close[0], fastMA, slowMA, signal)
[prevMacd,_,_] = macd(close[1], fastMA, slowMA, signal)
plotColor = currMacd > 0 ? currMacd > prevMacd ? green : red : currMacd < prevMacd ? red : green

// Show alert on this bar?
sbarUp = (not umacd or plotColor == green) and (not stnd or up)
sbarDn = (not umacd or plotColor == red) and (not stnd or down)

//PBar Percentages
pctCp = pctP * .01

//Shaved Bars Percentages
pctCs = pctS * .01
pctSPO = pctCs
//ma50 = sma(close,50)

range = high - low

///Reversal PinBars
pctCRp = pctRP * .01
pctCRPO = 1 - pctCRp
//
//pBarRUp= upb and open<close and open > high - (range * pctCRPO) and close > high - (range * pctCRPO) and low <= lowest(pblb) ? 1 : 0
//pBarRDn = upb and open>close and open < high - (range *  pctCRp) and close < high-(range * pctCRp) and high >= highest(pblb) ? 1 : 0
pBarRUp = urpb and  open > high - (range * pctCRPO) and close > high - (range * pctCRPO) and low <= lowest(pblb) ? 1 : 0
pBarRDn = urpb and  open < high - (range *  pctCRp) and close < high-(range * pctCRp) and high >= highest(pblb) ? 1 : 0

//Shaved Bars filter to the MA50 line
sBarUp   = usb and (close >= (high - (range * pctCs))) // and close>ma50
sBarDown = usb and (close <= (low + (range * pctCs)))  // and close<ma50

//Inside Bars
insideBarUp = uib and (high < high[1] and low > low[1])
insideBarDn = uib and (high < high[1] and low > low[1])
outsideBarUp= uob and (high > high[1] and low < low[1])
outsideBarDn= uob and (high > high[1] and low < low[1])

// PinBars representing possible change in trend direction
barcolor(pBarRUp ? green : na)
barcolor(pBarRDn ? red : na)

//Shaved Bars
barcolor(sBarDown ? fuchsia : na)
barcolor(sBarUp   ? aqua : na)

//Inside and Outside Bars
barcolor((insideBarUp or insideBarDn)? yellow : na )
barcolor((outsideBarUp or outsideBarDn) ? orange : na )


//Long shadow PinBars supporting market direction
///PinBars Long Upper Shadow represent selling pressure
pBarDn = upb and open < high - (range * pctCp) and close < high - (range * pctCp)
//plotshape(pBarDn and (not pBarRUp and not pBarRDn), title= "Bearish Pin Bar",  color=red, style=shape.arrowdown, text="Bearish\nPinBar")
///PinBars with Long Lower Shadow represent buying pressure
pBarUp = upb and open > low + (range * pctCp) and close > low + (range * pctCp)
//plotshape(pBarUp and (not pBarRUp and not pBarRDn),  title= "Bullish Pin Bar", location=location.belowbar, color=green, style=shape.arrowup, text="Bullish\nPinBar")

dcc = udc and (close[1]>open[1] and abs(close[1]-open[1])/range[1]>=0.7 and close<open and abs(close-open)/range>=0.7 and open>=close[1] and close>open[1] and close<((open[1]+close[1])/2))
//plotshape(dcc, title="Dark Cloud Cover",text='DarkCloud\nCover',color=red, style=shape.arrowdown,location=location.abovebar)
ts = timestamp(2021,8,1,8,18)
pln= upl and (close[1]<open[1] and abs(open[1]-close[1])/range[1]>=0.7 and close>open and abs(close-open)/range>=0.7 and open<=close[1] and close<open[1] and close>((open[1]+close[1])/2))
//plotshape(pln, title="Piercieng Line",text="Piercing\nLine",color=green, style=shape.arrowup,location=location.belowbar)

beh = ubh and (close[1] > open[1] and open > close and open <= close[1] and low >= open[1] and open - close < close[1] - open[1] and (high < high[1] and low > low[1]))
//plotshape(beh and not dcc, title= "Bearish Harami",  color=red, style=shape.arrowdown, text="Bear\nHarami")

blh = ubh and (open[1] > close[1] and close > open and close <= open[1] and high <= open[1] and close - open < open[1] - close[1] and (high < high[1] and low > low[1]))
//plotshape(blh and not pln,  title= "Bullish Harami", location=location.belowbar, color=green, style=shape.arrowup, text="Bull\nHarami")

bee = ube and (close[1] > open[1] and close < open and close<=low[1] and open>= close[1])
//plotshape(bee,  title= "Bearish Engulfing", color=red, style=shape.arrowdown, text="Bearish\nEngulf")

ble = ube and (close[1] < open[1] and close > open and close >= high[1] and open<=close[1])
//plotshape(ble, title= "Bullish Engulfing", location=location.belowbar, color=green, style=shape.arrowup, text="Bullish\nEngulf")

blfr = ufb and crossover(close,topfractals)
//plotshape(blfr and not ble and not blh and not sBarUp, title= "Bullish Fractal Cross", location=location.belowbar, color=green, style=shape.arrowup, text="Fractal\nCross")
befr = ufb and crossunder(close,botfractals)
//plotshape(befr and not bee and not beh and not sBarDown,  title= "Bearish Fractal Cross", color=red, style=shape.arrowdown, text="Fractal\nCross")
//
//
bcolorDn = sbarDn and not(pBarRDn or pBarRUp or sBarDown or insideBarDn or outsideBarDn) and (beh or bee or dcc or befr or pBarDn)
bcolorUp = sbarUp and not(pBarRDn or pBarRUp or sBarUp or insideBarUp or outsideBarUp) and (blh or ble or pln or blfr or pBarUp)
barcolor(bcolorDn ? maroon : na)
barcolor(bcolorUp ? lime : na)
//
barcolor(sgb and close ? gray : na)

bullcnd = pBarUp or pln or blh or ble or blfr
bearcnd = pBarDn or dcc or beh or bee or befr
if(true )
    longCondition = crossover(out2,out1)
    if(longCondition or close > out1 and bullcnd and strategy.position_size == 0)
        strategy.entry("long", strategy.long)

    //if (pBarRUp) // and bullcnd) //and strategy.position_size == 0)
    //    strategy.entry("long", strategy.long)

    shortCondition = crossunder(out2,out1)
    if (shortCondition or close < out1 and bearcnd and strategy.position_size == 0)
        strategy.entry("short", strategy.short)

//
barAlertDn = (sbarDn and (befr or bee or beh or pBarDn  or dcc)) or (sbarDn and (insideBarDn or outsideBarDn or sBarDown)) or pBarRDn
barAlertUp = (sbarUp and (blfr or ble or blh or pBarUp  or pln)) or (sbarUp and (insideBarUp or outsideBarUp or sBarUp))  or pBarRUp
barAlert = barAlertDn or barAlertUp
alertcondition(barAlert,title="CDLTRD Alert", message="CDLTRD Bar Alert")
// show only when alert condition is met and bar closed.
//plotshape(salc and barAlert[1],title= "Alert Indicator Closed", location=location.bottom, color=barAlertDn[1]?red:green, transp=0, style=shape.circle,offset=-1)
//EOF


    //if (pBarRDn) //and bearcnd//and strategy.position_size == 0)
     //   strategy.entry("short", strategy.short)

//strategy.close("long", when = exit)
//strategy.close("short", when = exit2)


//exit3 = sqzOn and sqzOn[1] and sqzOn[2] and sqzOn[3] and sqzOn[4] and sqzOn[5] and sqzOn[6]
//strategy.close("long", when = exit3)
//strategy.close("short", when = exit3)


//else
  //  alertcondition(condition = time > t, message = "Time exceeded")