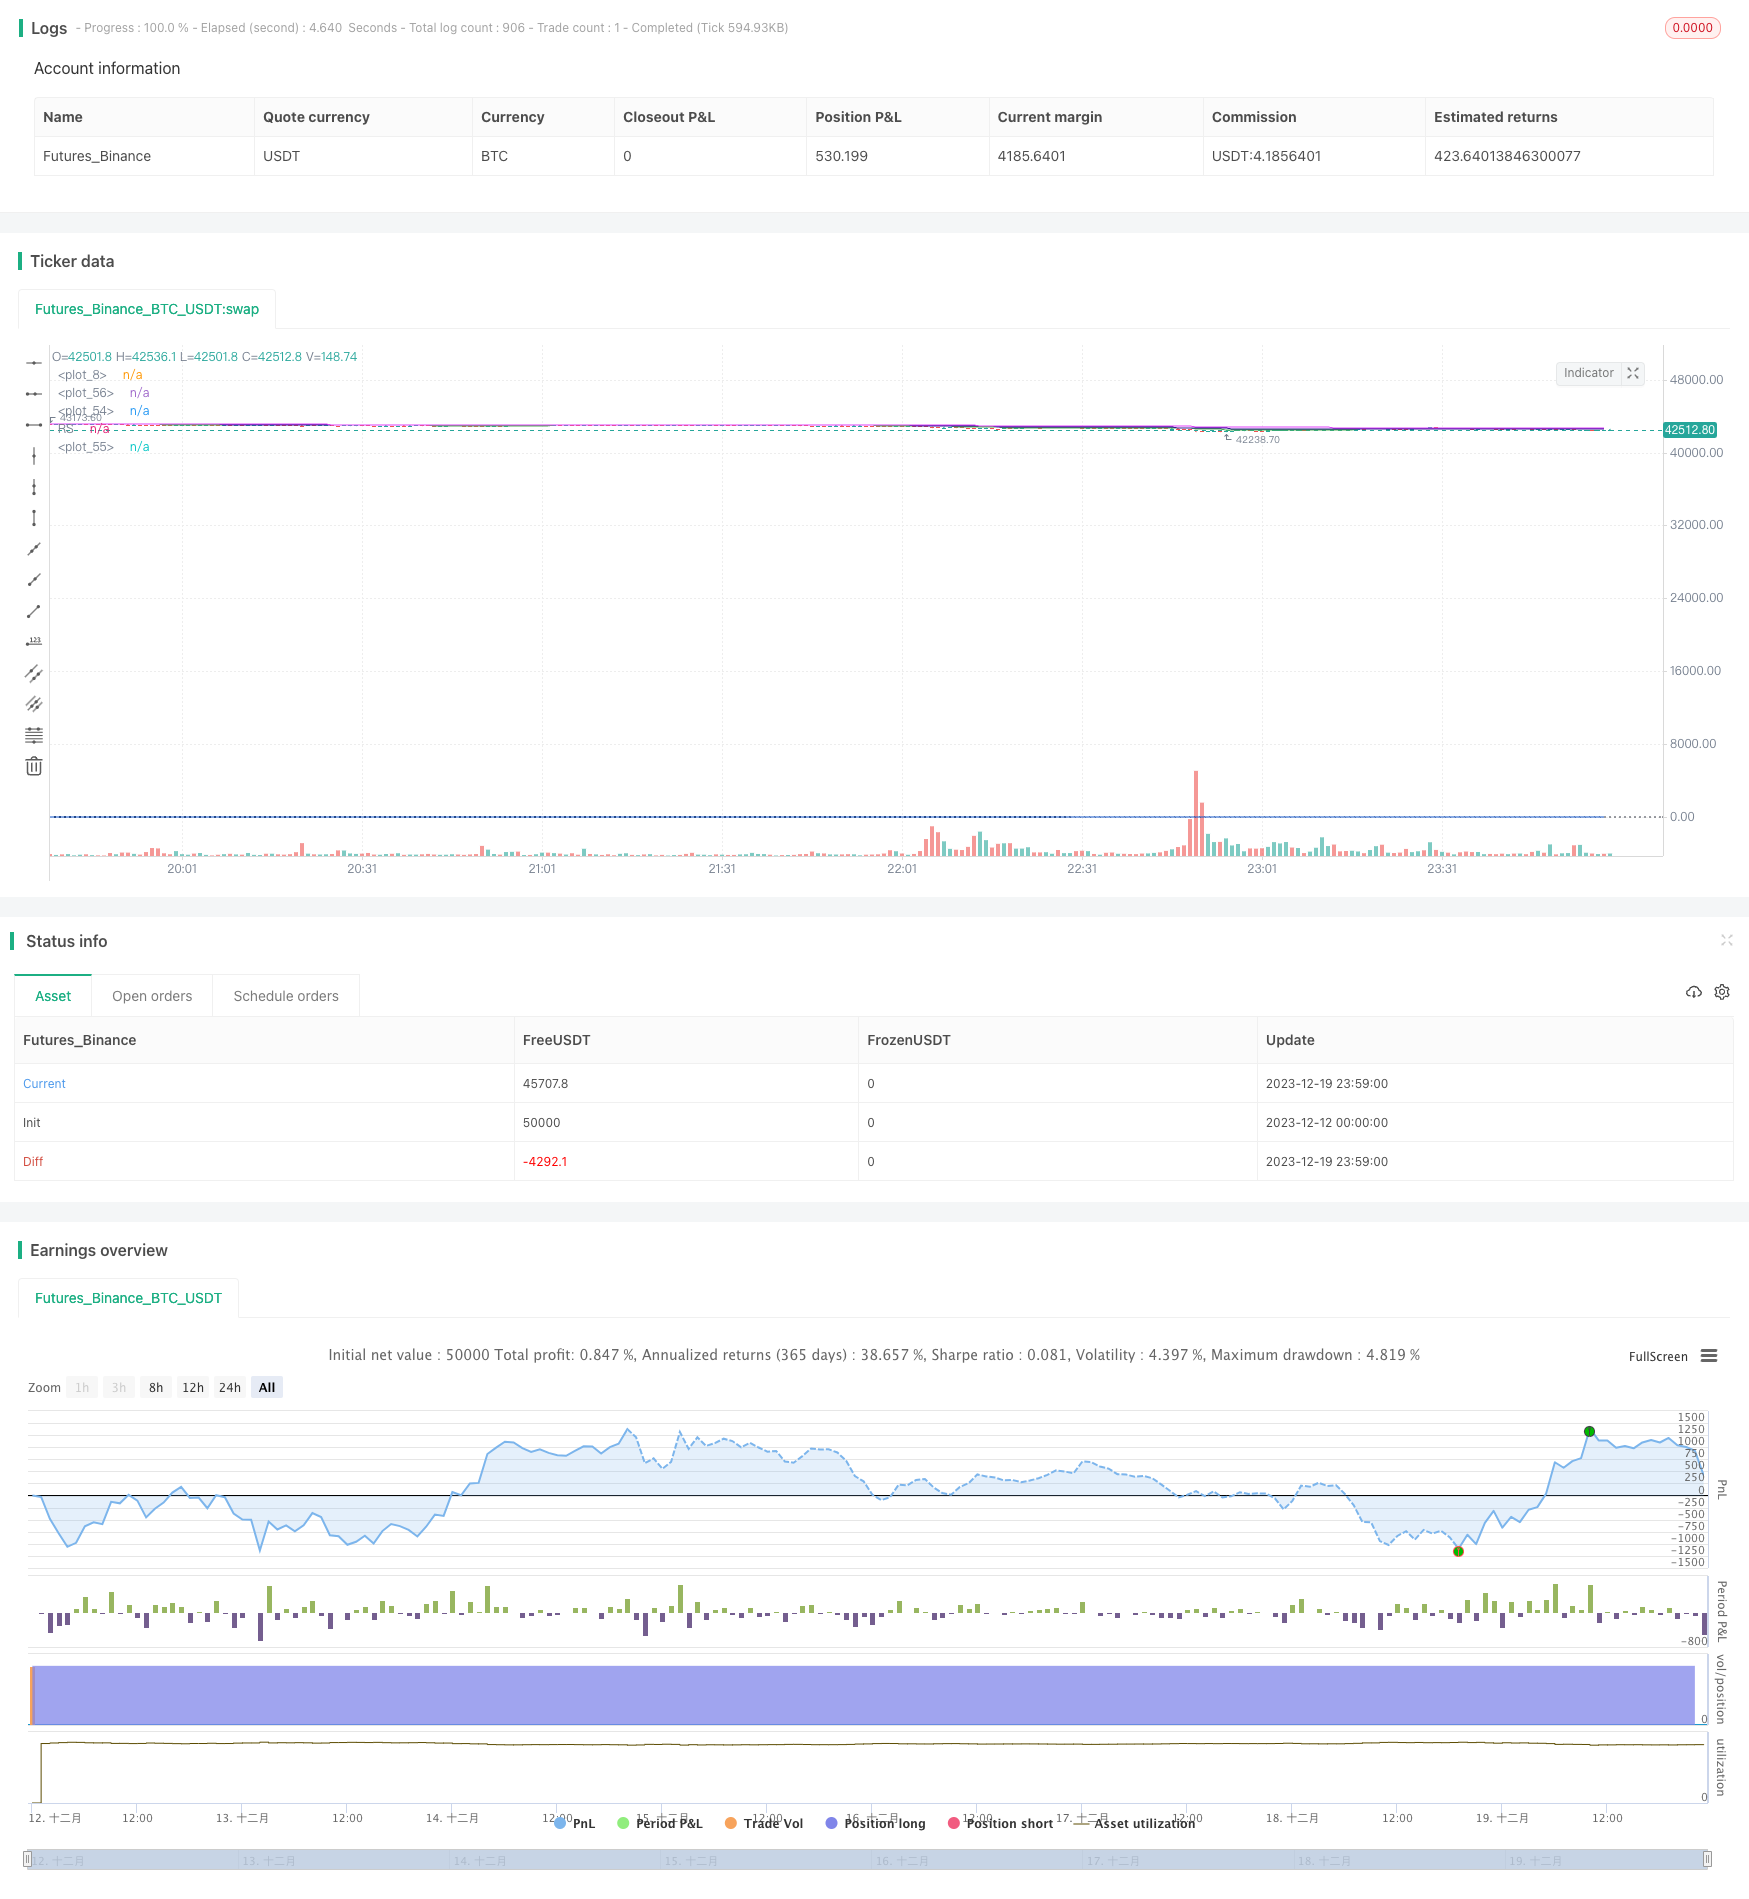
Overview
This strategy utilizes dual moving average system and relative strength index, combined with historical volatility of the stock, to automate buy and sell signals for stock trading. The advantage is that it combines both long-term and short-term techniques to effectively control risks. However, there are still rooms for improvement, for example a stop loss mechanism could be added.
Strategy Logic
The strategy leverages 150-week moving average and 50-day fast moving average to form a dual MA system. It uses 20-day ultra fast MA as well. When price crosses above 150-week MA, it signals an uptrend start. When price crosses below 50-day MA, it signals a downtrend. This allows us to buy on the way up and sell on the way down.
In addition, the strategy also uses annualized highest price based on volatility and relative strength index to determine specific entry points. It only sends buy signals when close price is above the max price calculated from volatility and RSI is positive.
Advantages
The dual MA system can effectively identify trend changes for chasing upside and stopping downside.
The volatility measure and RSI ensures we don’t get whipsawed in sideway markets.
The 20-day fast MA allows quicker stop loss.
Risks
There is some laginess, unable to realize stop loss quickly.
No stop loss is set, could lead to large losses.
Lack of parameter optimization, parameters set rather arbitrary.
To mitigate the risks, stop loss can be added, or use ATR multiples as stop loss percentage. Parameter optimization through more rigorous backtesting can also help.
Enhancement Opportunities
- Add stop loss mechanism
- Find optimal parameters through optimization
- Consider adding other filters like volume
- Could build it into a multifactor model with more factors
Summary
In summary, this is a rather conservative stock investing strategy. Using dual MA system to gauge overall trend, combining with volatility and strength measures to time entry, it can effectively filter out false breakouts. The fast MA also allows quick exits. However, the strategy can be further improved by adding stop loss, parameter optimization etc. Overall it suits long-term stock investors.
/*backtest
start: 2023-12-12 00:00:00
end: 2023-12-20 00:00:00
period: 1m
basePeriod: 1m
exchanges: [{"eid":"Futures_Binance","currency":"BTC_USDT"}]
*/

//@version=4
//Relative Strength
strategy("Stan my man", overlay=true)
comparativeTickerId = input("BTC_USDT:swap",  title="Comparative Symbol")
l = input(50, type=input.integer, minval=1, title="Period")
baseSymbol = security(syminfo.tickerid, timeframe.period, close)
comparativeSymbol = security(comparativeTickerId, timeframe.period, close)
hline(0, color=color.black, linestyle=hline.style_dotted)
res = baseSymbol / baseSymbol[l] /(comparativeSymbol / comparativeSymbol[l]) - 1
plot(res, title="RS", color=#1155CC)

//volume ma
vol1 = sma(volume,20)
// 30 week ma
ema1 = ema(close, 150)
//consolidation
h1 = highest(high[1],365)

fastPeriod = input(title="Fast MA", type=input.integer, defval=50)
slowPeriod = input(title="Slow MA", type=input.integer, defval=150)
fastestperiod = input(title="Fastest MA", type=input.integer, defval=20)

fastEMA = ema(close, fastPeriod)
slowEMA = ema(close, slowPeriod)
fastestEMA = ema(close, fastestperiod)

monitorStrategy = close < close[20]


// trade conditions
buytradecondition1 = close >ema1 and res>0 and volume> 1.5*vol1 and close > h1
buytradecondition2 = close > fastEMA  and volume> 1.5* vol1
selltradecondition1  = close< 0.95 * fastEMA
selltradecondition2  = close< 0.90 * open

if (buytradecondition1)
    strategy.entry("long",strategy.long,alert_message ="Seems ready to Buy")
    alert("Buy Alert Price (" + tostring(close) + ") crossed over Slow moving average",alert.freq_all)

if (buytradecondition2)
    strategy.entry("long",strategy.long,alert_message ="Seems ready to Buy")
    alert("Buy Alert Price (" + tostring(close) + ") crossed over fast moving average",alert.freq_all)

if (selltradecondition1)
    strategy.close("long",alert_message ="Seems ready to Sell")
    alert("Sell Alert Price (" + tostring(close) + ") crossed down fast moving average",alert.freq_all)

if (selltradecondition2)
    strategy.close("long",alert_message ="Seems ready to Sell")
    alert("Sell Alert Price (" + tostring(close) + ") crossed down 10% below open price  ",alert.freq_all)

//alertcondition(buytradecondition1,title ="BuySignal", message ="Price Crossed Slow Moving EMA ")

plot(fastEMA, color=color.navy)
plot(slowEMA, color=color.fuchsia)
plot(fastestEMA, color=color.green)