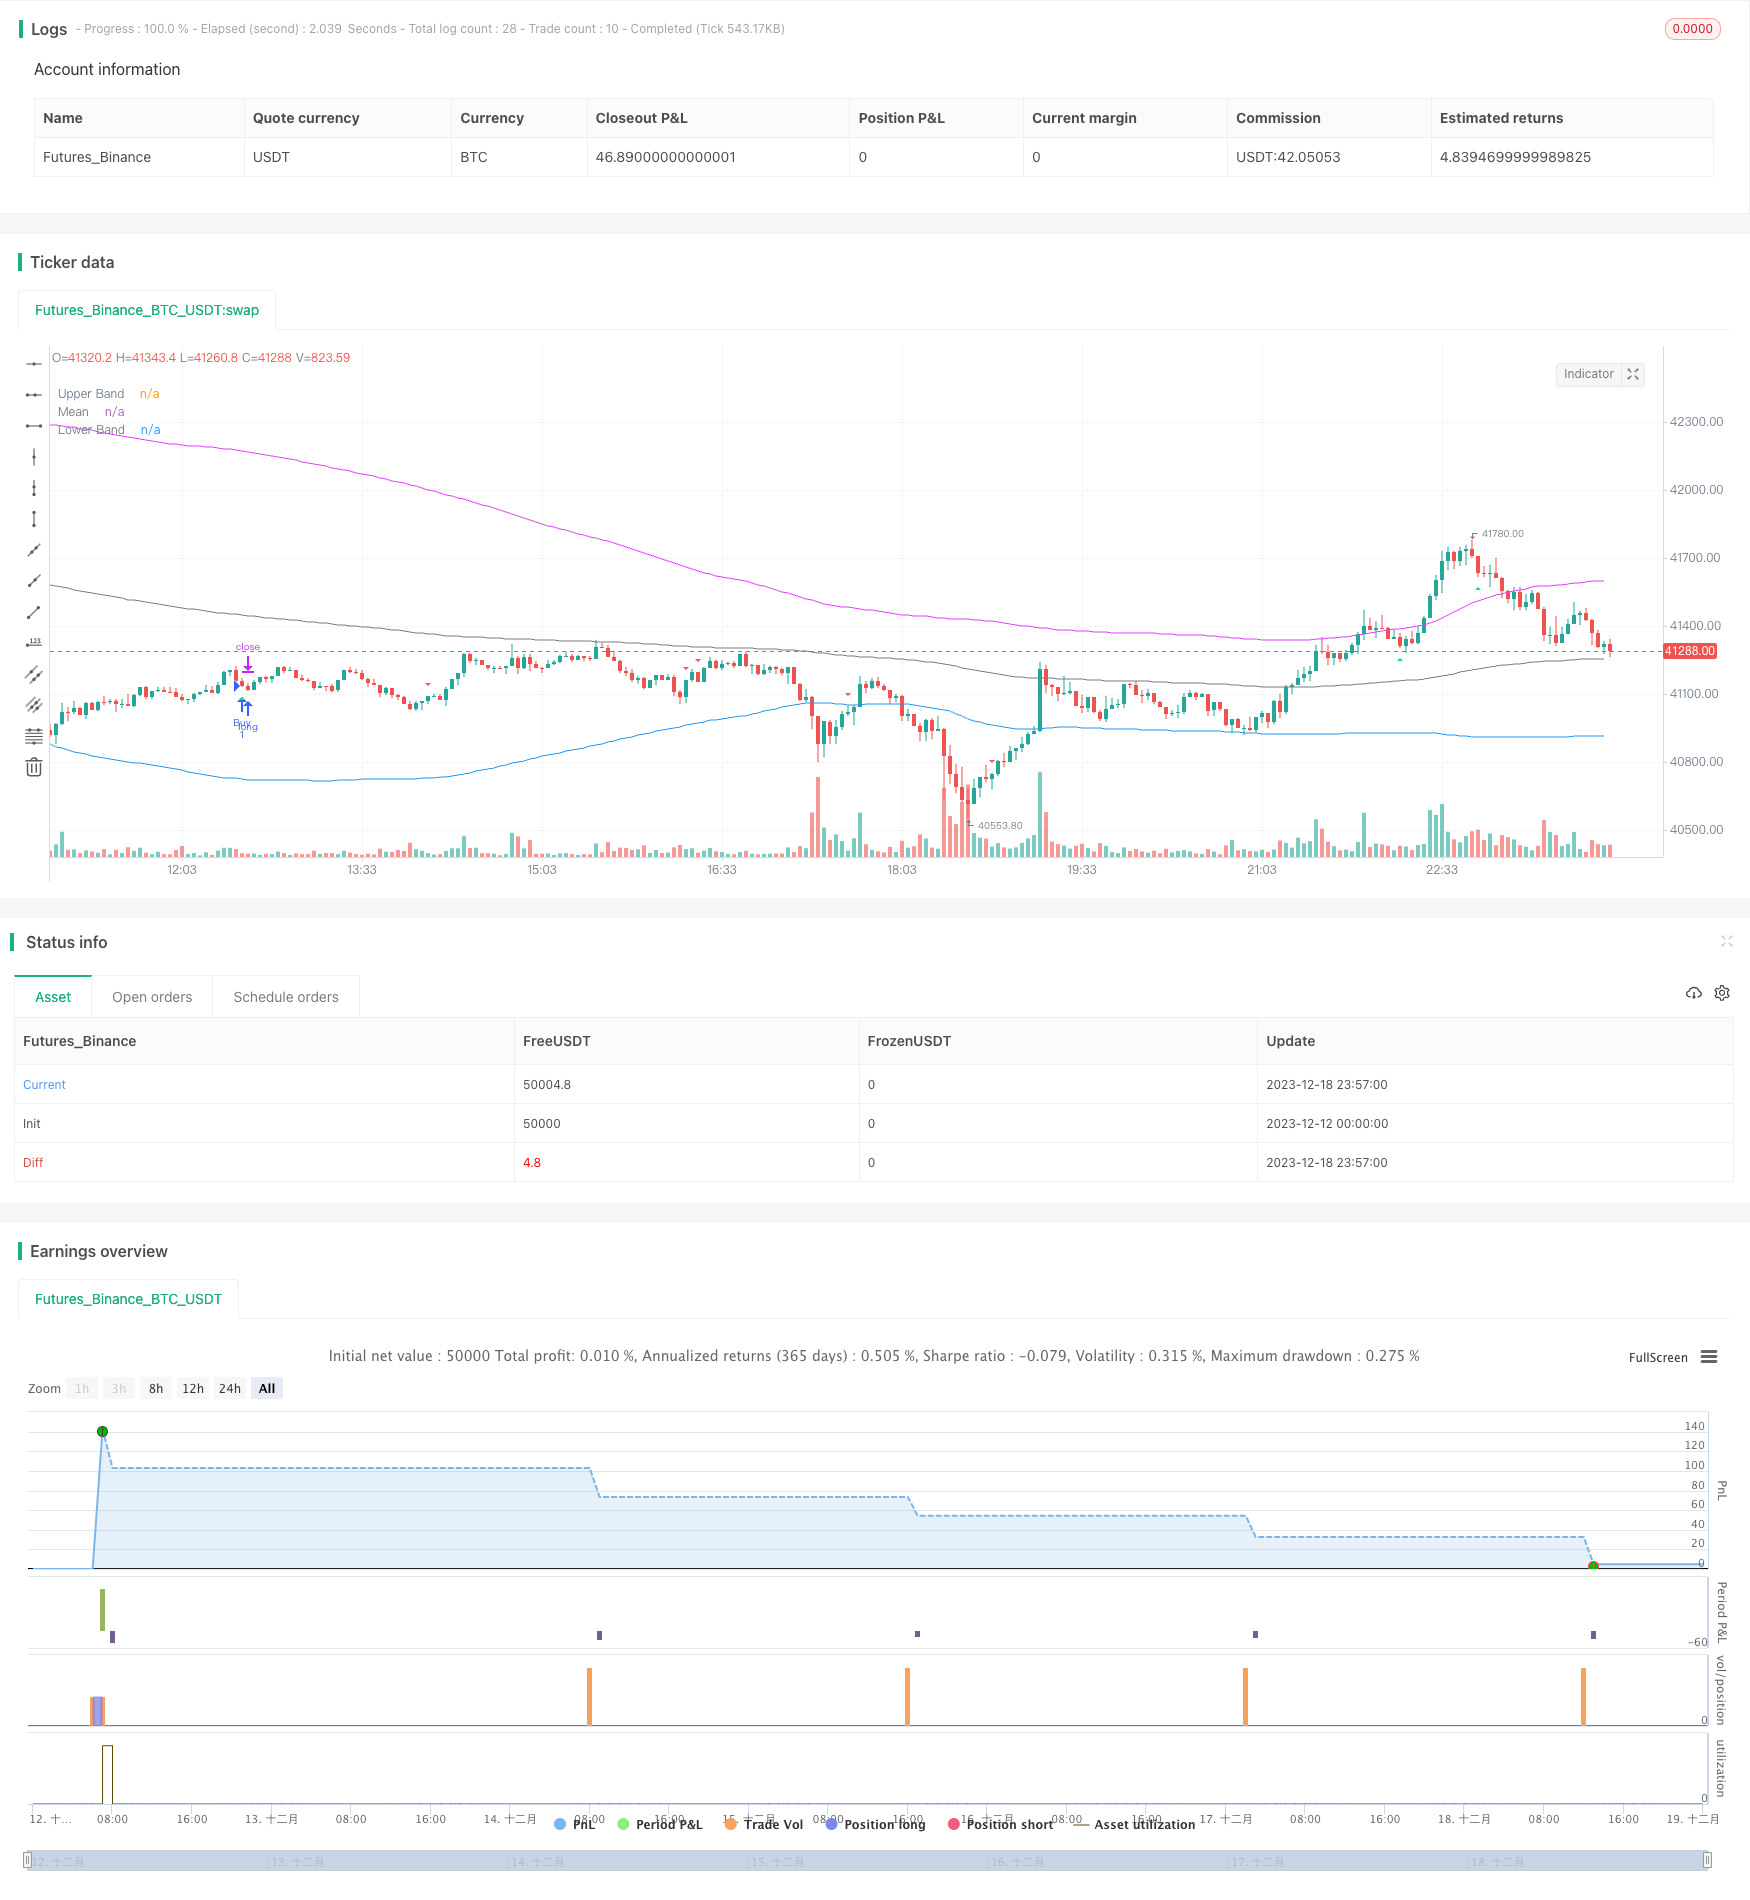
概述
逆转均值突破策略是一种多因子组合的趋势反转策略。它结合了移动平均线、布林带、CCI指标、RSI指标等多种技术指标,旨在捕捉价格从超买超卖区域反转的机会。该策略同时结合了正则散度分析,可检测当前趋势与之前是否一致,从而避免交易假突破。
策略原理
该策略的核心逻辑是,当价格从超买超卖区域反转时,采取适当做空做多。具体来说,策略从四个方面判断反转机会:
CCI指标或动量指标发出金叉死叉信号,判断超买超卖。
RSI指标判断是否处于超买超卖区域。规定RSI高于65为超买区,低于35为超卖区。
利用布林带上下轨,判断价格是否偏离常态区域。当价格重新进入常态区域,可能反转。
检测RSI指标的正则散度,避免追逐假突破。
满足上述条件时,策略会采取反方向入场。并设置止损位,控制风险。
策略优势
该策略最大的优势在于组合多个指标判断反转机会,平均获胜率较高。具体来说,主要有以下几点:
多因子判断,可靠性较高。不会单纯依赖单一指标,减少了误判概率。
反转交易获胜概率大。趋势反转是一种较为可靠的交易方式。
检测散度,避免追逐假突破,减少系统性风险。
止损机制控制风险。可以最大限度避免单笔损失过大。
风险及解决
该策略也存在一些风险,主要集中在以下几点:
反转时间点判断不准。导致止损被触发。可适当扩大止损范围。
布林带参数设置不当,将正常价格当成异常。应该配合市场波动率设置参数。
交易次数可能较多。适当扩大CCI等判断参数范围,减少交易频率。
多空平衡可能差异大。应根据历史数据判断指标参数是否合理。
优化方向
该策略可从以下几个方向进行优化:
利用机器学习算法自动优化指标参数。避免人工经验误差。
增加页岩指标、幅度指标等判断超买超卖强度。
增加交易量指标判断反转可靠性。例如成交量,持仓 Daten 等。
结合区块链数据判断市场情绪面。提高策略的适应性。
引入自适应止损机制。根据市场波动率变化调整止损位。
总结
逆转均值突破策略综合运用多种指标判断反转机会。在控制风险的前提下,其获胜概率较大。该策略有很强的实用性,也有进一步优化的空间。如果参数设置得当,应能获得较为理想的效果。
/*backtest
start: 2023-12-12 00:00:00
end: 2023-12-19 00:00:00
period: 3m
basePeriod: 1m
exchanges: [{"eid":"Futures_Binance","currency":"BTC_USDT"}]
*/

//@version=5
strategy(title='BroTheJo Strategy', shorttitle='BTJ INV', overlay=true)

// Input settings
stopLossInPips = input.int(10, minval=0, title='Stop Loss (in Pips)')
ccimomCross = input.string('CCI', 'Entry Signal Source', options=['CCI', 'Momentum'])
ccimomLength = input.int(10, minval=1, title='CCI/Momentum Length')
useDivergence = input.bool(false, title='Find Regular Bullish/Bearish Divergence')
rsiOverbought = input.int(65, minval=1, title='RSI Overbought Level')
rsiOversold = input.int(35, minval=1, title='RSI Oversold Level')
rsiLength = input.int(14, minval=1, title='RSI Length')
plotMeanReversion = input.bool(true, 'Plot Mean Reversion Bands on the chart')
emaPeriod = input(200, title='Lookback Period (EMA)')
bandMultiplier = input.float(1.6, title='Outer Bands Multiplier')

// CCI and Momentum calculation
momLength = ccimomCross == 'Momentum' ? ccimomLength : 10
mom = close - close[momLength]
cci = ta.cci(close, ccimomLength)
ccimomCrossUp = ccimomCross == 'Momentum' ? ta.cross(mom, 0) : ta.cross(cci, 0)
ccimomCrossDown = ccimomCross == 'Momentum' ? ta.cross(0, mom) : ta.cross(0, cci)

// RSI calculation
src = close
up = ta.rma(math.max(ta.change(src), 0), rsiLength)
down = ta.rma(-math.min(ta.change(src), 0), rsiLength)
rsi = down == 0 ? 100 : up == 0 ? 0 : 100 - 100 / (1 + up / down)
oversoldAgo = rsi[0] <= rsiOversold or rsi[1] <= rsiOversold or rsi[2] <= rsiOversold or rsi[3] <= rsiOversold
overboughtAgo = rsi[0] >= rsiOverbought or rsi[1] >= rsiOverbought or rsi[2] >= rsiOverbought or rsi[3] >= rsiOverbought

// Regular Divergence Conditions
bullishDivergenceCondition = rsi[0] > rsi[1] and rsi[1] < rsi[2]
bearishDivergenceCondition = rsi[0] < rsi[1] and rsi[1] > rsi[2]

// Mean Reversion Indicator
meanReversion = plotMeanReversion ? ta.ema(close, emaPeriod) : na
stdDev = plotMeanReversion ? ta.stdev(close, emaPeriod) : na
upperBand = plotMeanReversion ? meanReversion + stdDev * bandMultiplier : na
lowerBand = plotMeanReversion ? meanReversion - stdDev * bandMultiplier : na

// Entry Conditions
prevHigh = ta.highest(high, 1)
prevLow = ta.lowest(low, 1)
shortEntryCondition = ccimomCrossUp and oversoldAgo and (not useDivergence or bullishDivergenceCondition) and (prevHigh >= meanReversion) and (prevLow >= meanReversion)
longEntryCondition = ccimomCrossDown and overboughtAgo and (not useDivergence or bearishDivergenceCondition) and (prevHigh <= meanReversion) and (prevLow <= meanReversion)

// Plotting
oldShortEntryCondition = ccimomCrossUp and oversoldAgo and (not useDivergence or bullishDivergenceCondition)
oldLongEntryCondition = ccimomCrossDown and overboughtAgo and (not useDivergence or bearishDivergenceCondition)
plotshape(oldLongEntryCondition, title='BUY', style=shape.triangleup, text='B', location=location.belowbar, color=color.new(color.lime, 0), textcolor=color.new(color.white, 0), size=size.tiny)
plotshape(oldShortEntryCondition, title='SELL', style=shape.triangledown, text='S', location=location.abovebar, color=color.new(color.red, 0), textcolor=color.new(color.white, 0), size=size.tiny)

// Strategy logic
if (longEntryCondition)
    stopLoss = close - stopLossInPips
    strategy.entry("Buy", strategy.long)
    strategy.exit("exit", "Buy", stop=stopLoss)
if (shortEntryCondition)
    stopLoss = close + stopLossInPips
    strategy.entry("Sell", strategy.short)
    strategy.exit("exit", "Sell", stop=stopLoss)

// Close all open positions when outside of bands
closeAll = (high >= upperBand) or (low <= lowerBand)

if (closeAll)
    strategy.close_all("Take Profit/Cut Loss")

// Plotting
plot(upperBand, title='Upper Band', color=color.fuchsia, linewidth=1)
plot(meanReversion, title='Mean', color=color.gray, linewidth=1)
plot(lowerBand, title='Lower Band', color=color.blue, linewidth=1)