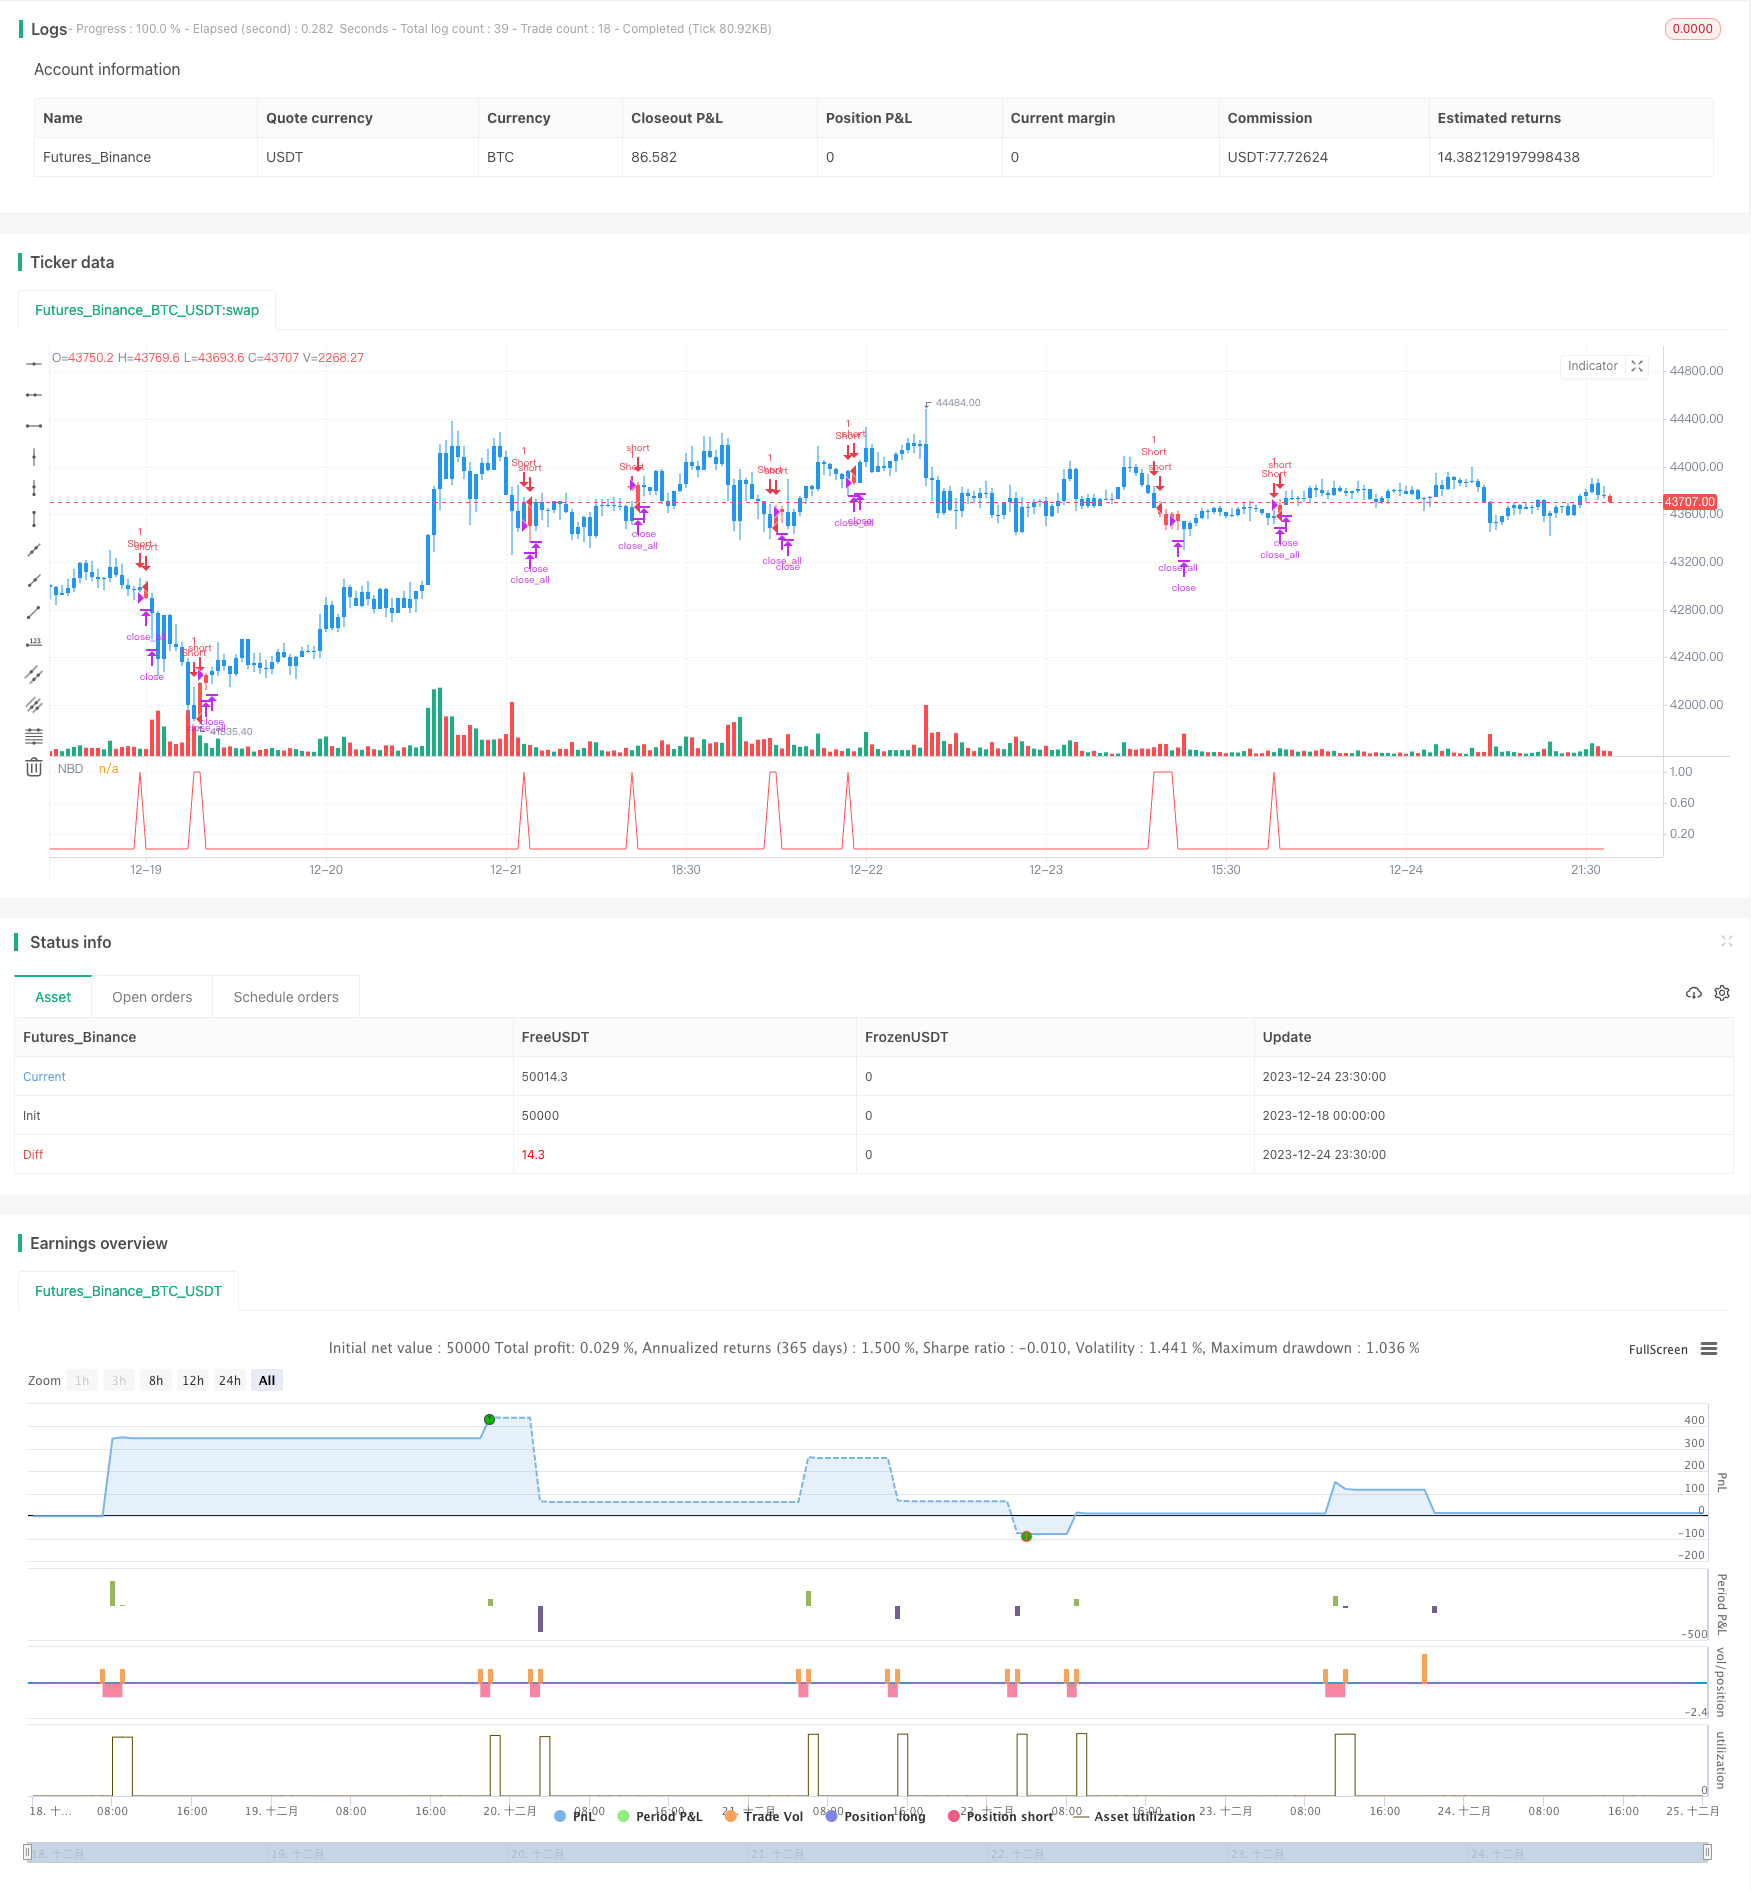
N Bar Close Below Open Short Strategy
Author: ChaoZhang, Date: 2023-12-26 10:29:12Tags:

Overview
This strategy identifies short-term trend based on technical indictors and takes short position when detecting N consecutive bar closing below opening price. It is an intraday trading strategy.
Strategy Logic
The strategy uses a nCounter variable to count the number of consecutive bar with close below open. When close price is lower than open price, nCounter increments by 1. When close price is higher than open price, nCounter resets to 0. When nCounter reaches the input parameter nLength, it indicates N consecutive bars closing below opening price and the signal C2 becomes 1.
Upon signal, if there is no position, a short order will be sent. If already in short position, keep holding the position. After opening position, posprice records the entry price. Take profit and stop loss are set based on entry price: if price reaches take profit point (entry + input takeprofit), close position and reset; if price reaches stop loss point (entry - input stoploss), close position and reset.
Advantage Analysis
The main advantages of this strategy:
- Simple and clear logic, easy to understand and implement.
- Customizable parameters, flexible across different market conditions.
- Equipped with take profit and stop loss, effectively control risks.
Risk Analysis
The main risks of this strategy:
- N bar close below open cannot fully confirm trend reversal, false signal may occur. Fine tune N value or add other filters for verification.
- Improper stop loss or take profit setting may lead to premature exit or amplified losses. Reasonable parameters should be set according to market volatility.
Optimization Directions
The strategy can be improved from the following aspects:
Add trend filter to avoid misjudging short-term corrections in sideways market. For example, combine with moving average to determine overall trend.
Add volume confirmation. Surging volume can better confirm trend reversal.
Optimize take profit and stop loss, such as using trailing stop loss, percentage stop loss to make more intelligent exits.
Utilize machine learning models to dynamically adjust parameters like nLength according to real-time market changes.
Conclusion
This strategy identifies short-term trend simply based on the relationship between close price and open price. Trading signals are generated when detecting N consecutive bars closing below opening price. The strategy is intuitive, customizable and equipped with effective risk management. However, certain level of false signals exist. It is recommended to combine additional filters for optimization. With parameter tuning, risk management and model enhancement, this can be a very practical tool for short-term trading.
/*backtest
start: 2023-12-18 00:00:00
end: 2023-12-25 00:00:00
period: 30m
basePeriod: 15m
exchanges: [{"eid":"Futures_Binance","currency":"BTC_USDT"}]
*/

//@version=4
////////////////////////////////////////////////////////////
//  Copyright by HPotter v1.0 05/02/2020
// Evaluates for n number of consecutive lower closes. Returns a value
// of 1 when the condition is true or 0 when false.
//
// WARNING:
// - For purpose educate only
// - This script to change bars colors.
////////////////////////////////////////////////////////////
strategy(title="N Bars Down", shorttitle="NBD Backtest", overlay = false)
nLength = input(4, minval=1)
input_takeprofit = input(20, title="Take Profit pip", step=0.01)
input_stoploss = input(10, title="Stop Loss pip", step=0.01)
nCounter = 0
nCounter := iff(close[1] <= open[1], nz(nCounter[1],0)+1,
             iff(close[1] > open[1], 0, nCounter))
C2 = iff(nCounter >= nLength, 1, 0)
posprice = 0.0
pos = 0
barcolor(nz(pos[1], 0) == -1 ? color.red: nz(pos[1], 0) == 1 ? color.green : color.blue )
posprice := iff(C2== 1, close, nz(posprice[1], 0))
pos := iff(posprice > 0, -1, 0)
if (pos == 0)
    strategy.close_all()
if (pos == -1)
    strategy.entry("Short", strategy.short)
posprice := iff(low <= posprice - input_takeprofit and posprice > 0, 0 ,  nz(posprice, 0))
posprice := iff(high >= posprice + input_stoploss and posprice > 0, 0 ,  nz(posprice, 0))
plot(C2, title='NBD', color=color.red)
- Moving Average Crossover Strategy
- Trend Tracking Strategy Based on Dynamic Pivot Bands
- Bollinger Bands Momentum Trend Following Strategy
- Dynamic Buying Selling Volume Breakout Strategy
- Supertrend MACD Quantitative Strategy
- 4 EMA Trend Strategy
- Bitcoin Trading Strategy Based on Quantitative Indicators
- Last N Candle Reverse Logic Strategy
- Trend Tracking Breakout Strategy
- Simple Buy Low Sell High Strategy
- Statistical Volatility Backtest Strategy Based on Extreme Value Method
- Relative Strength Index Stop Loss Strategy
- Dual Channel Donchian Breakout Strategy
- A Multi-Period Trading Strategy Based on Moving Averages
- Pivot Reversal Upgraded Long Only - A Dual Momentum Strategy
- Turtle Trading Strategy
- Dual Moving Average Tracking Strategy
- Dual Moving Average Momentum Squeeze Strategy
- SMA Crossover Trading Strategy
- Based on Weighted Moving Average Strategy