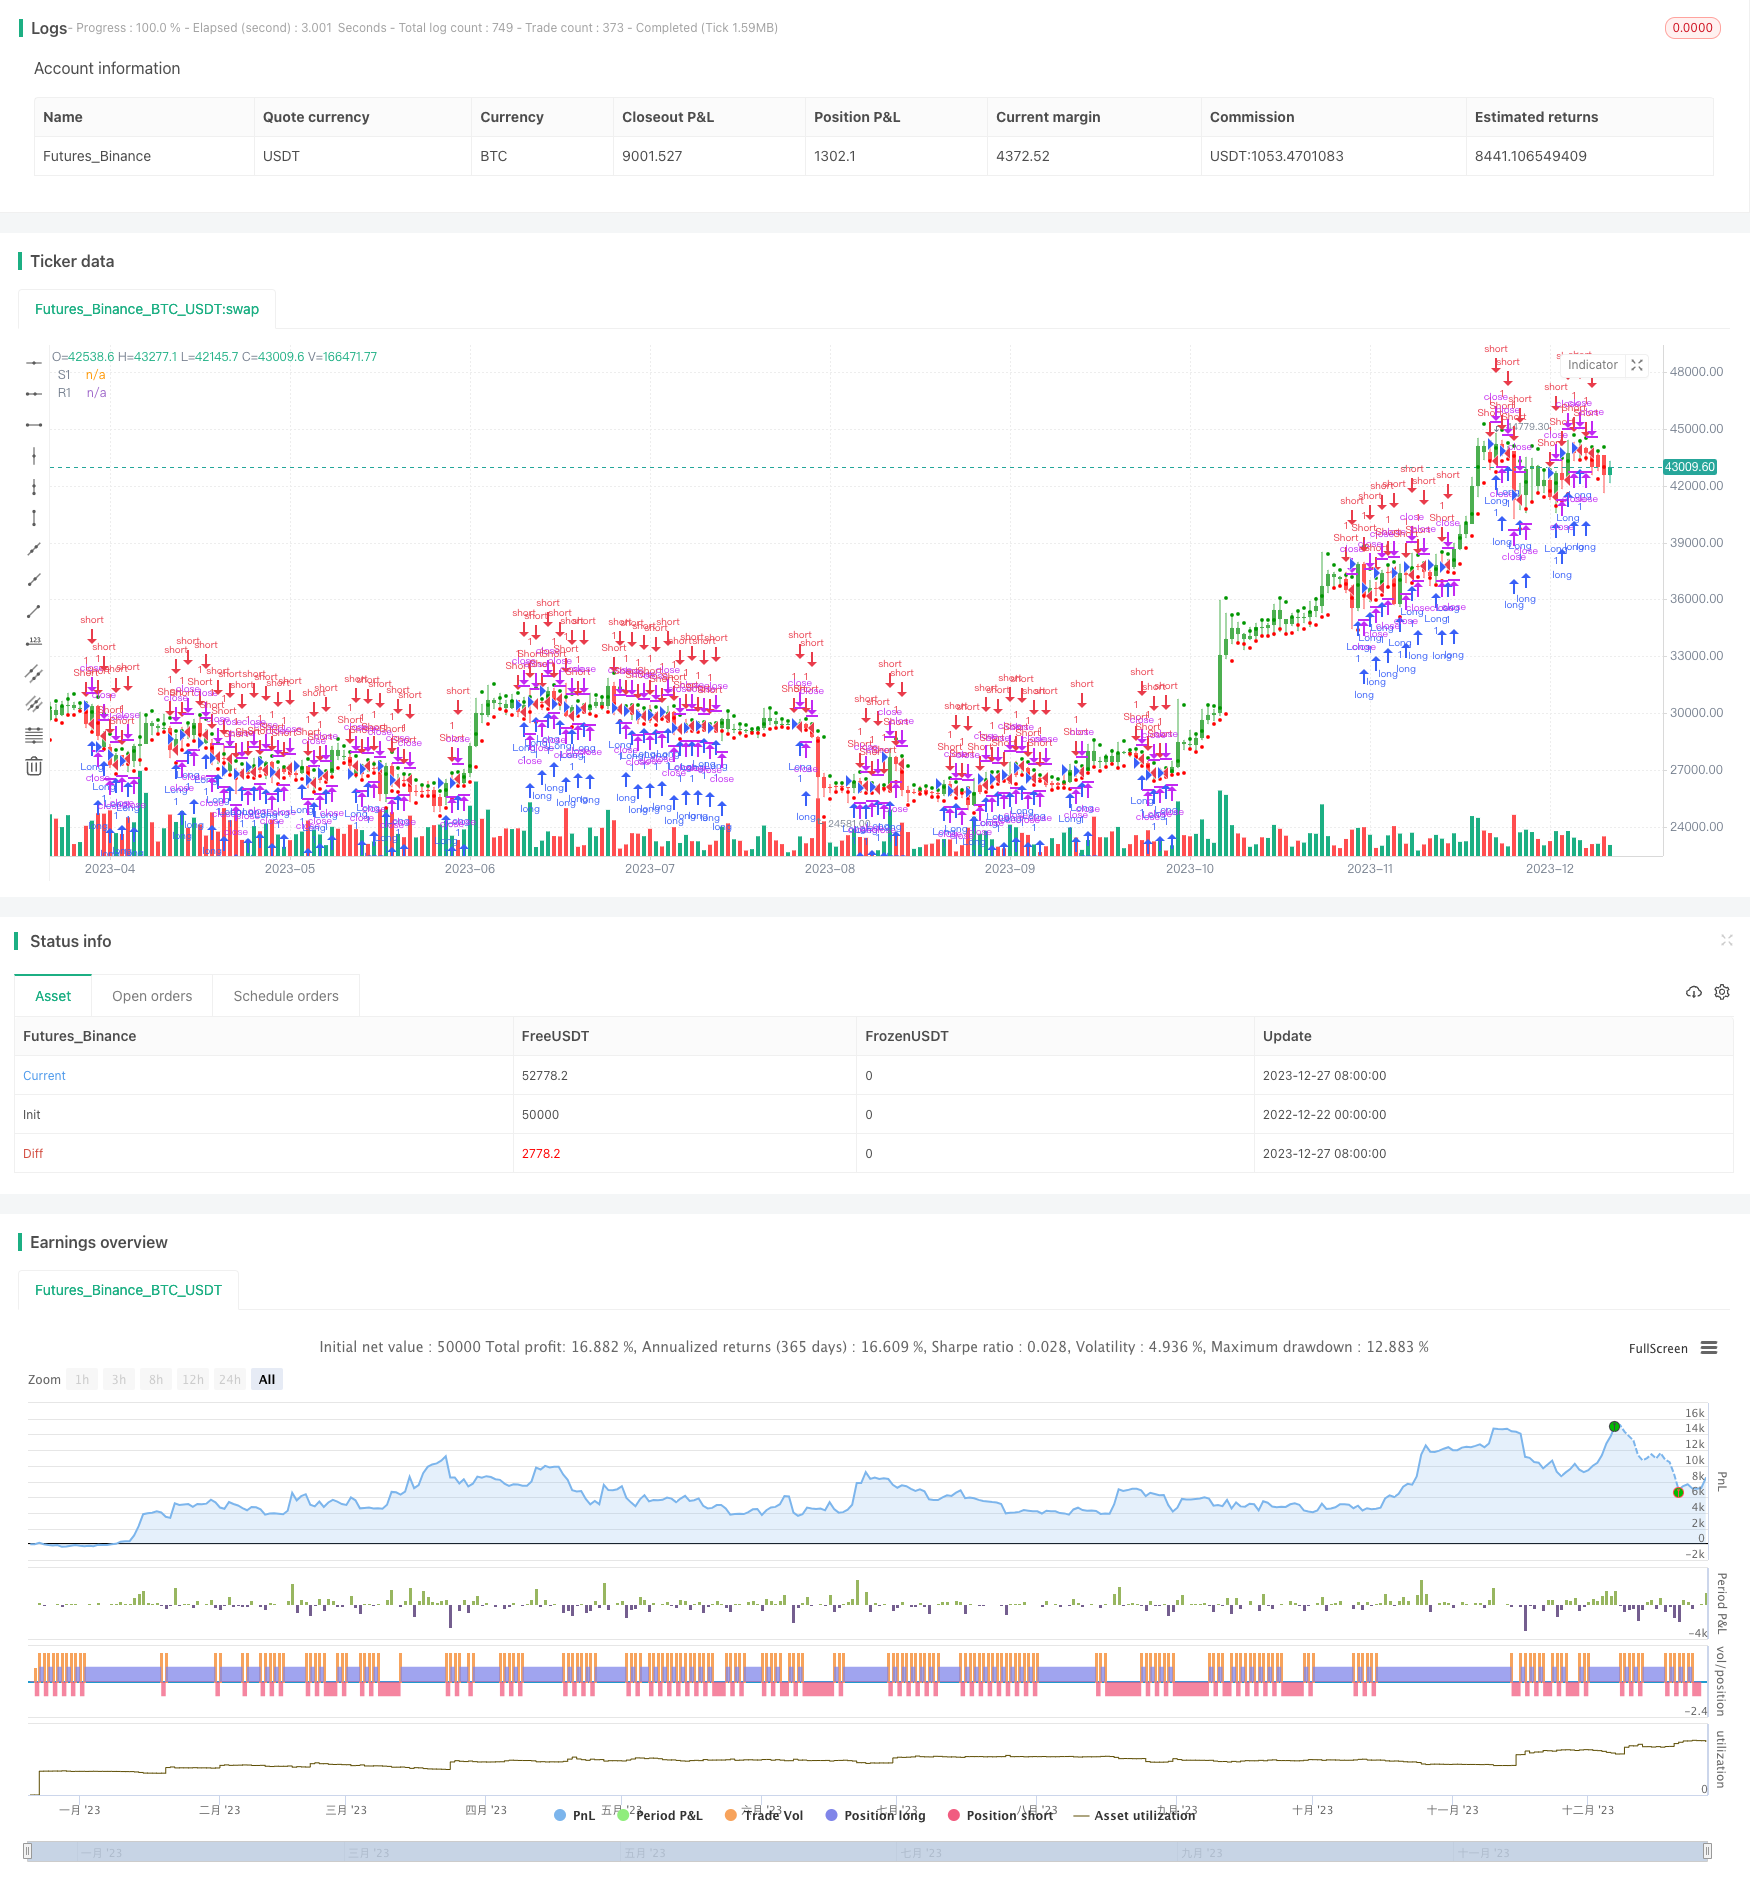
Dynamic Pivot Point Backtest Strategy
Author: ChaoZhang, Date: 2023-12-29 15:50:57Tags:

Overview
This strategy makes long or short positions based on the support and resistance levels calculated from the highest, lowest and closing prices of the previous trading day. It goes long when the price breaks through the upper resistance level R1 and goes short when the price breaks through the lower support level S1. The strategy belongs to the dynamic pivot point strategy.
Strategy Principle
-
Calculate the support level S1, resistance level R1 and pivot point vPP of the current day based on the highest price xHigh, lowest price xLow and closing price xClose of the previous trading day.
vPP = (xHigh+xLow+xClose) / 3
vR1 = vPP+(vPP-xLow)
vS1 = vPP-(xHigh - vPP)
-
Determine if the price breaks through vR1 or vS1. Go long if the price breaks through vR1 and go short if the price breaks below vS1. POS records the long or short direction.
pos = iff(close > vR1, 1, iff(close < vS1, -1, nz(pos[1], 0)))
-
possig records the actual trading direction. If reverse trading is enabled with reverse=true, the trading signal is reversed.
-
Go long when vR1 is broken and go short when vS1 is broken according to the possig signal.
Strategy Advantages
- The strategy utilizes dynamic support and resistance levels to capture trending moves.
- The support and resistance levels are updated daily, making them dynamic.
- Both long and short trades are configurable to suit different market environments.
- The strategy logic is simple and clean for easy understanding and implementation.
- Visualizations of support and resistance levels allow intuitive trend change detection.
Risk Analysis
- Unnecessary buy and sell signals may be triggered if the market is ranging.
- If extreme trending moves occur, the broken support/resistance may extend continuously resulting in losses.
- The pivot point and support/resistance calculation is simple and needs further optimization.
Risk Management:
- Adjust position sizing to limit single trade loss.
- Set stop loss to prevent losses exceeding maximum tolerable amount.
- Add filters based on other indicators to avoid over-trading in ranging markets.
Enhancement Opportunities
- Optimize support and resistance calculation to improve predictability.
- Incorporate trend and momentum indicators to avoid unnecessary trades.
- Add stop loss strategy to control single and maximum losses.
- Utilize machine learning to dynamically optimize support/resistance levels.
Summary
This strategy makes long or short trades based on price breaking dynamic support and resistance levels. The logic is simple to understand and implement while being able to effectively identify trend reversals. However, risks exist and further optimizations with additional indicators are needed to generate more reliable trading signals. Overall, the strategy serves well as an assistive indicator or a basic building block in quantitative trading systems.
//@version=2
////////////////////////////////////////////////////////////
//  Copyright by HPotter v1.0 14/06/2018
// This Pivot points is calculated on the current day.
// Pivot points simply took the high, low, and closing price from the previous period and
// divided by 3 to find the pivot. From this pivot, traders would then base their
// calculations for three support, and three resistance levels. The calculation for the most
// basic flavor of pivot points, known as ‘floor-trader pivots’, along with their support and
// resistance levels.
//
// You can change long to short in the Input Settings
// WARNING:
// - For purpose educate only
// - This script to change bars colors.
////////////////////////////////////////////////////////////
strategy(title="Dynamic Pivot Point Backtest", shorttitle="Dynamic Pivot Point", overlay = true)
reverse = input(false, title="Trade reverse")
xHigh  = request.security(syminfo.tickerid,"D", high[1])
xLow   = request.security(syminfo.tickerid,"D", low[1])
xClose = request.security(syminfo.tickerid,"D", close[1])
vPP = (xHigh+xLow+xClose) / 3
vR1 = vPP+(vPP-xLow)
vS1 = vPP-(xHigh - vPP)
pos = iff(close > vR1, 1,
       iff(close < vS1, -1, nz(pos[1], 0)))
possig = iff(reverse and pos == 1, -1,
          iff(reverse and pos == -1, 1, pos))
if (possig == 1)
    strategy.entry("Long", strategy.long)
if (possig == -1)
    strategy.entry("Short", strategy.short)
barcolor(possig == -1 ? red: possig == 1 ? green : blue )
plot(vS1, color=#ff0000, title="S1", style = circles, linewidth = 1)
plot(vR1, color=#009600, title="R1", style = circles, linewidth = 1)
- Trend Following Strategy Based on QQE and MA
- Volume Weighted Average Price Strategy
- Quantitative Dual-indicator Strategy
- Momentum Tracking Strategy
- RSI Indicator Improvement Trading Strategy
- Trend Reversal Momentum Indicators Crossover Tracking Strategy
- Multi Timeframe Breakout Strategy
- Momentum and Money Flow Crossroad Cashing Strategy
- Dynamic Take Profit Following Trend Strategy
- 10EMA Double Cross Trend Tracking Strategy
- Dual EMA Crossover Trend Strategy
- Anchored Rolling CVDVWAP Signal Strategy
- RSI Fibonacci Retracement Strategy
- Bollinger Bands + RSI + EMA Double Trading Strategy
- Dynamic Trailing Stop Optimization Strategy Based on Ichimoku Cloud
- High/Low Cryptocurrency Strategy Based on Multiple Indicators
- VWAP-RSI Oversold Crossunder BTC Short Strategy
- Quant Strategy Based on Linear Regression Intercept
- Mean Reversion Line Strategy
- Fibonacci HMA AI Buy Sell Signal Strategy