概述
本策略是一个适用于加密货币市场的高低位策略。它综合运用了MACD、PSAR、ATR、 Elliott波等多个指标,在1小时、4小时或1天等较高时间周期进行交易。策略的优势在于风险回报率高,平均盈利因子可达1.5-2.5。
策略原理
该策略的交易信号来自价格的高低位点和多个指标的综合判断。具体逻辑是:
判断K线是否出现价格高低位区间,即高点连续创新高、低点连续创新低。
检查MACD的直方图水平。
检查PSAR指标判断趋势方向。
检查ATR和MA制成的趋势指标判断趋势方向。
检查Elliott波指标确认趋势方向。
如果上述5个条件都指向同一方向,产生做多或做空信号。
策略优势
风险回报率高,可达1:30。
平均盈利因子高,一般在1.5-2.5之间。
多重指标组合,可以有效过滤假突破。
策略风险
获胜率较低,只有10%-20%。
存在一定的回撤和拉锯盘的风险。
指标效果会受市场环境影响。
需要较强的心理承受能力。
对应措施:
加大交易资金规模以平衡获胜率。
严格控制单笔止损。
根据不同市场调整指标参数。
做好心理建设,控制好位置规模。
优化方向
根据不同加密货币和市场环境测试指标参数。
增加止损、止盈策略优化资金管理。
结合机器学习方法提高获胜率。
增加社交情绪指标过滤交易信号。
考虑多时间周期指标确认。
总结
本策略整体来说是一个适合加密货币的高风险高收益交易策略。它的优势在于风险回报率高,可以获得较高的平均盈利因子。风险主要在于获胜率较低,需要有较强的心理承受能力。下一步的优化方向可以从调整参数、优化资金管理、提高获胜率等多个维度进行。总体而言,本策略对于寻求高收益的加密货币交易者具有一定的实用价值。
策略源码
/*backtest
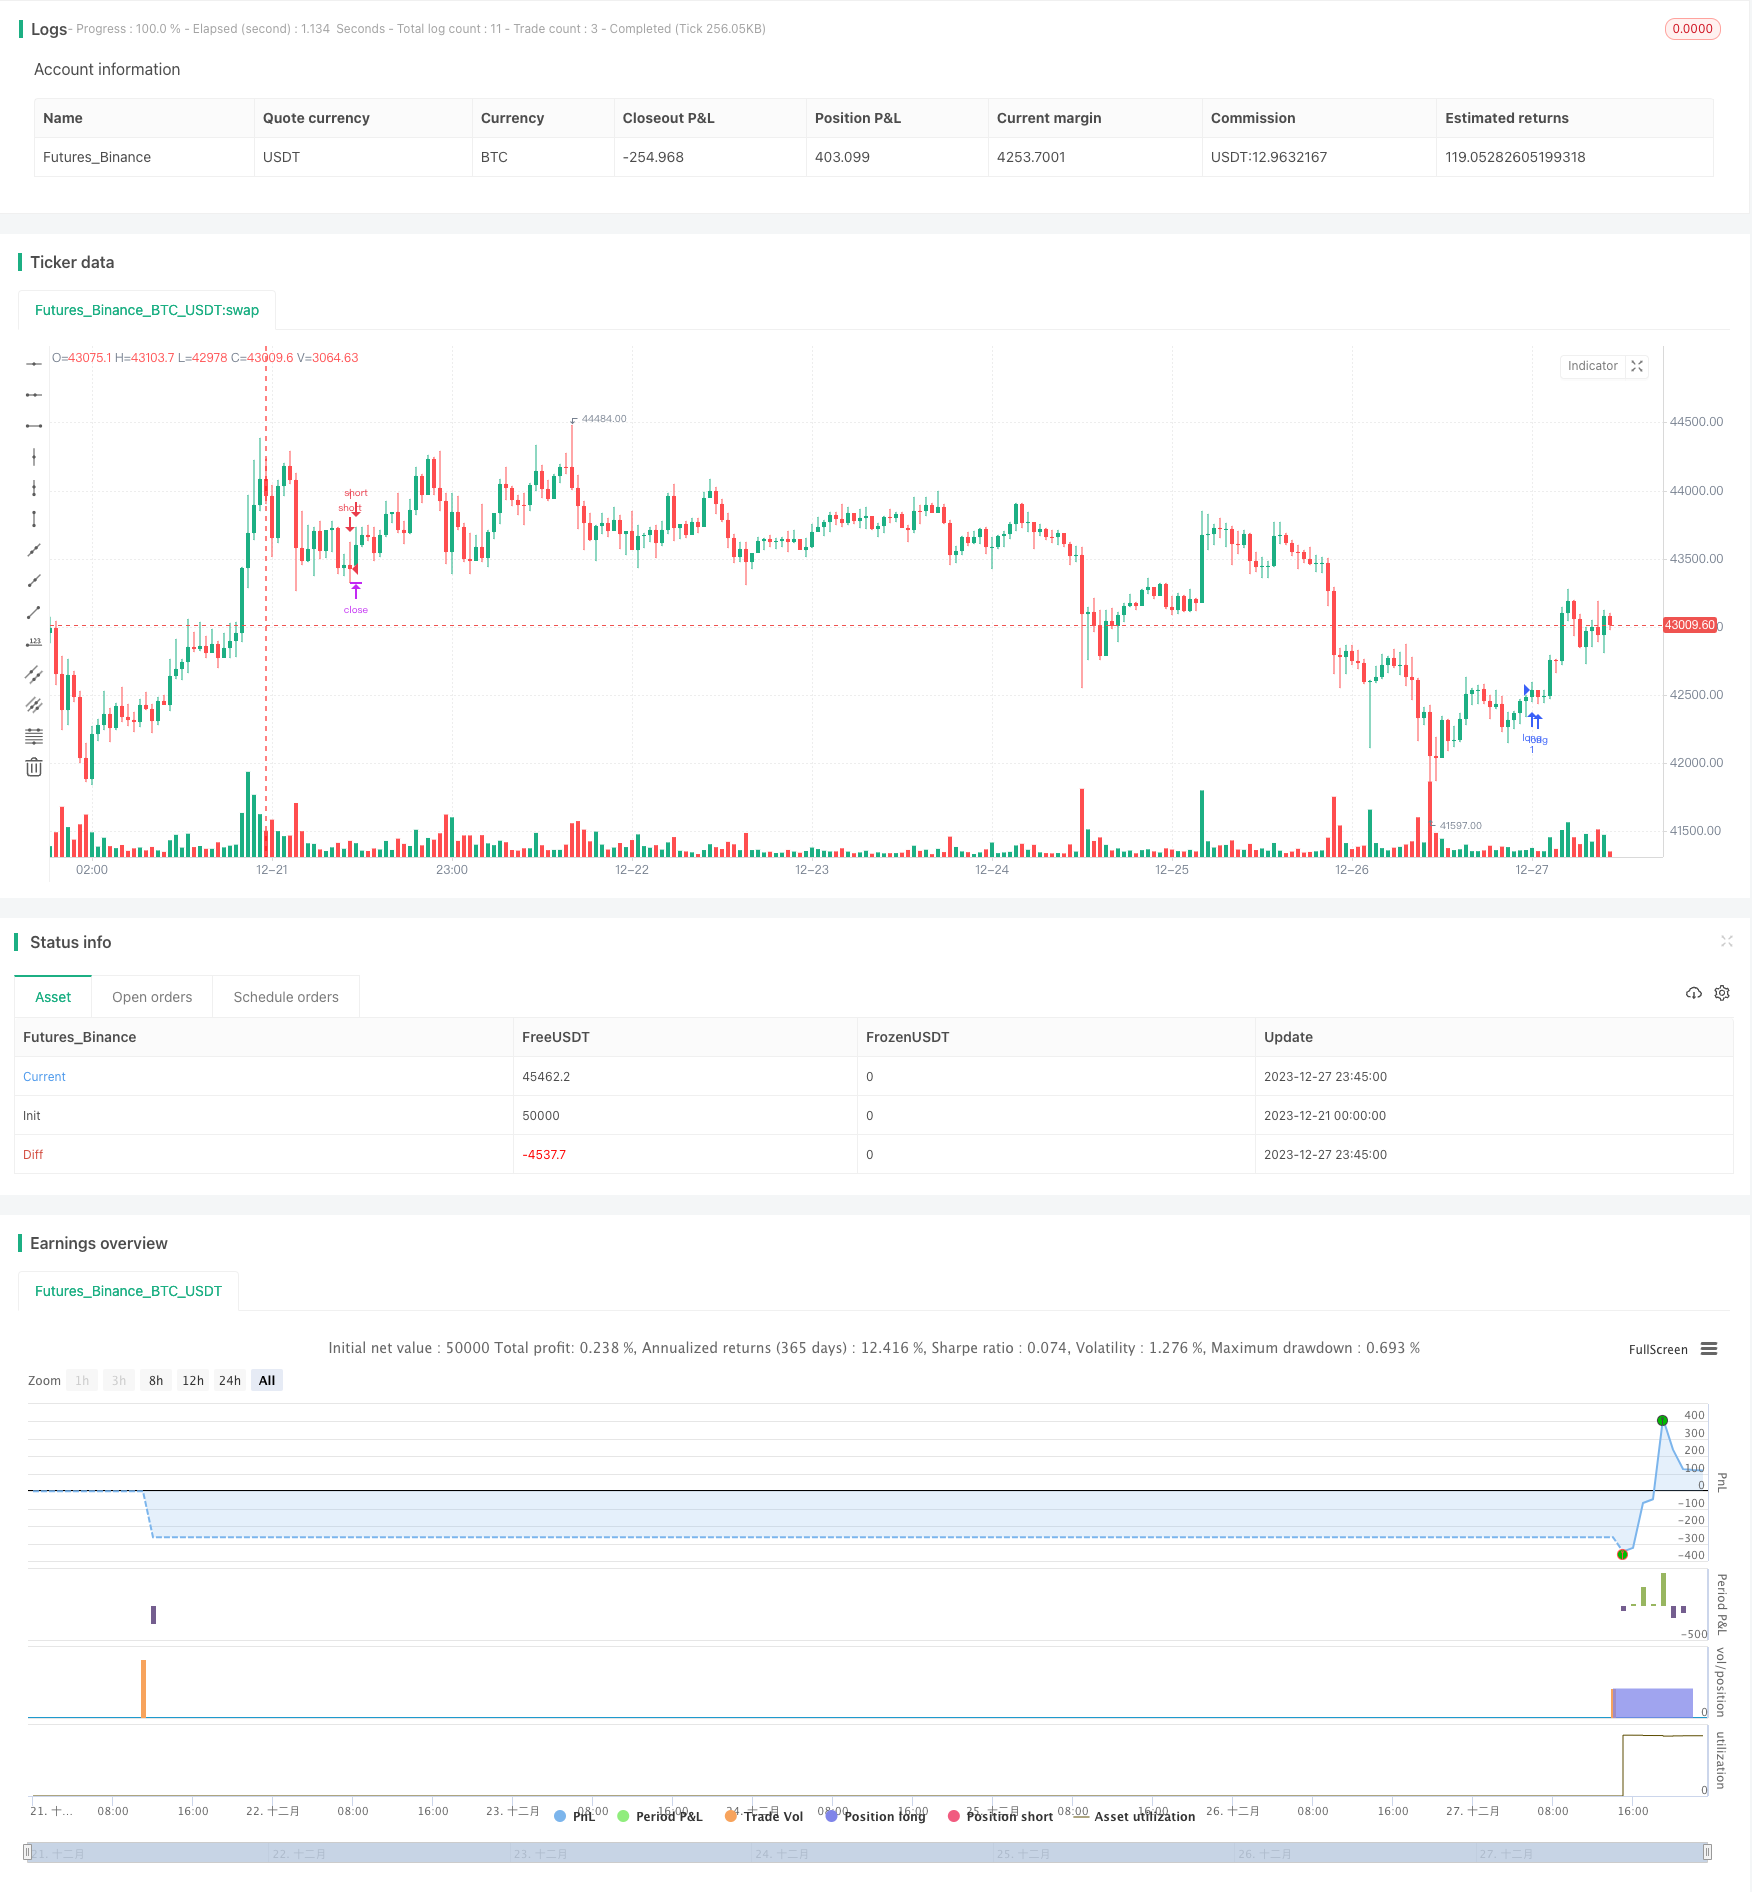
start: 2023-12-21 00:00:00
end: 2023-12-28 00:00:00
period: 45m
basePeriod: 5m
exchanges: [{"eid":"Futures_Binance","currency":"BTC_USDT"}]
*/
// This source code is subject to the terms of the Mozilla Public License 2.0 at https://mozilla.org/MPL/2.0/
// © SoftKill21
//@version=4
strategy("Crypto strategy high/low", overlay=true)
fast_length = input(title="Fast Length", type=input.integer, defval=12)
slow_length = input(title="Slow Length", type=input.integer, defval=26)
src = input(title="Source", type=input.source, defval=close)
signal_length = input(title="Signal Smoothing", type=input.integer, minval = 1, maxval = 50, defval = 9)
sma_source = input(title="Simple MA(Oscillator)", type=input.bool, defval=true)
sma_signal = input(title="Simple MA(Signal Line)", type=input.bool, defval=false)
//sar
start = input(0.02)
increment = input(0.02)
maximum = input(0.2)
var bool uptrend = na
var float EP = na
var float SAR = na
var float AF = start
var float nextBarSAR = na
if bar_index > 0
firstTrendBar = false
SAR := nextBarSAR
if bar_index == 1
float prevSAR = na
float prevEP = na
lowPrev = low[1]
highPrev = high[1]
closeCur = close
closePrev = close[1]
if closeCur > closePrev
uptrend := true
EP := high
prevSAR := lowPrev
prevEP := high
else
uptrend := false
EP := low
prevSAR := highPrev
prevEP := low
firstTrendBar := true
SAR := prevSAR + start * (prevEP - prevSAR)
if uptrend
if SAR > low
firstTrendBar := true
uptrend := false
SAR := max(EP, high)
EP := low
AF := start
else
if SAR < high
firstTrendBar := true
uptrend := true
SAR := min(EP, low)
EP := high
AF := start
if not firstTrendBar
if uptrend
if high > EP
EP := high
AF := min(AF + increment, maximum)
else
if low < EP
EP := low
AF := min(AF + increment, maximum)
if uptrend
SAR := min(SAR, low[1])
if bar_index > 1
SAR := min(SAR, low[2])
else
SAR := max(SAR, high[1])
if bar_index > 1
SAR := max(SAR, high[2])
nextBarSAR := SAR + AF * (EP - SAR)
// Calculating
fast_ma = sma_source ? sma(src, fast_length) : ema(src, fast_length)
slow_ma = sma_source ? sma(src, slow_length) : ema(src, slow_length)
macd = fast_ma - slow_ma
signal = sma_signal ? sma(macd, signal_length) : ema(macd, signal_length)
hist = macd - signal
CCI = input(20)
ATR = input(5)
Multiplier=input(1,title='ATR Multiplier')
original=input(true,title='original coloring')
thisCCI = cci(close, CCI)
lastCCI = nz(thisCCI[1])
bufferDn= high + Multiplier * sma(tr,ATR)
bufferUp= low - Multiplier * sma(tr,ATR)
if (thisCCI >= 0 and lastCCI < 0)
bufferUp := bufferDn[1]
if (thisCCI <= 0 and lastCCI > 0)
bufferDn := bufferUp[1]
if (thisCCI >= 0)
if (bufferUp < bufferUp[1])
bufferUp := bufferUp[1]
else
if (thisCCI <= 0)
if (bufferDn > bufferDn[1])
bufferDn := bufferDn[1]
x=0.0
x:=thisCCI >= 0 ?bufferUp:thisCCI <= 0 ?bufferDn:x[1]
swap=0.0
swap:=x>x[1]?1:x<x[1]?-1:swap[1]
swap2=swap==1?color.lime:color.red
swap3=thisCCI >=0 ?color.lime:color.red
swap4=original?swap3:swap2
//elliot wave
srce = input(close, title="source")
sma1length = input(5)
sma2length = input(35)
UsePercent = input(title="Show Dif as percent of current Candle", type=input.bool, defval=true)
smadif=iff(UsePercent,(sma(srce, sma1length) - sma(srce, sma2length)) / srce * 100, sma(srce, sma1length) - sma(srce, sma2length))
col=smadif <= 0 ? color.red : color.green
longC = high > high[1] and high[1] > high[2] and close[2] > high[3] and hist > 0 and uptrend and smadif < 0 and swap4==color.lime
//longC = high > high[1] and high[1] > high[2] and high[2] > high[3] and high[3] > high[4] and close[4] > high[5]
shortC = low < low[1] and low[1] < low[2] and close[2] < low[3] and hist < 0 and not uptrend and smadif > 0 and swap4==color.red
//shortC = low < low[1] and low[1] < low[2] and low[2] < low[3] and low[3] < low[4] and close[4] < low[5]
tp=input(0.15, title="tp")
sl=input(0.005, title="sl")
strategy.entry("long",1,when=longC)
strategy.entry("short",0,when=shortC)
strategy.exit("x_long", "long" ,loss = close * sl / syminfo.mintick, profit = close * tp / syminfo.mintick , alert_message = "closelong")
//strategy.entry("short",0, when= loss = close * sl / syminfo.mintick)
strategy.exit("x_short", "short" , loss = close * sl / syminfo.mintick, profit = close * tp / syminfo.mintick,alert_message = "closeshort")
//strategy.entry("long",1, when = loss = close * sl / syminfo.mintick)
//strategy.close("long",when= hist < 0)
//strategy.close("short", when= hist > 0)