概述
本策略为基于RSI指标的跨时间框架BTC做空策略。该策略通过计算每笔K线的成交量加权平均价(VWAP)得到一个VWAP曲线,再对该曲线应用RSI指标。当RSI指标出现从超买区向下穿越的死叉信号时,做空BTC。
策略原理
- 计算每根K线的成交量加权平均价(VWAP),得到一条VWAP曲线
- 对VWAP曲线应用RSI指标,参数为20日,超买线为85,超卖线为30
- 当RSI指标从超买区(85)向下穿越超卖区(30)时,开仓做空
- 持仓28根K线后,如果RSI指标再次上穿超卖线(30),平仓
优势分析
- 使用VWAP而不是简单的收盘价,更能反映真实交易价格
- 应用RSI指标识别超买超卖状态,避免追高杀跌
- 跨时间框架操作,避免被套
- 风险可控,28根K线止损
风险及解决方案
- 突发事件导致价格急速上涨,无法止损
- 采用跨时间框架,降低被套风险
- 参数设置不当,容易错过机会
- 对RSI参数和超买超卖线进行测试和优化
- K线无法穿越进入超卖区
- 结合其他指标判断趋势,灵活调整参数
优化方向
- 测试更多参数组合,找到最佳参数
- 结合MACD,KD等其他指标判断是否进入超买超卖区
- 根据不同品种分别测试参数设置
- 优化止损机制,根据波动率设置止损幅度
总结
本策略通过VWAP和RSI的结合识别BTC的超买超卖状态,以跨时间框架的方式进行操作,能够有效控制风险。策略思路清晰易懂,值得进一步测试优化,应用于实盘交易。
策略源码
/*backtest
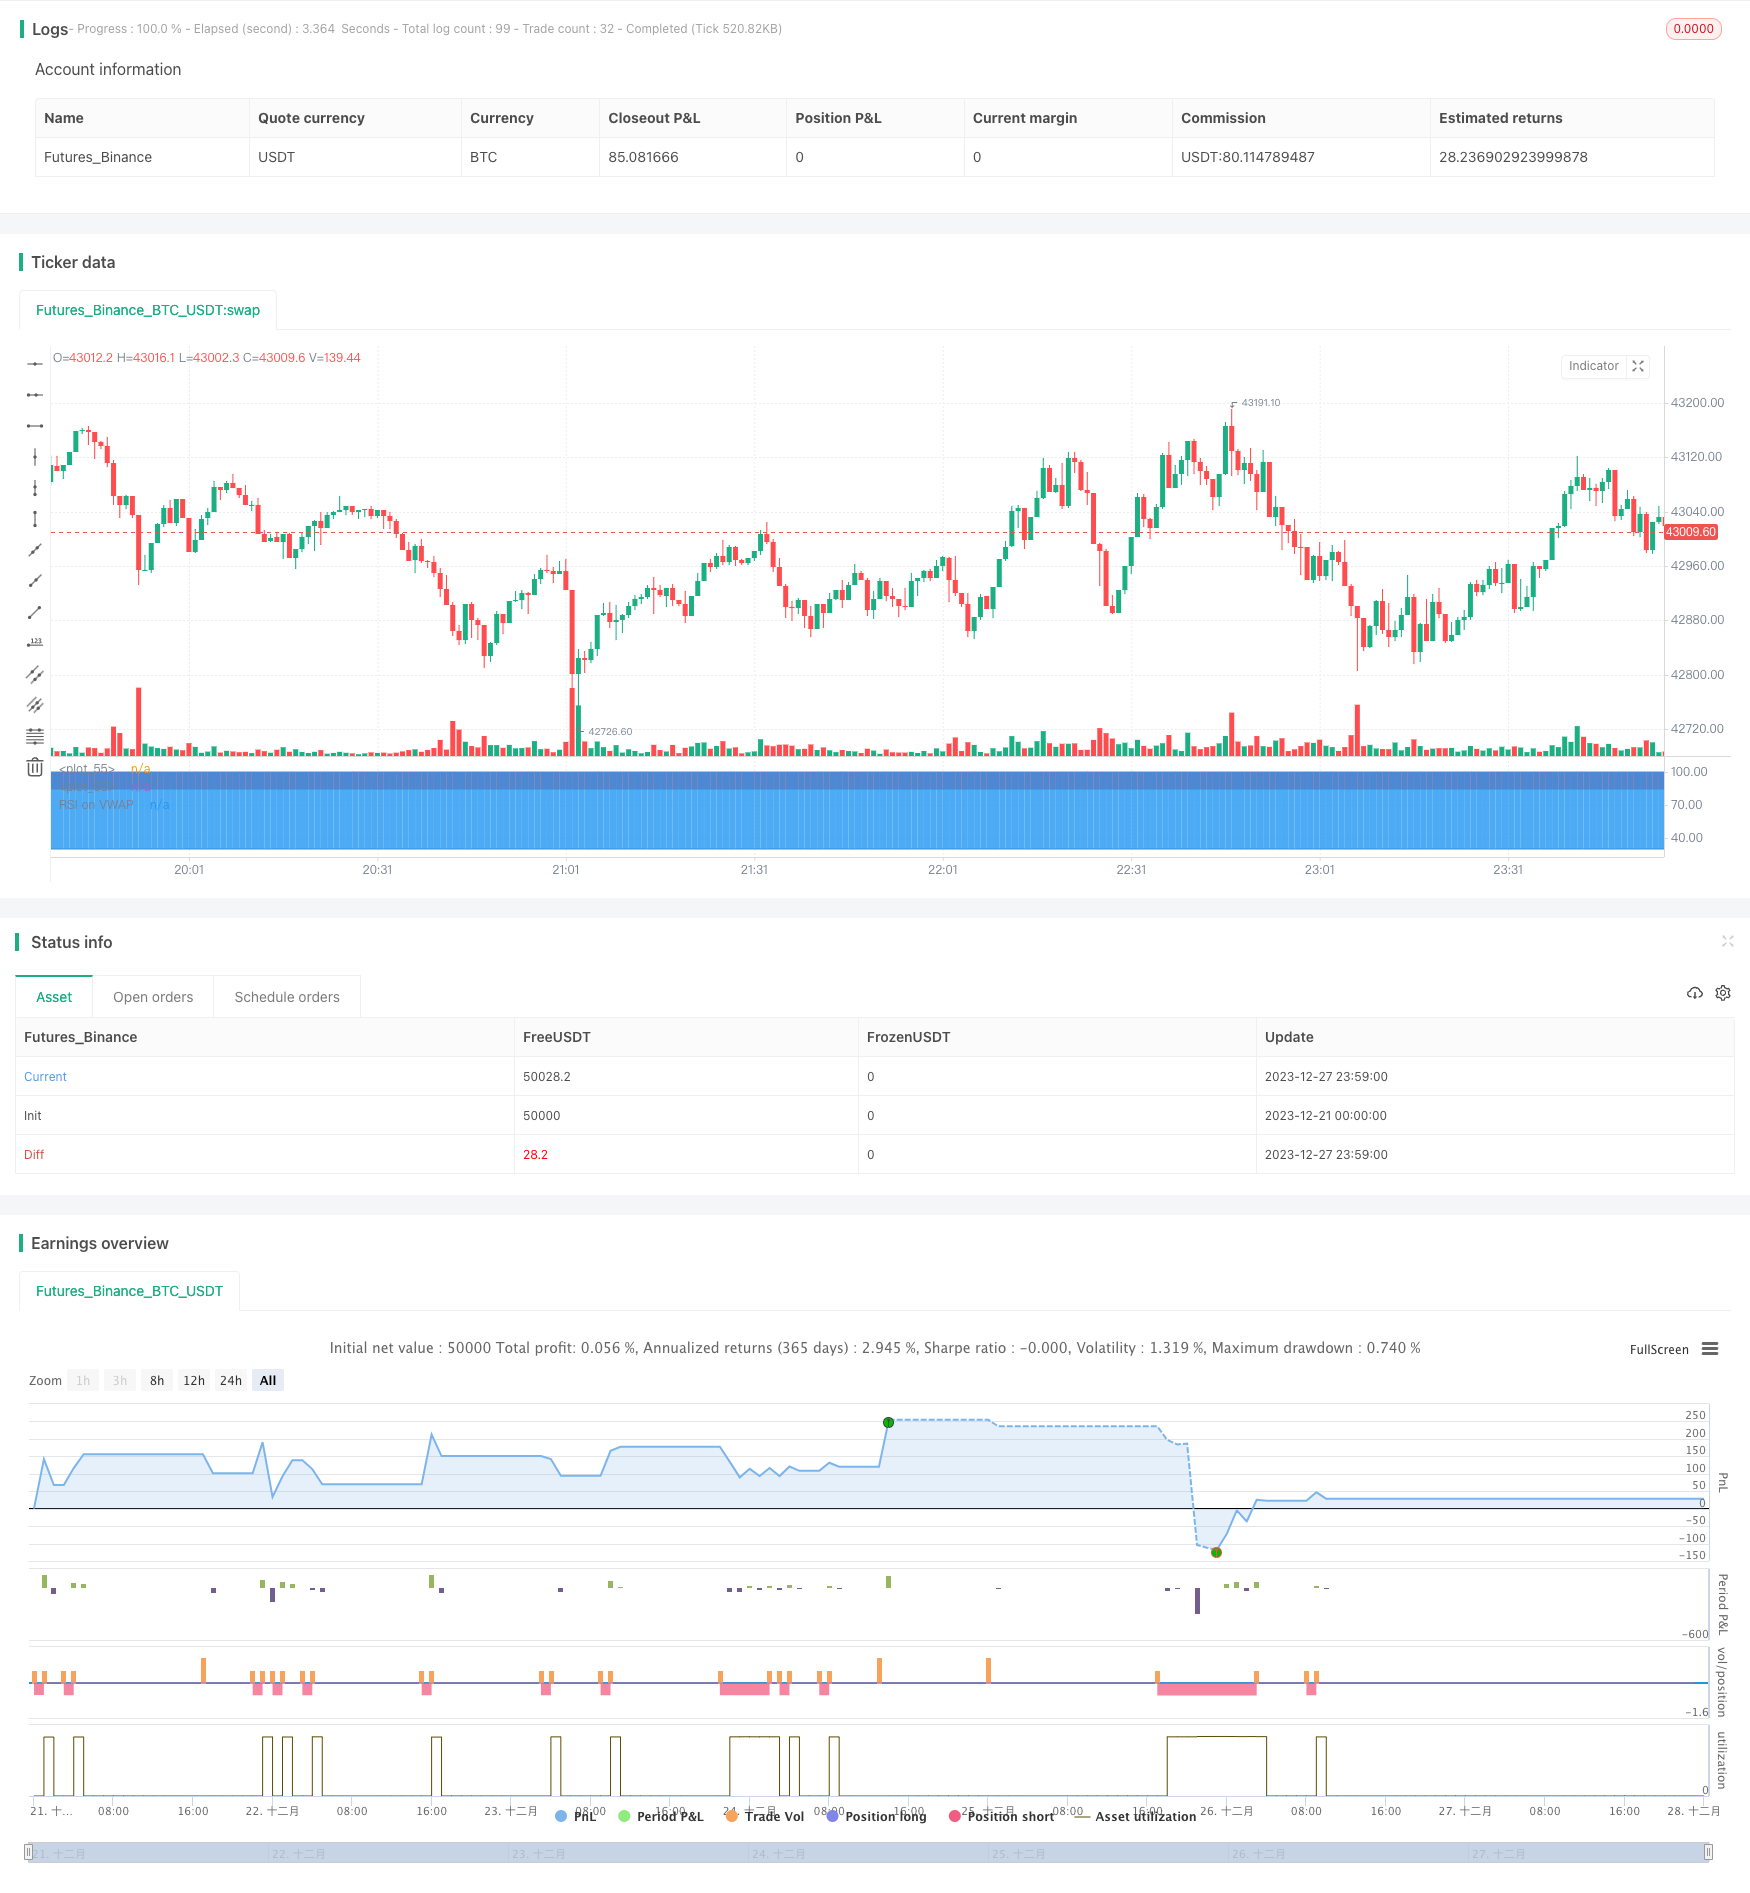
start: 2023-12-21 00:00:00
end: 2023-12-28 00:00:00
period: 1m
basePeriod: 1m
exchanges: [{"eid":"Futures_Binance","currency":"BTC_USDT"}]
*/
//@version=4
strategy("Soran Strategy 2 - SHORT SIGNALS", pyramiding=1, initial_capital=1000, default_qty_type=strategy.percent_of_equity, default_qty_value=50, overlay=false)
// ----------------- Inputs ----------------- //
reso = input(title="Resolution", type=input.resolution, defval="")
length = input(20, title="RSI Length", type=input.integer)
ovrsld = input(30, "RSI Oversold level", type=input.float)
ovrbgt = input(85, "RSI Overbought level", type=input.float)
lateleave = input(28, "Number of candles", type=input.integer)
// lateleave : numbers of bars in overbought/oversold zones where the position is closed. The position is closed when this number is reached or when the zone is left (the first condition).
// best parameters BTCUSDTPERP M15 : 20 / 30 / 85 / 28
stratbull = input(title="Enter longs ?", type = input.bool, defval=true)
stratbear = input(title="Enter shorts ?", type = input.bool, defval=true)
stratyear = input(2020, title = "Strategy Start Year")
stratmonth = input(1, title = "Strategy Start Month")
stratday = input(1, title = "Strategy Start Day")
stratstart = timestamp(stratyear,stratmonth,stratday,0,0)
// --------------- Laguerre ----------------- //
laguerre = input(title="Use Laguerre on RSI ?", type=input.bool, defval=false)
gamma = input(0.06, title="Laguerre Gamma")
laguerre_cal(s,g) =>
l0 = 0.0
l1 = 0.0
l2 = 0.0
l3 = 0.0
l0 := (1 - g)*s+g*nz(l0[1])
l1 := -g*l0+nz(l0[1])+g*nz(l1[1])
l2 := -g*l1+nz(l1[1])+g*nz(l2[1])
l3 := -g*l2+nz(l2[1])+g*nz(l3[1])
(l0 + 2*l1 + 2*l2 + l3)/6
// ---------------- Rsi VWAP ---------------- //
rsiV = security(syminfo.tickerid, reso, rsi(vwap(close), length))
rsiVWAP = laguerre ? laguerre_cal(rsiV,gamma) : rsiV
// ------------------ Plots ----------------- //
prsi = plot(rsiVWAP, color = rsiVWAP>ovrbgt ? color.red : rsiVWAP<ovrsld ? color.green : color.white, title="RSI on VWAP", linewidth=1, style=plot.style_line)
hline = plot(ovrbgt, color = color.gray, style=plot.style_line)
lline = plot(ovrsld, color = color.gray, style=plot.style_line)
fill(prsi,hline, color = rsiVWAP > ovrbgt ? color.red : na, transp = 30)
fill(prsi,lline, color = rsiVWAP < ovrsld ? color.green : na, transp = 30)
// ---------------- Positions: only shows the Short and close shoret positions --------------- //
timebull = stratbull and time > stratstart
timebear = stratbear and time > stratstart
strategy.entry("Short", false, when = timebear and crossunder(rsiVWAP, ovrbgt), comment="")
strategy.close("Short", when = timebear and crossunder(rsiVWAP, ovrsld)[lateleave] or crossover(rsiVWAP, ovrsld), comment="")