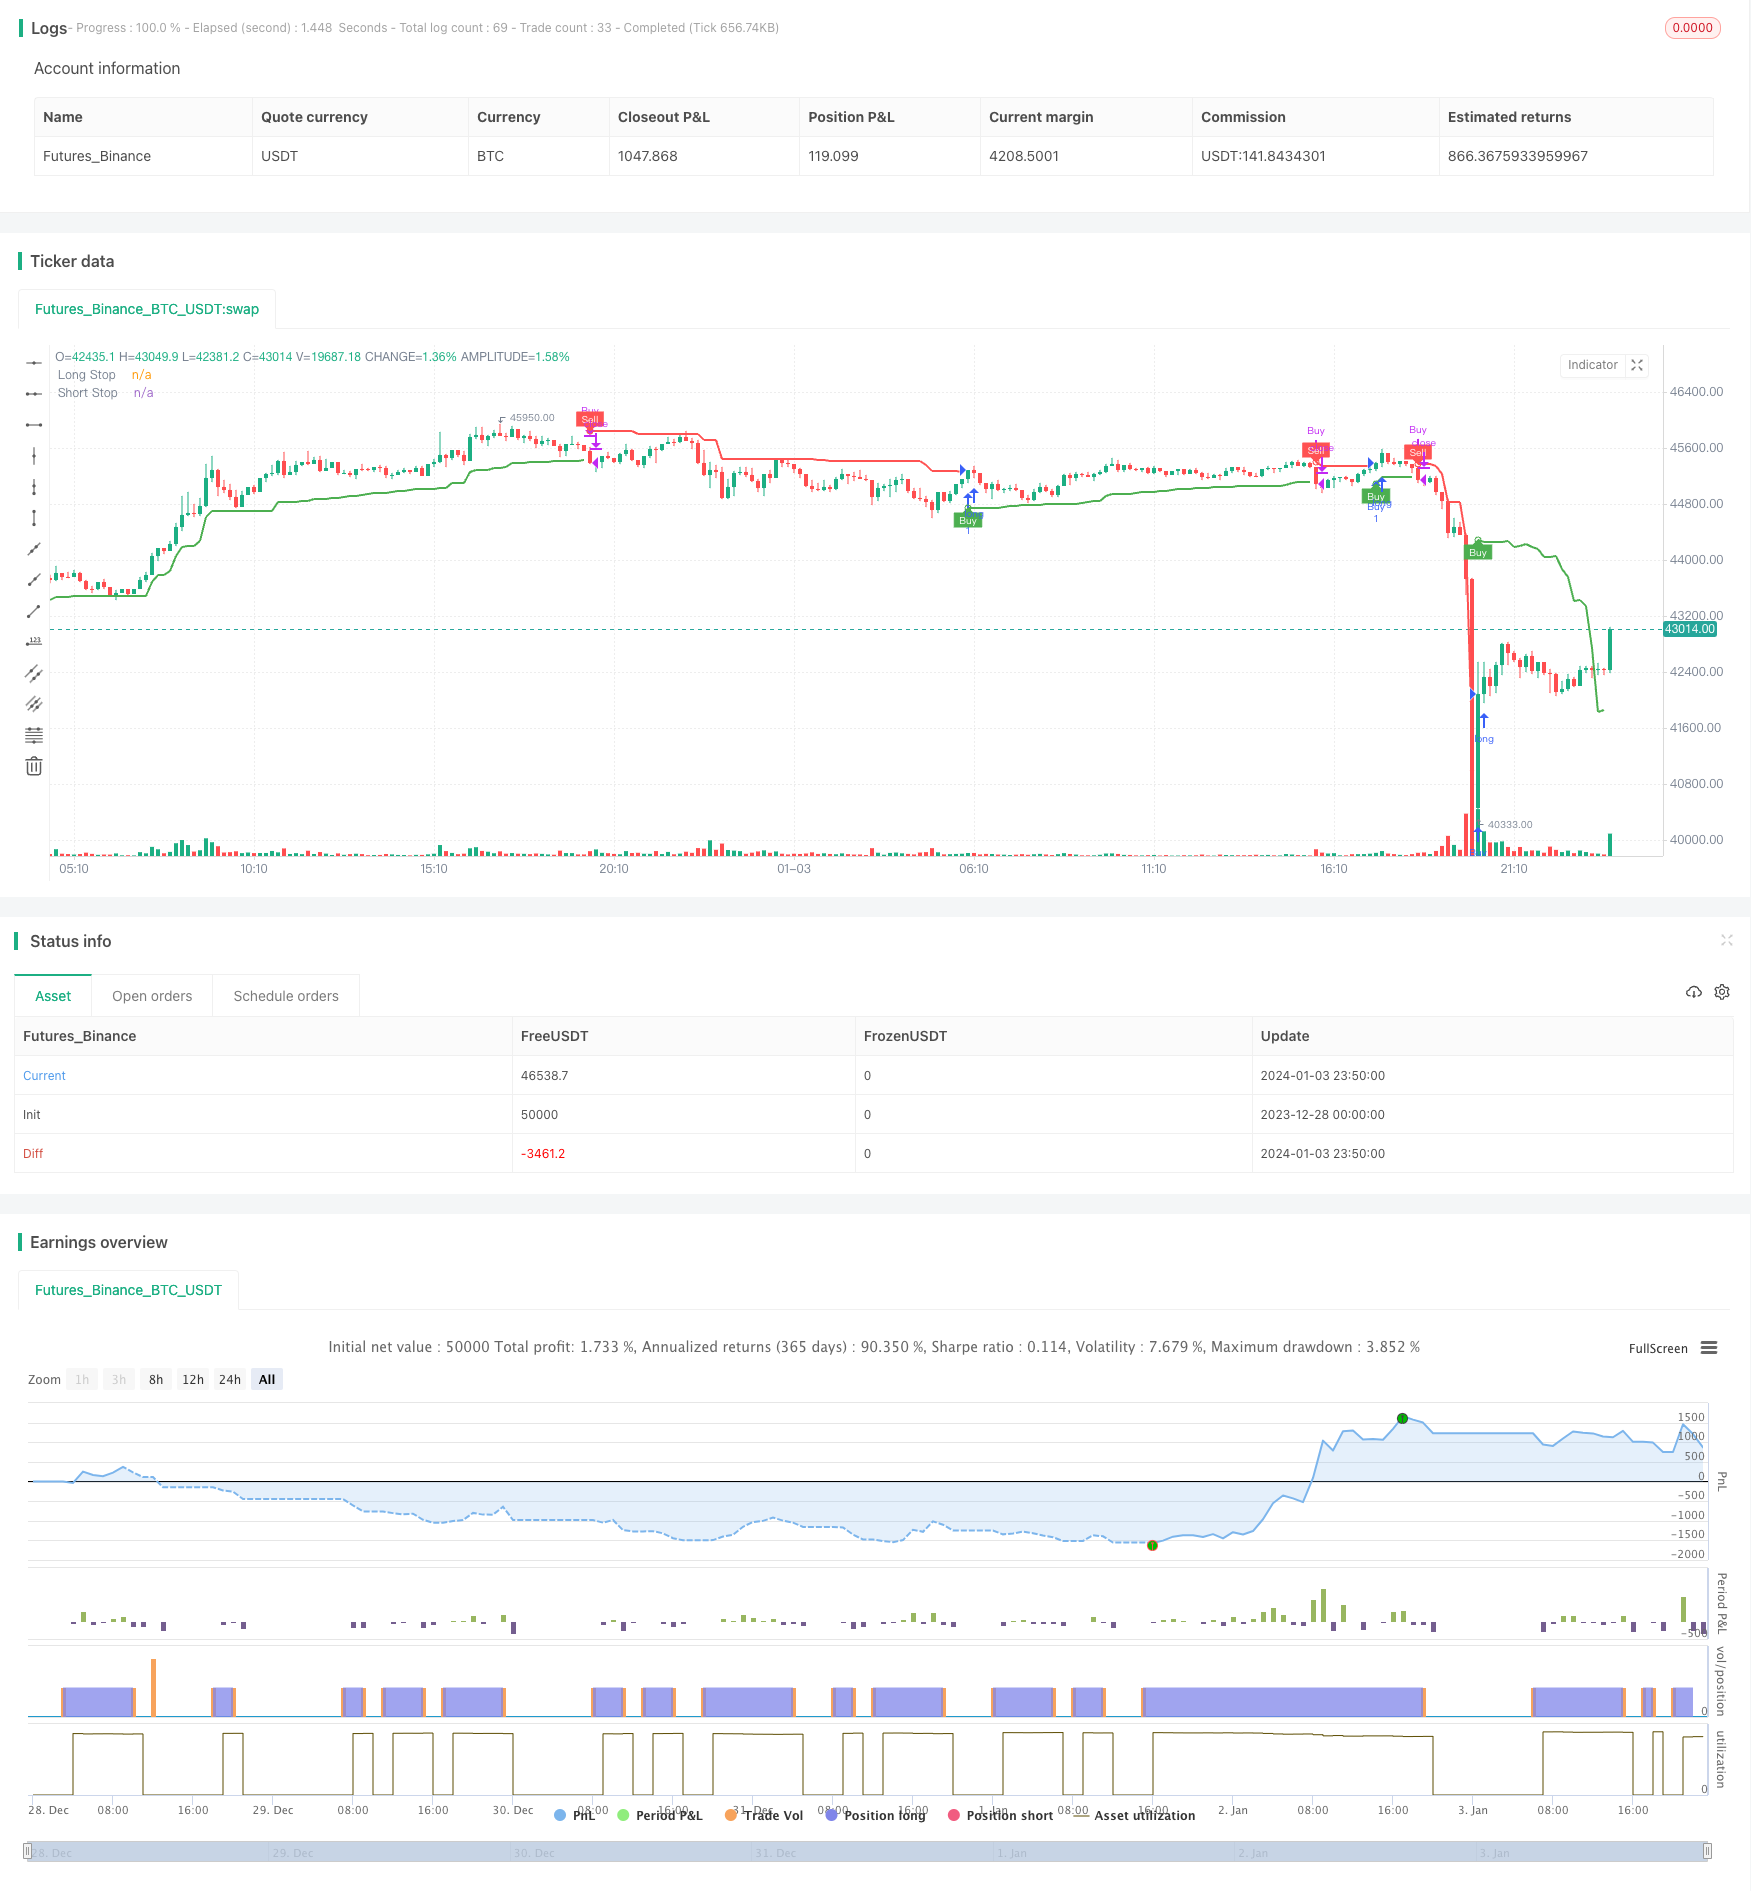
Overview
This strategy uses the Chandelier Exit indicator to determine the direction and momentum of price breakouts and generate buy and sell signals. It only performs buy operations.
Strategy Logic
This strategy is based on the Chandelier Exit indicator which sets stop-loss lines based on the highest high, lowest low and the Average True Range. Specifically, it calculates a 22-day ATR and multiples it by a coefficient (default 3) to derive values for long and short stop lines. The strategy generates a sell signal when price breaks below the long stop when long, and a buy signal when price breaks above the short stop when short.
The strategy only performs buy operations. It triggers a long entry when price breaks above the previous long stop line, and creates an exit signal when price falls below the short stop line, closing the long position.
Advantage Analysis
- Utilizes dynamic stop loss lines from Chandelier Exit to effectively control risks
- Combines price breakouts to capture trending moves
- Implements a strategy that avoids upside/downside reversals by only buying
- Alert conditions trigger notifications to monitor strategy status
Risk Analysis
- Chandelier Exit is sensitive to volatility expansion which may cause false signals
- No stop loss in place after buying to limit loss
- No profit taking mechanism to lock in gains
Risk Mitigations:
1. Add filter with other indicators to avoid false signals
2. Implement stop loss to limit maximum loss %
3. Incorporate trailing profit stops, such as dynamic adjustment of sell line or partial exits
Enhancement Opportunities
- Test different parameter sets to optimize entries and exits
- Add indicator filters to confirm signals and avoid false signals
- Consider allowing both buy and sell operations
- Introduce stop loss and take profit mechanisms
Conclusion
This strategy identifies reversal opportunities using the dynamic stop lines from the Chandelier Exit indicator. It buys on upside breaks of the long stop line and sells when prices falls below the short stop line, implementing a simple one-sided strategy that avoids upside/downside reversals. It effectively controls risk but lacks stop loss and take profit provisions. Optimization opportunities include adding filters and stop loss/profit taking mechanisms to make the strategy more robust.
/*backtest
start: 2023-12-28 00:00:00
end: 2024-01-04 00:00:00
period: 10m
basePeriod: 1m
exchanges: [{"eid":"Futures_Binance","currency":"BTC_USDT"}]
*/

//@version=5
strategy("Chandelier Exit Strategy", overlay=true)

length = input(title='ATR Period', defval=22)
mult = input.float(title='ATR Multiplier', step=0.1, defval=3.0)
showLabels = input(title='Show Buy/Sell Labels ?', defval=true)
useClose = input(title='Use Close Price for Extremums ?', defval=true)
highlightState = input(title='Highlight State ?', defval=true)

atr = mult * ta.atr(length)

longStop = (useClose ? ta.highest(close, length) : ta.highest(length)) - atr
longStopPrev = nz(longStop[1], longStop)
longStop := close[1] > longStopPrev ? math.max(longStop, longStopPrev) : longStop

shortStop = (useClose ? ta.lowest(close, length) : ta.lowest(length)) + atr
shortStopPrev = nz(shortStop[1], shortStop)
shortStop := close[1] < shortStopPrev ? math.min(shortStop, shortStopPrev) : shortStop

var int dir = 1
dir := close > shortStopPrev ? 1 : close < longStopPrev ? -1 : dir

var color longColor = color.green
var color shortColor = color.red

longStopPlot = plot(dir == 1 ? longStop : na, title='Long Stop', style=plot.style_linebr, linewidth=2, color=color.new(longColor, 0))
buySignal = dir == 1 and dir[1] == -1
plotshape(buySignal ? longStop : na, title='Long Stop Start', location=location.absolute, style=shape.circle, size=size.tiny, color=color.new(longColor, 0))
plotshape(buySignal and showLabels ? longStop : na, title='Buy Label', text='Buy', location=location.absolute, style=shape.labelup, size=size.tiny, color=color.new(longColor, 0), textcolor=color.new(color.white, 0))

shortStopPlot = plot(dir == 1 ? na : shortStop, title='Short Stop', style=plot.style_linebr, linewidth=2, color=color.new(shortColor, 0))
sellSignal = dir == -1 and dir[1] == 1
plotshape(sellSignal ? shortStop : na, title='Short Stop Start', location=location.absolute, style=shape.circle, size=size.tiny, color=color.new(shortColor, 0))
plotshape(sellSignal and showLabels ? shortStop : na, title='Sell Label', text='Sell', location=location.absolute, style=shape.labeldown, size=size.tiny, color=color.new(shortColor, 0), textcolor=color.new(color.white, 0))

changeCond = dir != dir[1]
alertcondition(changeCond, title='Alert: CE Direction Change', message='Chandelier Exit has changed direction!')
alertcondition(buySignal, title='Alert: CE Buy', message='Chandelier Exit Buy!')
alertcondition(sellSignal, title='Alert: CE Sell', message='Chandelier Exit Sell!')

// Define initial capital
initial_capital =25

// Trigger buy order and close buy order on sell signal
if buySignal
    strategy.entry("Buy", strategy.long, qty = initial_capital / close)

if sellSignal
    strategy.close("Buy")