概述
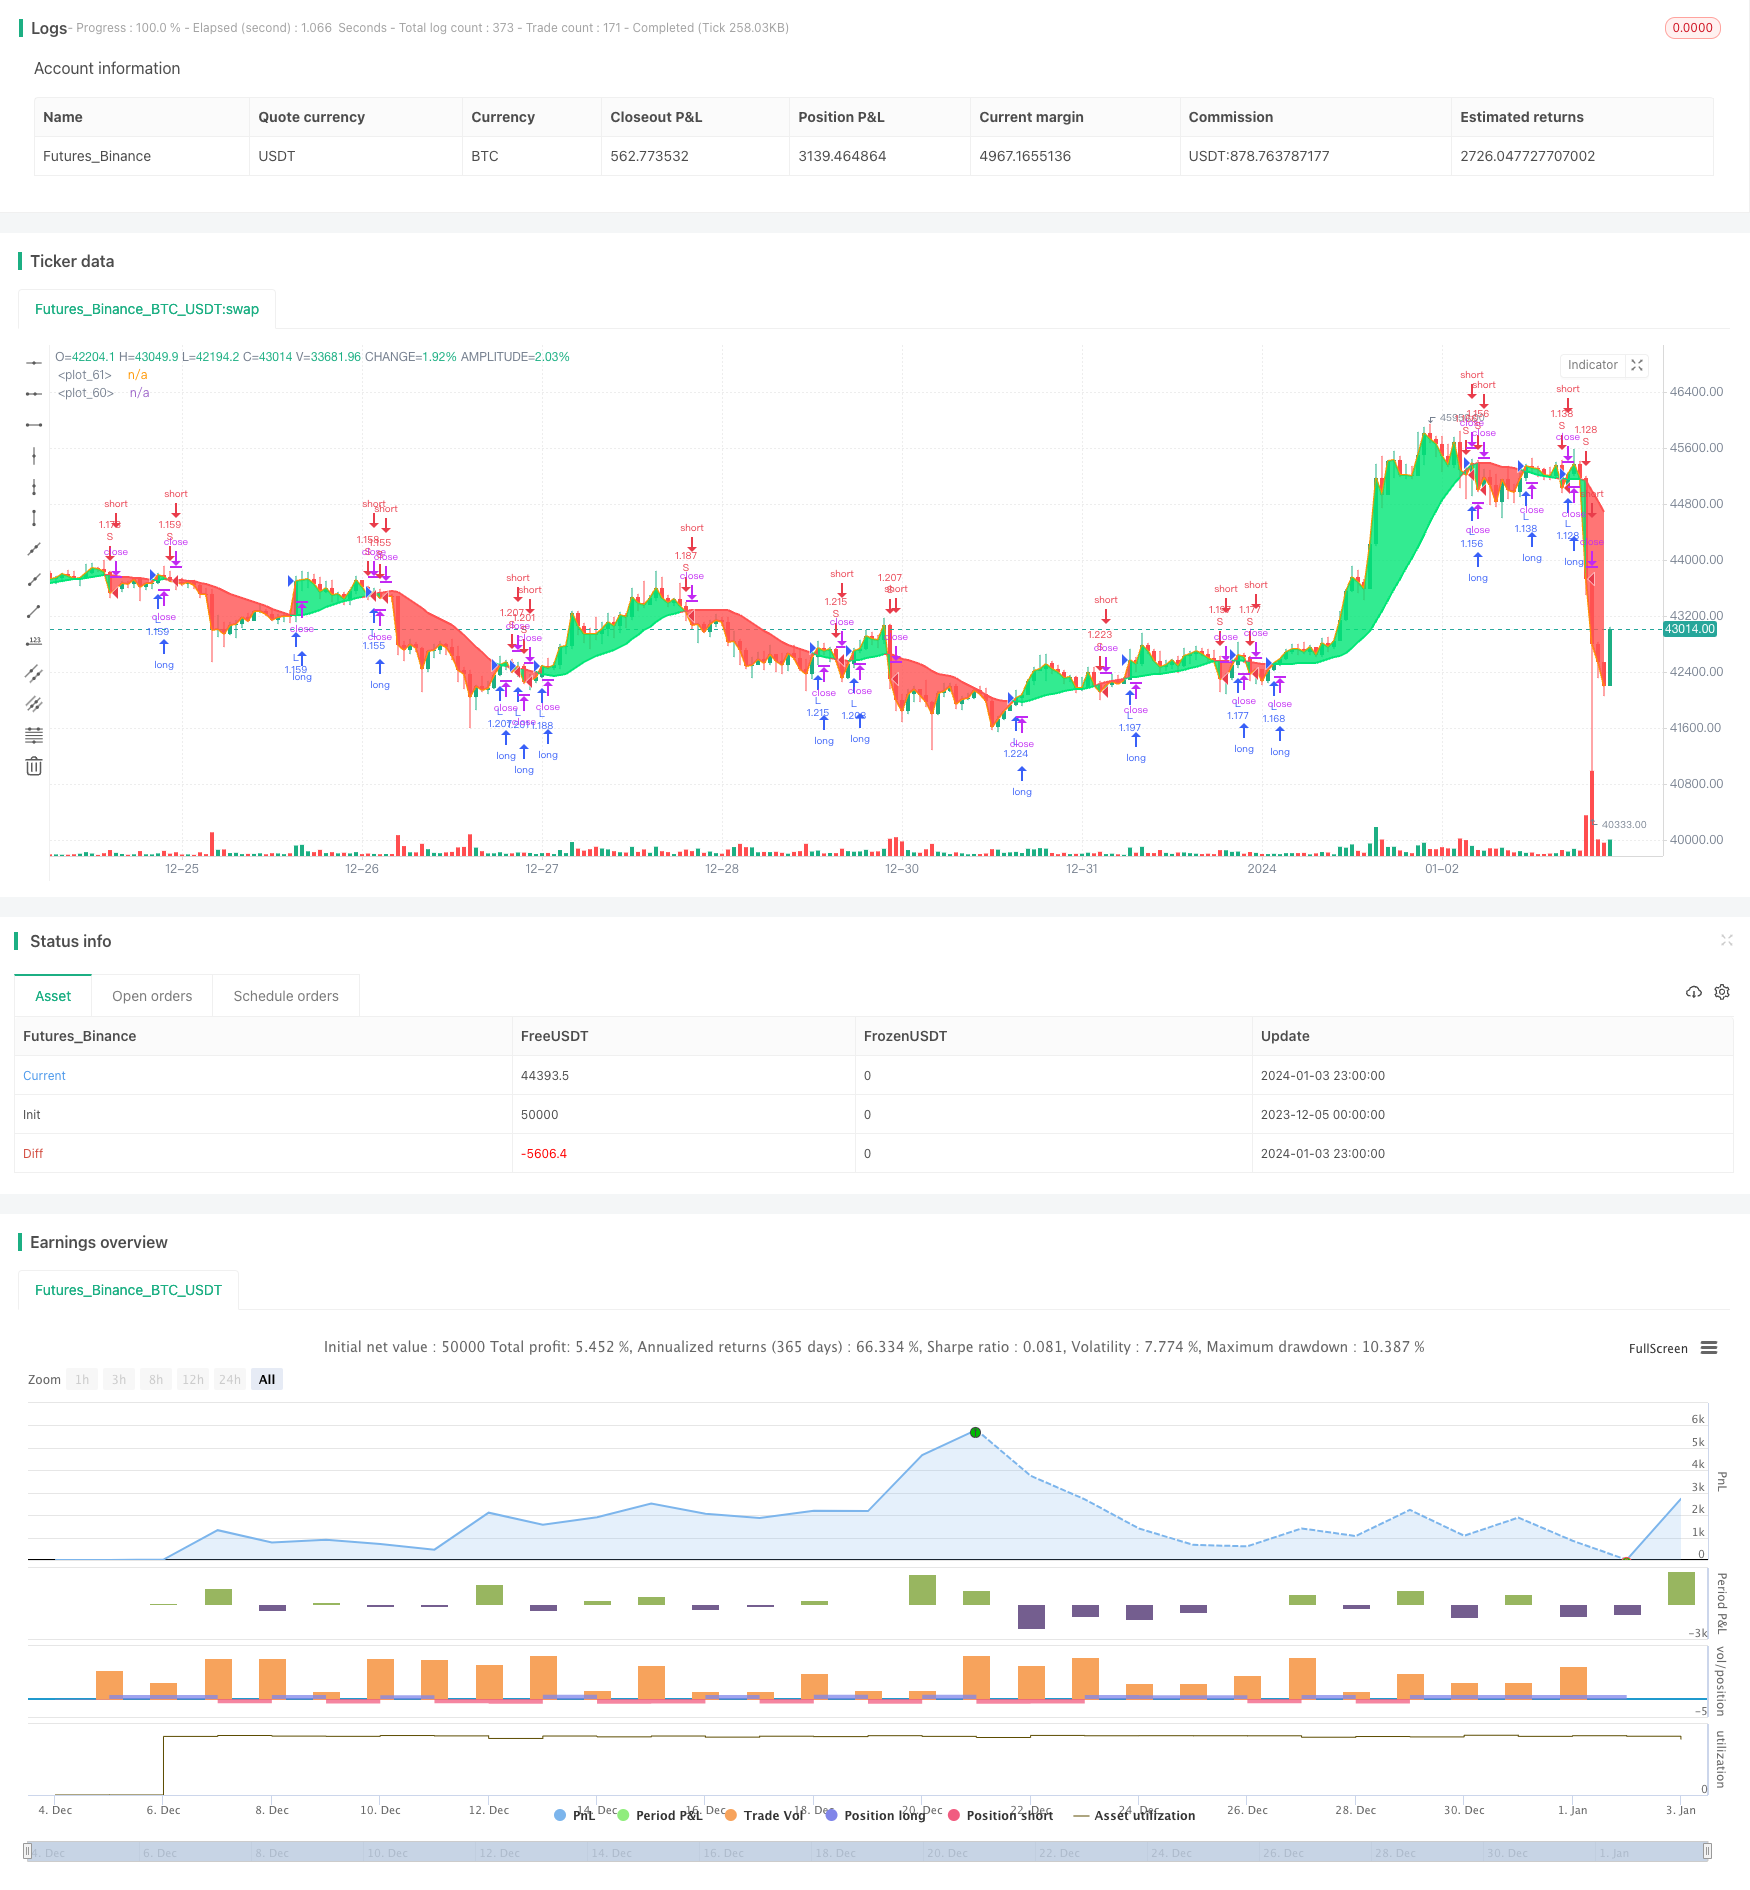
本文讨论的是一个基于简单移动平均线的交易策略。该策略使用长度为17的移动平均线与收盘价进行比较,当收盘价上穿移动平均线时做多,下穿时做空。
策略原理
移动平均线计算
该策略使用以下参数计算移动平均线:
- MA源:默认为OHLC的平均值(OHCL4)
- MA类型:默认为简单移动平均线(SMA)
- MA长度:默认为17
根据这些参数,会调用getMAType()函数计算出17周期的收盘价SMA。
交易信号生成
然后比较收盘价与该移动平均线的关系:
- 收盘价 > 移动平均线:长仓信号
- 收盘价 < 移动平均线:空仓信号
当收盘价从下方上穿移动平均线时,产生做多信号;从上方下穿时,产生做空信号。
交易执行
在回测周期内,遇到做多信号就开多仓,遇到做空信号就开空仓。
优势分析
该策略最大的优势在于思路非常简单清晰。仅仅一个指标,通过其方向的转变来判断趋势的转变。策略容易理解,容易实现,适合新手学习。
另外,移动平均线属于趋势跟踪型指标,能够有效跟踪趋势转变,避免被市场上的短期噪音干扰。
通过参数调整,可以适应不同周期和不同品种。
风险分析
首先,该策略仅基于一个指标,判断标准较为单一,可能会产生更多的错误信号。
并且,该策略属于趋势跟踪系统,无法在盘整和震荡的市场上正常工作。
此外,没有设置止损止盈,存在亏损扩大的风险。
解决方法是结合其它指标,优化参数组合,减少错误信号。设置止损止盈,控制风险,并优化回撤。
优化方向
下面几个方面可以作为策略优化的思路:
调整移动平均线参数,优化周期数。比如改为30周期或50周期等。
尝试不同类型的移动平均线,如EMA,VIDYA等。它们对价格变化的敏感程度不同。
增加其他指标结合。例如与MACD组合,能够判断强弱。或与RSI组合,减少错误信号。
增加止损机制。设定固定百分比或ATR值的移动止损。控制单笔亏损。
增加止盈机制。设定目标利润百分比。让利润最大化。
这些优化能使策略表现更加稳定,避免回撤过大。
总结
本文分析了一个基于17周期移动平均线的简单交易策略。策略信号来源简单,容易理解和实现,属于典型的趋势跟踪系统。通过对策略的深入解读,分析了其优势和风险,并给出了多个维度的优化思路。相信通过不断优化和丰富,该策略可以逐步演化,在实盘中也能获得稳定的收益。
/*backtest
start: 2023-12-05 00:00:00
end: 2024-01-04 00:00:00
period: 1h
basePeriod: 15m
exchanges: [{"eid":"Futures_Binance","currency":"BTC_USDT"}]
*/

//@version=4
strategy("Simple 17 BF 🚀", overlay=true, initial_capital=10000, default_qty_type=strategy.percent_of_equity, default_qty_value=100, commission_type=strategy.commission.percent, commission_value=0.0)

/////////////// Time Frame ///////////////
testStartYear = input(2012, "Backtest Start Year")
testStartMonth = input(1, "Backtest Start Month")
testStartDay = input(1, "Backtest Start Day")
testPeriodStart = timestamp(testStartYear,testStartMonth,testStartDay, 0, 0)

testStopYear = input(2019, "Backtest Stop Year")
testStopMonth = input(12, "Backtest Stop Month")
testStopDay = input(31, "Backtest Stop Day")
testPeriodStop = timestamp(testStopYear,testStopMonth,testStopDay, 0, 0)

testPeriod() => true

///////////// Moving Average /////////////
source = input(title="MA Source", defval=ohlc4)
maType = input(title="MA Type", defval="sma", options=["sma", "ema", "swma", "wma", "vwma", "rma"])
length = input(title="MA Length", defval=17)

///////////// Get MA Function /////////////
getMAType(maType, sourceType, maLen) =>
    res = sma(close, 1)

    if maType == "ema"
        res := ema(sourceType, maLen)
    if maType == "sma"
        res := sma(sourceType, maLen)
    if maType == "swma"
        res := swma(sourceType)
    if maType == "wma"
        res := wma(sourceType, maLen)
    if maType == "vwma"
        res := vwma(sourceType, maLen)
    if maType == "rma"
        res := rma(sourceType, maLen)
    res

MA = getMAType(maType, source, length)

/////////////// Strategy ///////////////
long = close > MA
short = close < MA

last_long = 0.0
last_short = 0.0
last_long := long ? time : nz(last_long[1])
last_short := short ? time : nz(last_short[1])

long_signal = crossover(last_long, last_short)
short_signal = crossover(last_short, last_long)

/////////////// Execution ///////////////
if testPeriod()
    strategy.entry("L", strategy.long, when=long_signal)
    strategy.entry("S", strategy.short, when=short_signal)

/////////////// Plotting ///////////////
p1 = plot(MA, color = long ? color.lime : color.red, linewidth=2)
p2 = plot(close, linewidth=2)
fill(p1, p2, color=strategy.position_size > 0 ? color.lime : strategy.position_size < 0 ? color.red : color.white, transp=80)