Volatility Bands and VWAP Multi-Timeframe Stock Trend Trading Strategy
Author: ChaoZhang, Date: 2024-01-17 16:34:23Tags:

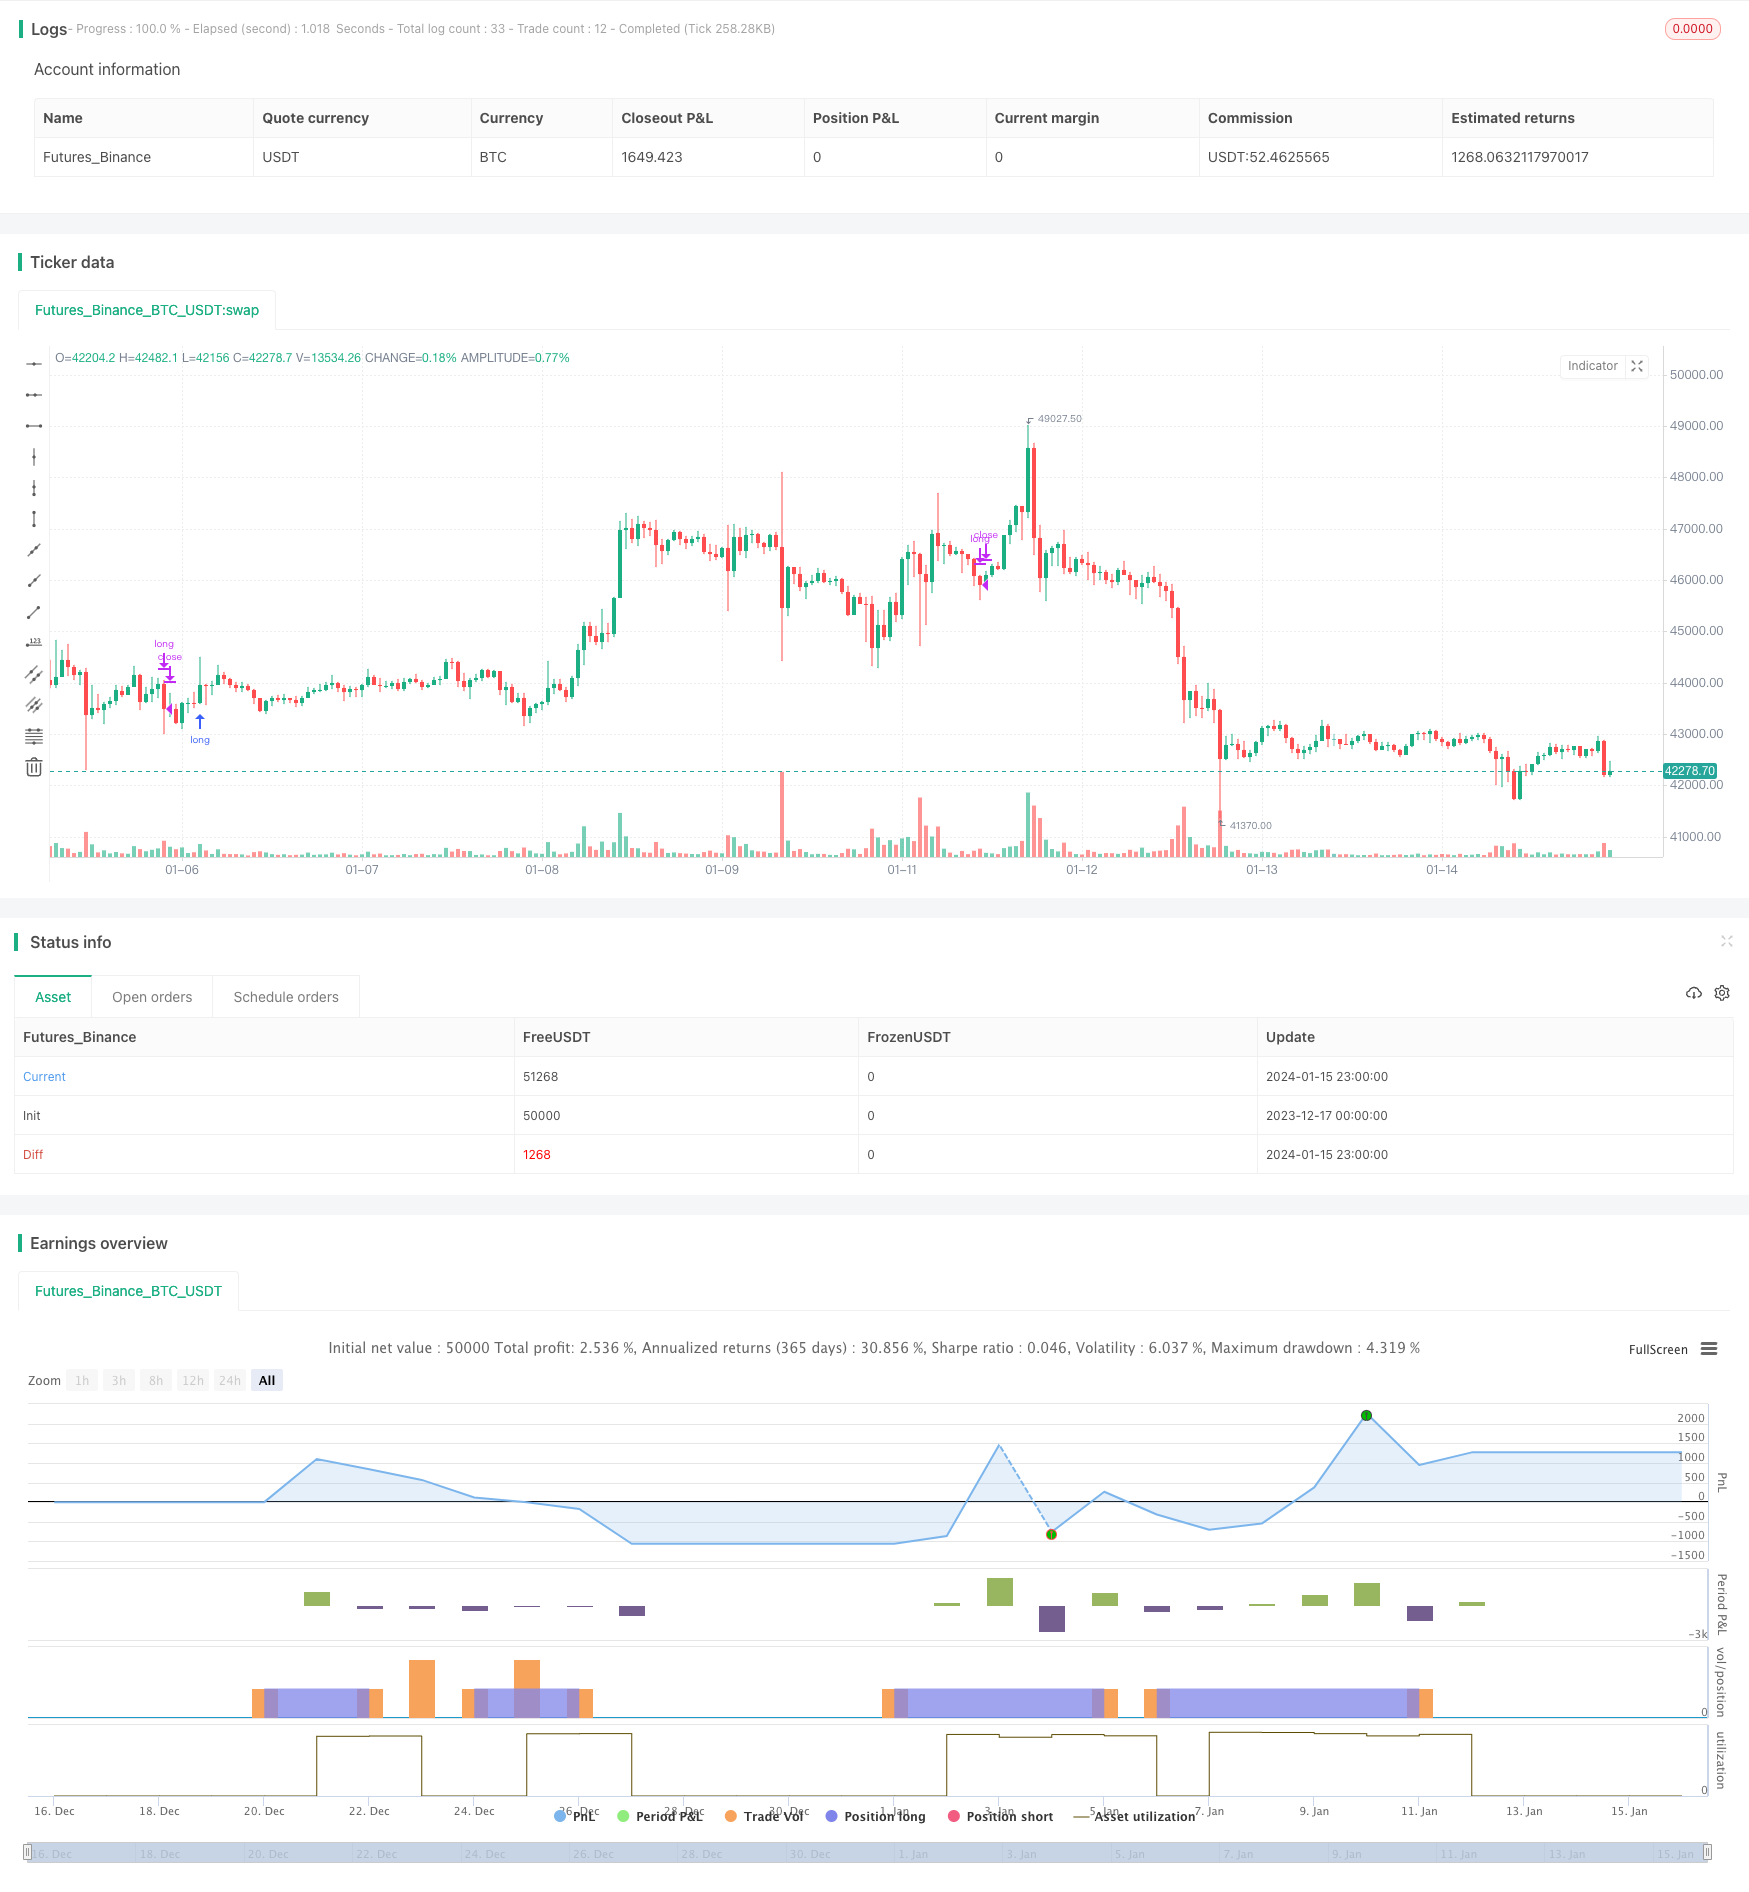
This strategy calculates the ATR volatility of price and combines different period VWAP to set long entry and exit conditions for stock trend trading.
Strategy Overview
The strategy is mainly used for trend tracking of stock products. By calculating the ATR volatility and combining VWAP prices of different periods, it sets buy and sell conditions to judge and track trends. The strategy is flexible enough to switch between long term and short term, suitable for capturing medium and long term trends.
Strategy Logic
The strategy uses the ATR indicator to calculate price volatility and judges the trend direction based on whether the price breaks through the volatility channel. At the same time, it introduces VWAP prices of different cycles to determine the consistency of long and short term trends. The specific logic is as follows:
- Calculate the ATR volatility channel of the price
- Judge if the price breaks through the volatility channel
- Breaking through the upper rail indicates a bullish trend
- Breaking through the lower rail indicates a bearish trend
- Introduce weekly and daily VWAP prices
- When the price breaks through the upper volatility rail, if both daily and weekly VWAPs are above the price, a long signal is generated
- When the price breaks through the lower volatility rail, if both daily and weekly VWAPs are below the price, a short signal is generated
The above is the core logic of the strategy. The ATR volatility judges the short-term trend and the VWAP price judges the long-term trend. The two are combined to determine the consistency of the trend and thus generate trading signals.
Advantages of the Strategy
- Use a combination of ATR and VWAP to judge trends, more reliable
- Customizable ATR period parameter to adjust strategy sensitivity
- Introducing multi-timeframe VWAP to determine long and short term trend consistency
- Flexible to switch between long term and short term
- Suitable for tracking medium and long term stock trends
Risks and Optimization
- As a trend following strategy, it may generate more trades during consolidation, bringing slippage risks
- ATR and VWAP parameter settings impact strategy performance, require careful testing against different products
- Consider adding stop loss to control single trade loss
- Can combine with MA and other indicators to filter entry signals and reduce unnecessary trades
Summary
The strategy realizes stock trend tracking through dual confirmation of ATR volatility and VWAP. There is ample room for optimization by adjusting parameters or incorporating other technical indicators. Overall, the strategy logic is clear and robust for tracking medium to long term trends.
/*backtest
start: 2023-12-17 00:00:00
end: 2024-01-16 00:00:00
period: 1h
basePeriod: 15m
exchanges: [{"eid":"Futures_Binance","currency":"BTC_USDT"}]
*/

// This source code is subject to the terms of the Mozilla Public License 2.0 at https://mozilla.org/MPL/2.0/
// © exlux99

//@version=4
strategy(title="VWAP MTF STOCK STRATEGY", overlay=true )

// high^2 / 2 - low^2 -2

h=pow(high,2) / 2
l=pow(low,2) / 2

o=pow(open,2) /2
c=pow(close,2) /2


x=(h+l+o+c) / 4
y= sqrt(x)

source = y
useTrueRange = false
length = input(27, minval=1)
mult = input(0, step=0.1)
ma = sma(source, length)
range = useTrueRange ? tr : high - low
rangema = sma(range, length)
upper = ma + rangema * mult
lower = ma - rangema * mult
crossUpper = crossover(source, upper)
crossLower = crossunder(source, lower)
bprice = 0.0
bprice := crossUpper ? high+syminfo.mintick : nz(bprice[1])
sprice = 0.0
sprice := crossLower ? low -syminfo.mintick : nz(sprice[1])
crossBcond = false
crossBcond := crossUpper ? true
     : na(crossBcond[1]) ? false : crossBcond[1]
crossScond = false
crossScond := crossLower ? true
     : na(crossScond[1]) ? false : crossScond[1]
cancelBcond = crossBcond and (source < ma or high >= bprice )
cancelScond = crossScond and (source > ma or low <= sprice )

longOnly = true

fromDay = input(defval = 1, title = "From Day", minval = 1, maxval = 31)
fromMonth = input(defval = 1, title = "From Month", minval = 1, maxval = 12)
fromYear = input(defval = 2000, title = "From Year", minval = 1970)
 //monday and session
// To Date Inputs
toDay = input(defval = 31, title = "To Day", minval = 1, maxval = 31)
toMonth = input(defval = 12, title = "To Month", minval = 1, maxval = 12)
toYear = input(defval = 2021, title = "To Year", minval = 1970)

startDate = timestamp(fromYear, fromMonth, fromDay, 00, 00)
finishDate = timestamp(toYear, toMonth, toDay, 00, 00)
time_cond = true

srcX = input(ohlc4)
t = time("W")
start = na(t[1]) or t > t[1]

sumSrc = srcX * volume
sumVol = volume
sumSrc := start ? sumSrc : sumSrc + sumSrc[1]
sumVol := start ? sumVol : sumVol + sumVol[1]

vwapW= sumSrc / sumVol


//crossUpper = crossover(source, upper)
//crossLower = crossunder(source, lower)
shortCondition = close < vwap and time_cond and (close < vwapW)
longCondition = close > vwap and time_cond and (close > vwapW)


if(longOnly and time_cond)
    if (crossLower and close < vwapW )
        strategy.close("long")
    if (crossUpper and close>vwapW)
        strategy.entry("long", strategy.long, stop=bprice)
- Dual Moving Average Strategy
- Momentum Moving Average Crossover Trading Strategy
- Dual Moving Average Golden Cross Strategy
- Momentum Wave Bollinger Bands Trend Strategy
- Reverse Momentum Trading Strategy
- Bandpass Mean PB Indicator Strategy
- RSI & Fibonacci 5-Minute Trading Strategy
- Triple Moving Average Combined with MACD Quantitative Strategy
- Momentum Breakout Optimization
- Baseline Cross Qualifier ATR Volatility & HMA Trend Bias Mean Reversion Strategy
- Price Reversal with Crossover Capturing Strategy
- Ehlers Stochastic Cyber Cycle Strategy
- Breakthrough of Daily High-low Price Based on Fibonacci Levels
- Improved SuperTrend Strategy
- Quantitative Trading Strategy Integrating MACD, RSI and RVOL
- Momentum Inversion Tracking Strategy
- Trend Following Strategy Based on EMA and SMA Crossover
- Simple Pivot Reversal Algorithmic Trading Strategy
- Adaptive Trading Strategy Based on ADX Indicator
- Dynamic Channel Breakout Strategy