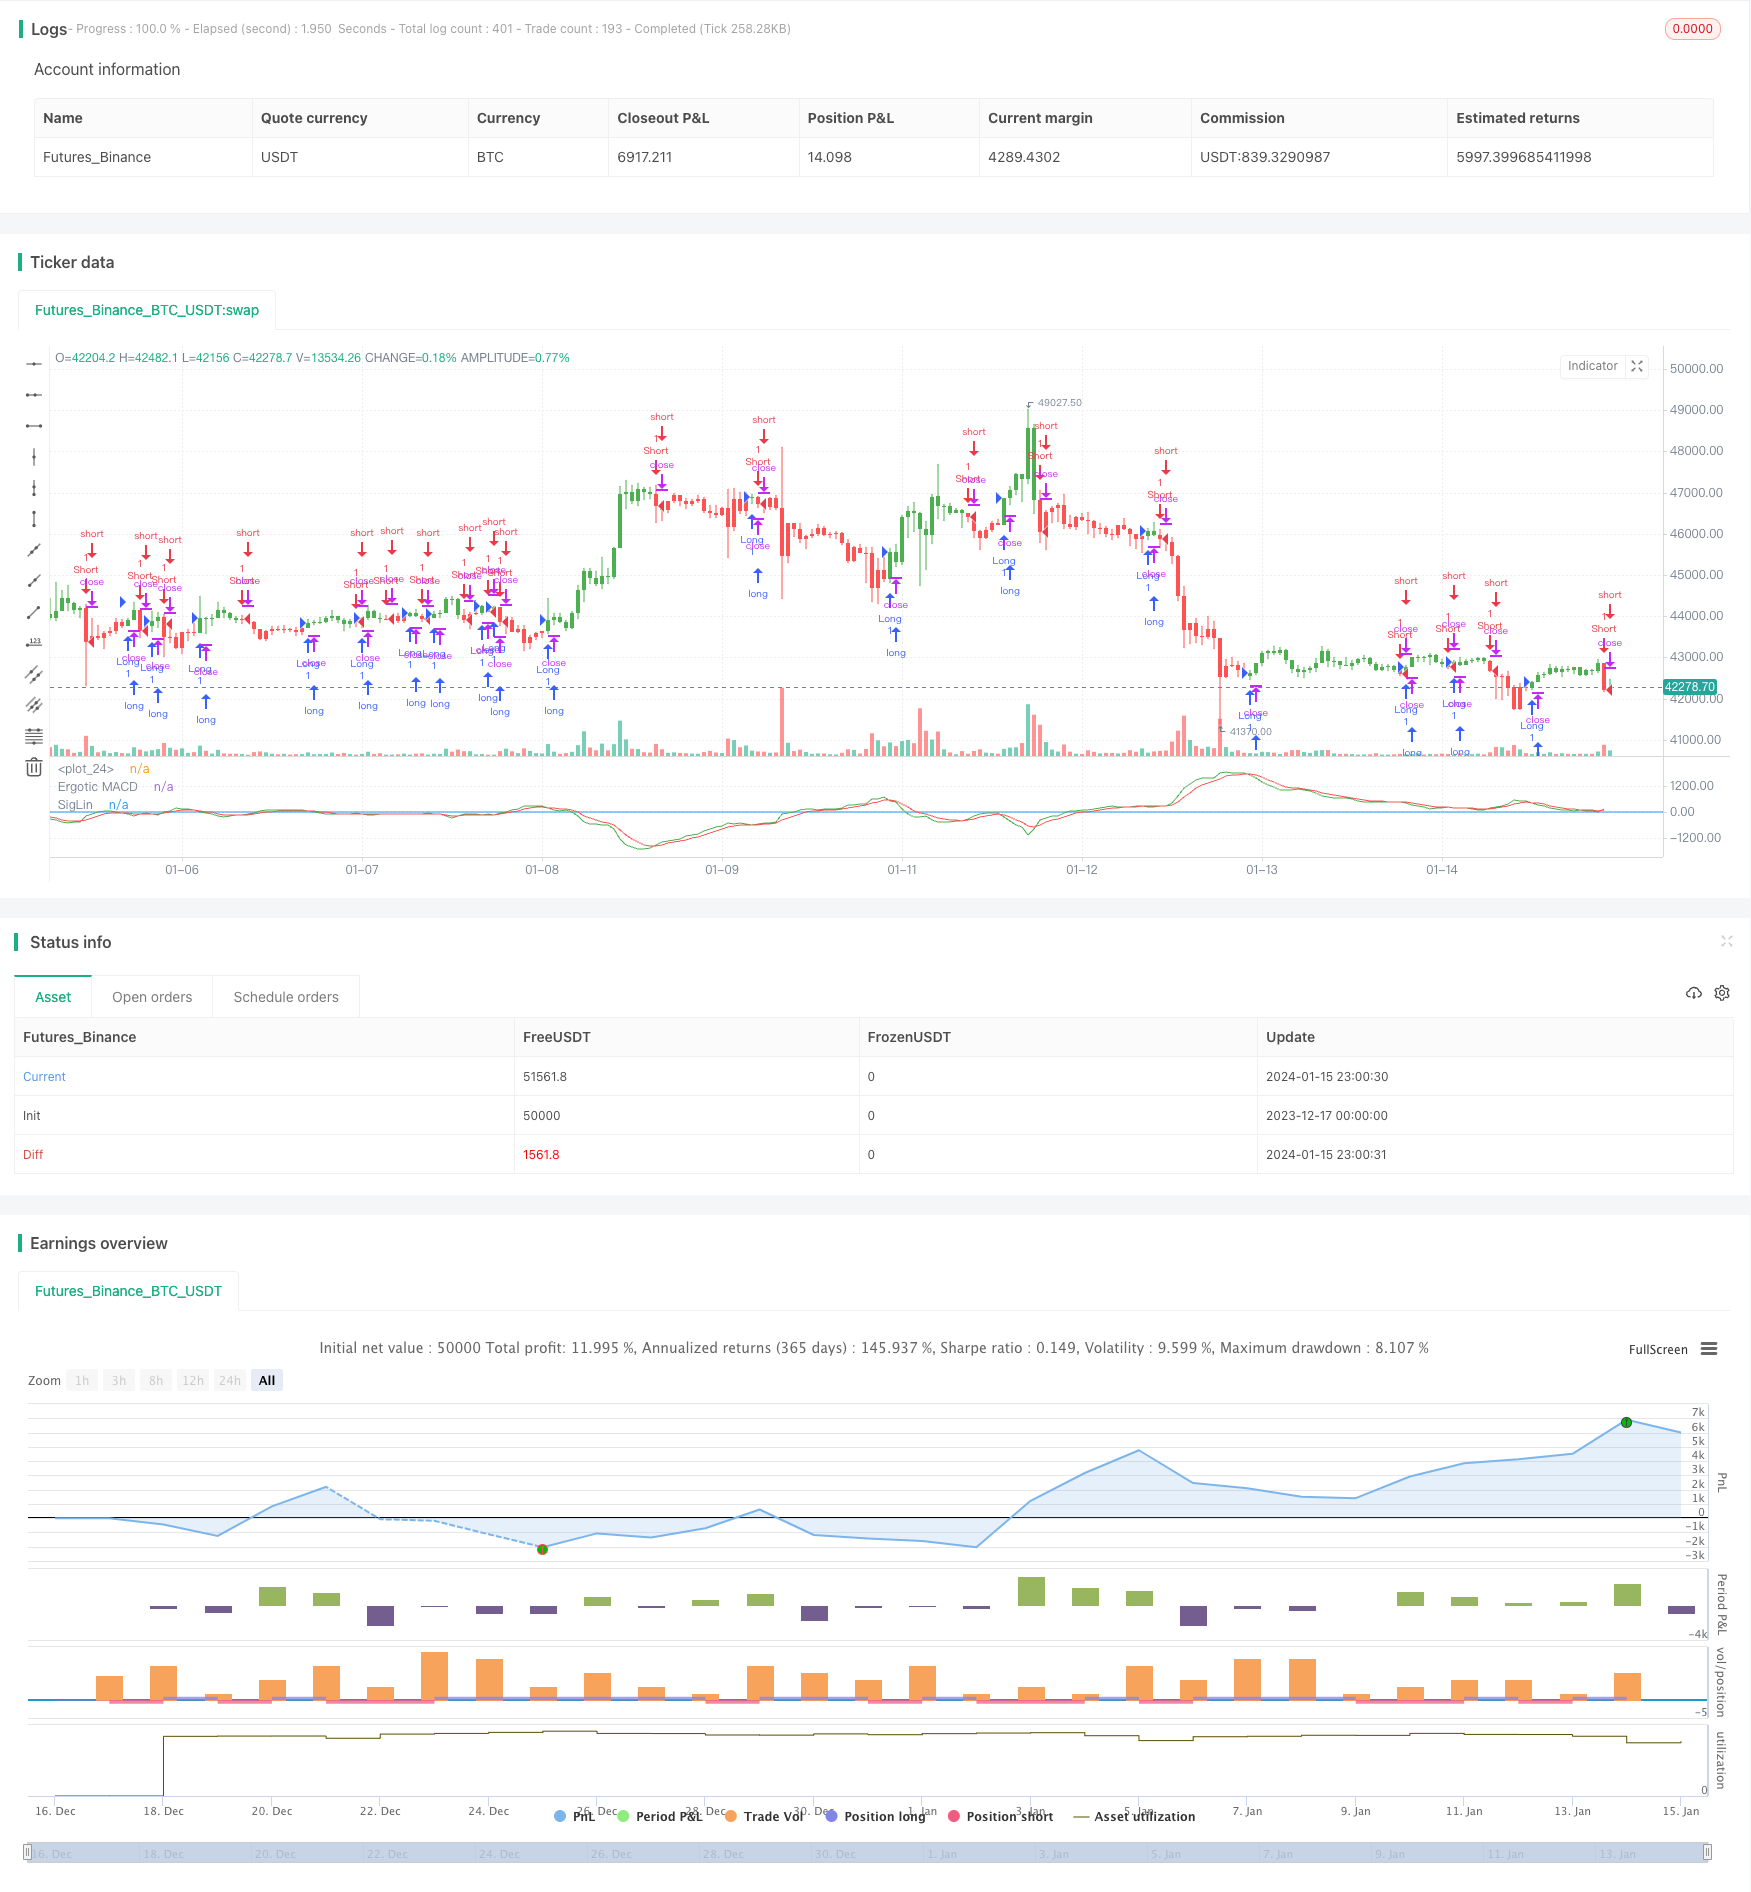
Reverse Momentum Trading Strategy
Author: ChaoZhang, Date: 2024-01-17 17:29:08Tags:

Overview
The Reverse Momentum Trading Strategy is a short-term trading strategy based on an improved MACD indicator. The strategy draws on the ideas proposed by William Blau in his book “Momentum, Direction and Divergence”, using the relationship between price and momentum to construct a custom MACD indicator that has the opposite meaning to the standard MACD indicator. It takes reverse operations at the indicator buy and sell signals, i.e. go long on sell signals and go short on buy signals.
Strategy Logic
The core indicator of the strategy is the improved MACD. Its formula is:
fastMA = ema(close, 32)
slowMA = ema(close, 5)
xmacd = fastMA - slowMA
xMA_MACD = ema(xmacd, 5)
Where fastMA is the 32-period exponential moving average, slowMA is the 5-period exponential moving average. The difference between the two moving averages makes up xmacd, and xMA_MACD is the 5-period exponential moving average of xmacd.
A sell signal is generated when xmacd crosses above xMA_MACD, and a buy signal is generated when xmacd crosses below xMA_MACD. The signal meanings are opposite to the standard MACD indicator, where the standard MACD issues buy signals when crossing up and sell signals when crossing down.
Advantages
-
Captures potential trend reversal opportunities using price-momentum relationship.
-
Improved MACD settings more scientific, parameters optimized, helps avoid false signals.
-
Unique reverse operation idea increases strategy diversity.
-
Profitable in both trending and range-bound markets.
Risks
-
High risk in reverse trading, use with caution.
-
Avoid stops too tight resulting in stop-outs. Can loosen stops to lower risk.
-
Beware of missing reversal signals. Can optimize parameters to reduce signal loss.
-
Avoid low efficiency leading losses. Can test parameters on different products to select higher efficiency ones.
Optimization
-
Test different long and short term parameter combinations to optimize indicator patterns.
-
Add trend judgment indicators to avoid extreme market volatility periods.
-
Incorporate technical tools like Elliott Waves, supports & resistances to determine potential reversal opportunities.
-
Optimize stop mechanisms to prevent over-aggressive stop-outs.
Conclusion
The Reverse Momentum Trading Strategy integrates various technical analysis theories and indicator signals to capture reversal opportunities when price diverges from momentum. With its innovative logic, it has strong practical value. But the high risks in reverse trading calls for strict money management, careful parameter optimization and risk control to generate steady profits.
/*backtest
start: 2023-12-17 00:00:00
end: 2024-01-16 00:00:00
period: 1h
basePeriod: 15m
exchanges: [{"eid":"Futures_Binance","currency":"BTC_USDT"}]
*/

//@version = 2
////////////////////////////////////////////////////////////
//  Copyright by HPotter v1.0 09/12/2016
// This is one of the techniques described by William Blau in his book
// "Momentum, Direction and Divergence" (1995). If you like to learn more,
// we advise you to read this book. His book focuses on three key aspects
// of trading: momentum, direction and divergence. Blau, who was an electrical
// engineer before becoming a trader, thoroughly examines the relationship
// between price and momentum in step-by-step examples. From this grounding,
// he then looks at the deficiencies in other oscillators and introduces some
// innovative techniques, including a fresh twist on Stochastics. On directional
// issues, he analyzes the intricacies of ADX and offers a unique approach to help
// define trending and non-trending periods.
// Blau`s indicator is like usual MACD, but it plots opposite of meaningof
// stndard MACD indicator.
//
// You can change long to short in the Input Settings
// Please, use it only for learning or paper trading. Do not for real trading.
////////////////////////////////////////////////////////////
strategy(title="Ergotic MACD Strategy Backtest")
r = input(32, minval=1)
SmthLen = input(5, minval=1)
reverse = input(false, title="Trade reverse")
hline(0, color=blue, linestyle=line)
source = close
fastMA = ema(source, r)
slowMA = ema(source, 5)
xmacd = fastMA - slowMA
xMA_MACD = ema(xmacd, 5)
pos = iff(xmacd < xMA_MACD, 1,
	   iff(xmacd > xMA_MACD, -1, nz(pos[1], 0)))
possig = iff(reverse and pos == 1, -1,
          iff(reverse and pos == -1, 1, pos))
if (possig == 1)
    strategy.entry("Long", strategy.long)
if (possig == -1)
    strategy.entry("Short", strategy.short)
barcolor(possig == -1 ? red: possig == 1 ? green : blue )
plot(xmacd, color=green, title="Ergotic MACD")
plot(xMA_MACD, color=red, title="SigLin")
- NoroBands Momentum Position Strategy
- Dual Confirmation Reversal Trend Tracking Strategy
- MACD Indicator Driven OBV Quant Trading Strategy
- Dollar Cost Averaging After Downtrend Strategy
- Triple Indicators Sentiment Driven Breakout Strategy
- A Trend Reversal Strategy Based on Moving Averages, Price Patterns and Volume
- Dual Moving Average Strategy
- Momentum Moving Average Crossover Trading Strategy
- Dual Moving Average Golden Cross Strategy
- Momentum Wave Bollinger Bands Trend Strategy
- Bandpass Mean PB Indicator Strategy
- RSI & Fibonacci 5-Minute Trading Strategy
- Triple Moving Average Combined with MACD Quantitative Strategy
- Momentum Breakout Optimization
- Baseline Cross Qualifier ATR Volatility & HMA Trend Bias Mean Reversion Strategy
- Volatility Bands and VWAP Multi-Timeframe Stock Trend Trading Strategy
- Price Reversal with Crossover Capturing Strategy
- Ehlers Stochastic Cyber Cycle Strategy
- Breakthrough of Daily High-low Price Based on Fibonacci Levels
- Improved SuperTrend Strategy