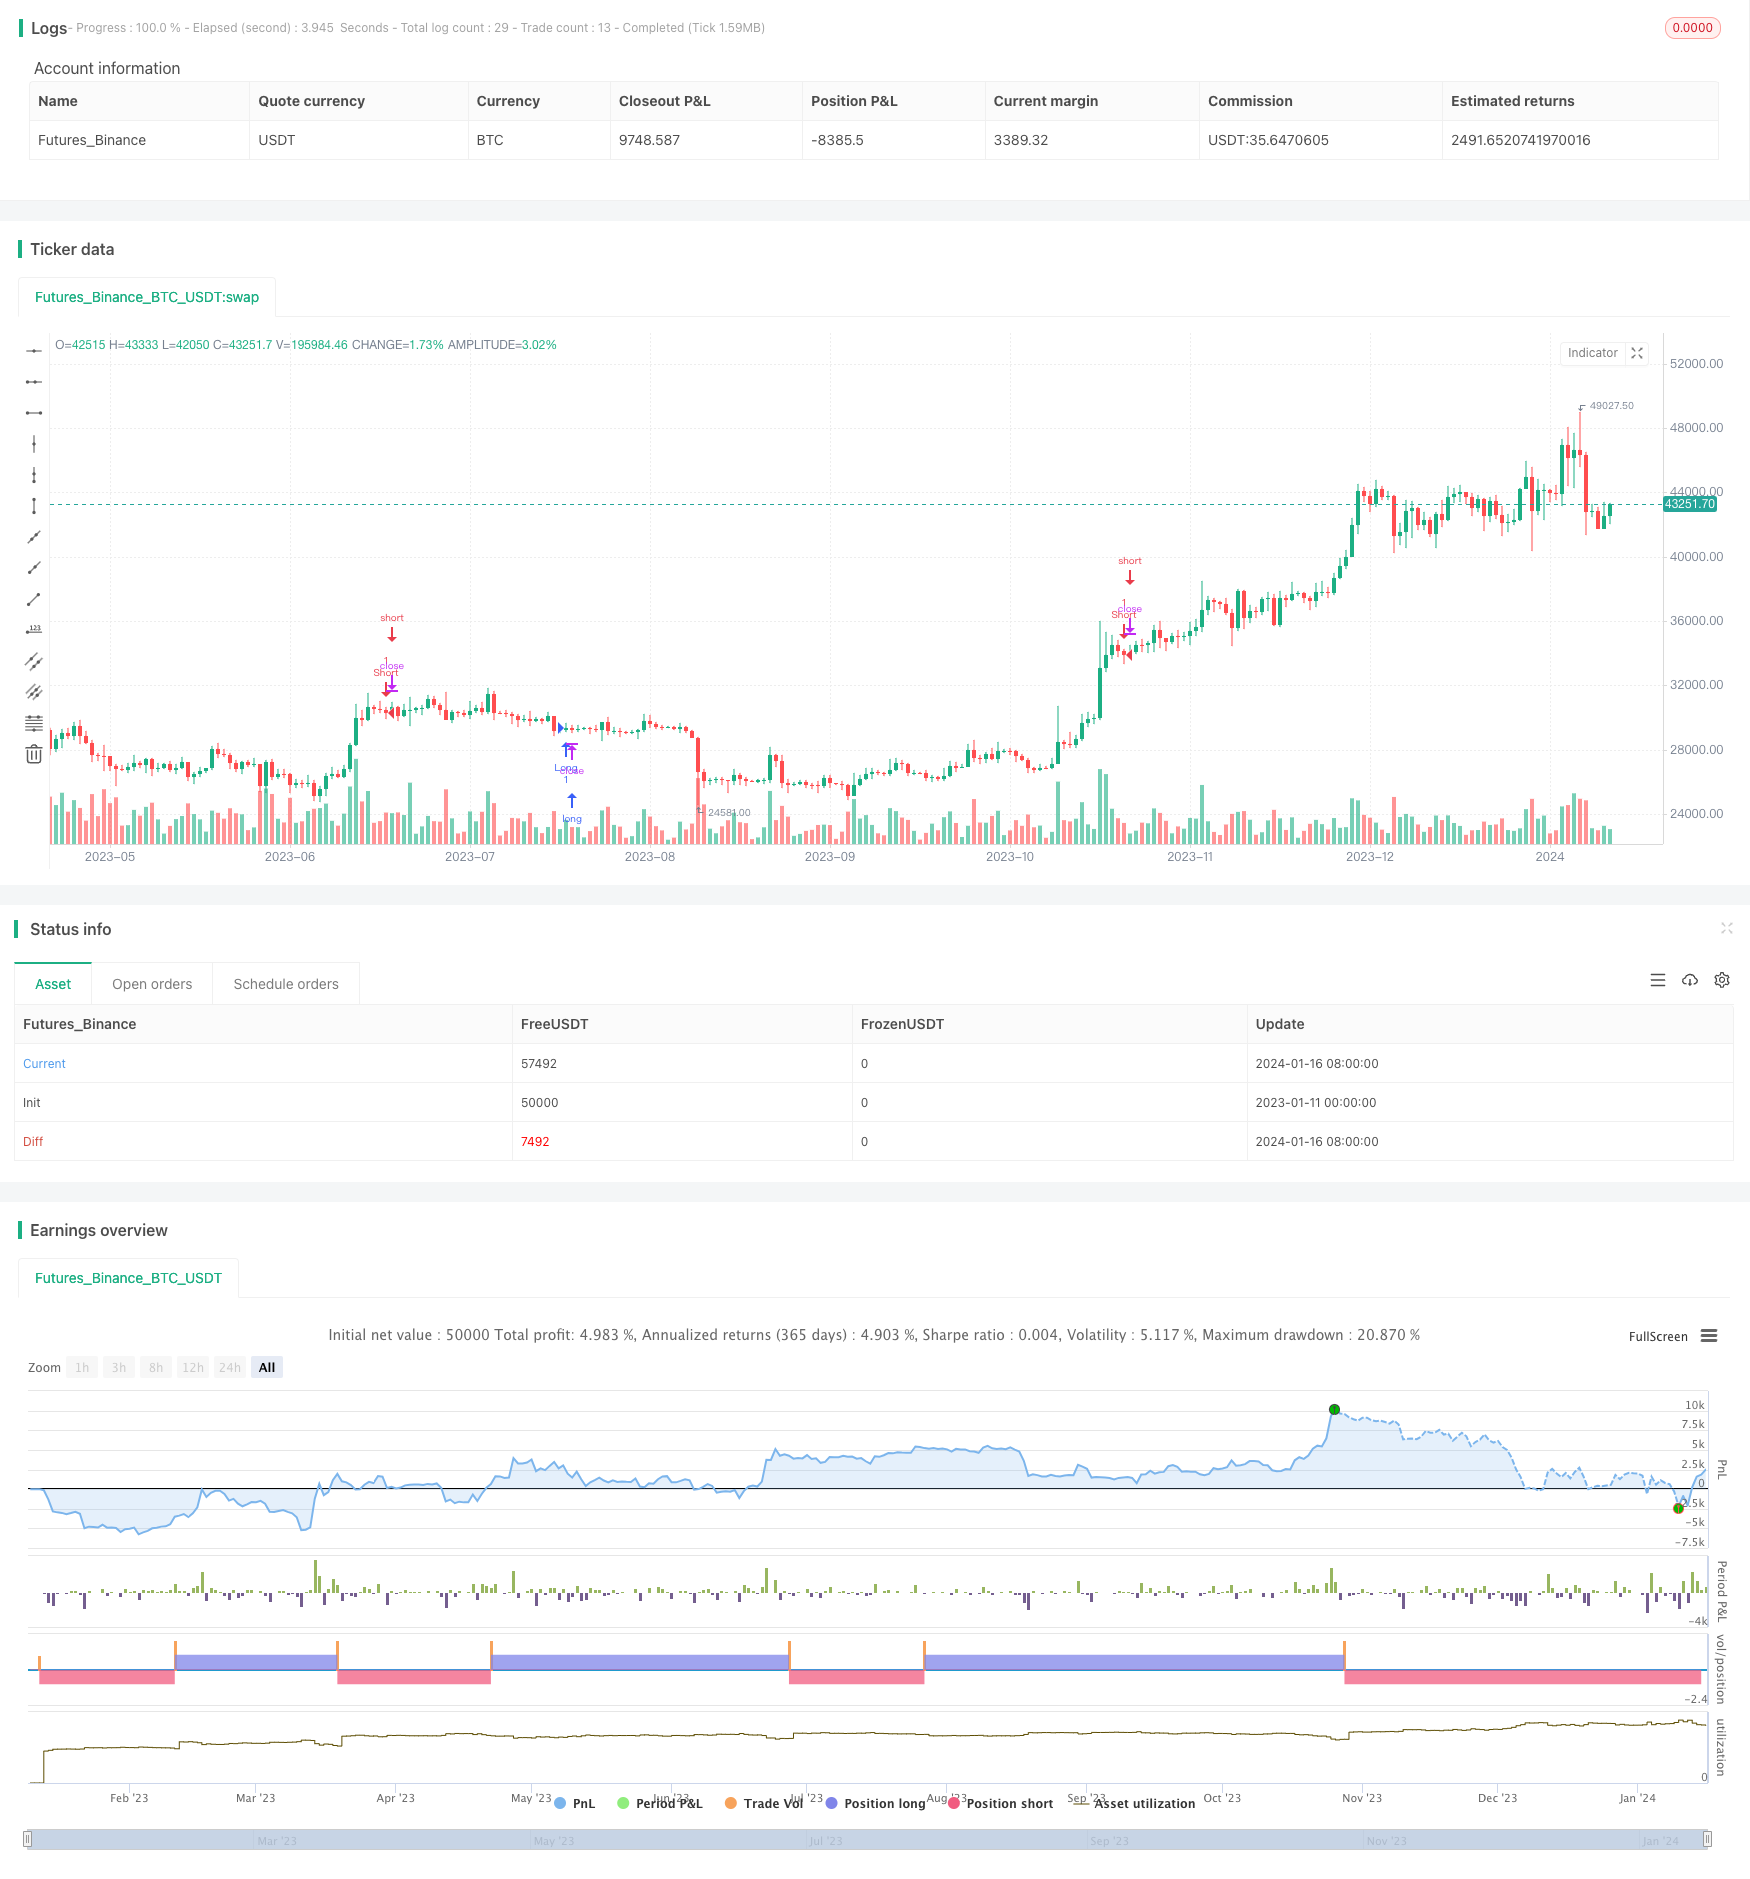
Parabolic SAR, Stoch and Security Indicator Based Multi-Timeframe Quantitative Trading Strategy
Author: ChaoZhang, Date: 2024-01-18 11:40:38Tags:

Overview
This strategy is called “Triple Insurance” quantitative trading strategy. It combines the signals of Parabolic SAR, Stoch and Security indicators to capture breakout trends. The multi-timeframe analysis realizes more stable and reliable trading decisions through the combination of different periodic indicators.
Strategy Logic
This strategy uses the Parabolic SAR indicator to determine the trend direction and reversal timing. The Stoch indicator judges whether it is overbought or oversold. The Security function extracts the direction of longer cycle moving averages to determine the overall trend. The three are combined to form trading decisions:
-
When the Parabolic SAR dots convert to the downside, it is considered a bullish signal; when the dots turn upwards, it indicates bearishness.
-
Stoch K values below 20 are considered oversold, and above 80 are considered overbought. It is bullish during oversold and bearish during overbought.
-
The Security function calls longer cycle moving averages to determine the overall trend direction, enabling combined analysis between different time cycles.
When the above three indicators give bullish signals, go long. When giving bearish signals, go short. Strictly follow the principle of multiple indicator filtering to effectively filter out false breakouts and lock in true trends.
Advantages
The biggest advantage of this strategy lies in its multi-timeframe analysis. The three indicators judge price behavior respectively at short-term, medium-term and long-term levels. Parabolic SAR captures reversal timing and short-term trends. Stoch determines overbought and oversold conditions at present. The Security function determines the overall trend direction. The three complement each other to avoid interference from false breakouts effectively and seize opportunities of trend establishment.
At the same time, this strategy adopts multiple indicators for judgement and filtering to minimize the probability of misjudgement from a single one. The successive pass of triple confirmation ensures sufficient signal strength thus the correctness of trading decisions.
Risks
The main risks of this strategy lie in the appropriateness of indicator parameter settings. The step size and maximum step size of Parabolic SAR directly affect the speed of capturing reversals. The K value and D value smoothing cycles of Stoch need to match market characteristics. The selection cycle of the Security function also affects judgement. Improper settings of these key parameters may all lead to wrong trading decisions of the strategy.
In addition, the principle of multi-timeframe analysis emphasizes the combination of indicators across periods. However, how to deal with divergences between long and short cycle indicators is also a problem worth paying attention to. A possible solution is to determine the overall direction with trend indicators and pinpoint specific exit timing using BREAKOUT indicators.
Optimization Directions
The main directions for further optimization of this strategy are in the following three aspects:
-
Increase adaptive step size mechanism. Allow Parabolic SAR parameters to adjust based on the degree of market volatility to better capture reversals.
-
Add stop loss mechanism. Exit with stop loss when price breaks a certain level towards the unfavorable direction. Control single transaction loss.
-
Introduce machine learning techniques. Use algorithms to train the correlation between price behaviors across different time periods. Strategy parameters combining different time frames can also be optimized through algorithms.
Conclusion
The “Triple Insurance” quantitative strategy makes full use of the complementary advantages of Parabolic SAR, Stoch and Security indicators. They judge the consistency of market behaviors from the dimensions of short-term trends, overbought/oversold levels and long-term moving averages to construct a stable and reliable trading strategy. Using multiple indicators helps filter out false signals. Multi-timeframe usage enables decision-making on the premise that verification is obtained across both short and long cycles. In general, this strategy has strong integration and high practicality, making it worthwhile for further research and application.
/*backtest
start: 2023-01-11 00:00:00
end: 2024-01-17 00:00:00
period: 1d
basePeriod: 1h
exchanges: [{"eid":"Futures_Binance","currency":"BTC_USDT"}]
*/

//@version=5
strategy(title='kyenji', shorttitle='kyenji90', overlay=true)

// Parabolic SAR
parabolicSARStart=input.float(0.01)
parabolicSARInc=input.float(0.01)
parabolicSARMax=input.float(0.2)
psarDot = ta.sar(parabolicSARStart,parabolicSARInc,parabolicSARMax)
longConditionPSAR = psarDot > close
shortConditionPSAR = psarDot < close

// Stoch
periodK = input.int(14, title="K", minval=1)
periodD = input.int(3, title="D", minval=1)
smoothK = input.int(3, title="Smooth", minval=1)
k = ta.sma(ta.stoch(close, high, low, periodK), smoothK)
d = ta.sma(k, periodD)
h0 = 80
h1 = 20
longConditionStoch = k < h1
shortConditionStoch = k > h0

// Security
securityPeriod=input('180')
longConditionSecurity = ta.crossover(request.security(syminfo.tickerid, securityPeriod, close),request.security(syminfo.tickerid, securityPeriod, open))
shortConditionSecurity = ta.crossunder(request.security(syminfo.tickerid, securityPeriod, close),request.security(syminfo.tickerid, securityPeriod, open))

// Generate Signal
longCondition = longConditionSecurity and longConditionPSAR and longConditionStoch
shortCondition = shortConditionSecurity and shortConditionPSAR and shortConditionStoch

if (longCondition)
    strategy.entry("Long", strategy.long)

if (shortCondition)
    strategy.entry("Short", strategy.short)
- Momentum Tracking Strategy Based on Ichimoku Cloud
- Dynamic Support and Resistance Channel Breakout
- ATR-based SuperTrend Strategy
- Trend Following Strategy Based on Moving Averages
- Parabolic SAR Trend Tracking Strategy
- Bollinger Bands Breakout Strategy
- Multi-factor Moving Average Trend Following Strategy
- Multi Timeframe Trend Tracking Strategy
- Weekly Breakthrough Moving Average Trading Strategy
- RSI+Bollinger Bands Breakout Strategy at Lower Area
- Gold Fast Breakthrough EMA Trading Strategy
- Dual-Factor Momentum Tracking Reversal Strategy
- Momentum Reversal Trading Strategy
- Bollinger Band and RSI Mixing with DCA Strategy
- Emma Pullback Short Strategy
- NoroBands Momentum Position Strategy
- Dual Confirmation Reversal Trend Tracking Strategy
- MACD Indicator Driven OBV Quant Trading Strategy
- Dollar Cost Averaging After Downtrend Strategy
- Triple Indicators Sentiment Driven Breakout Strategy