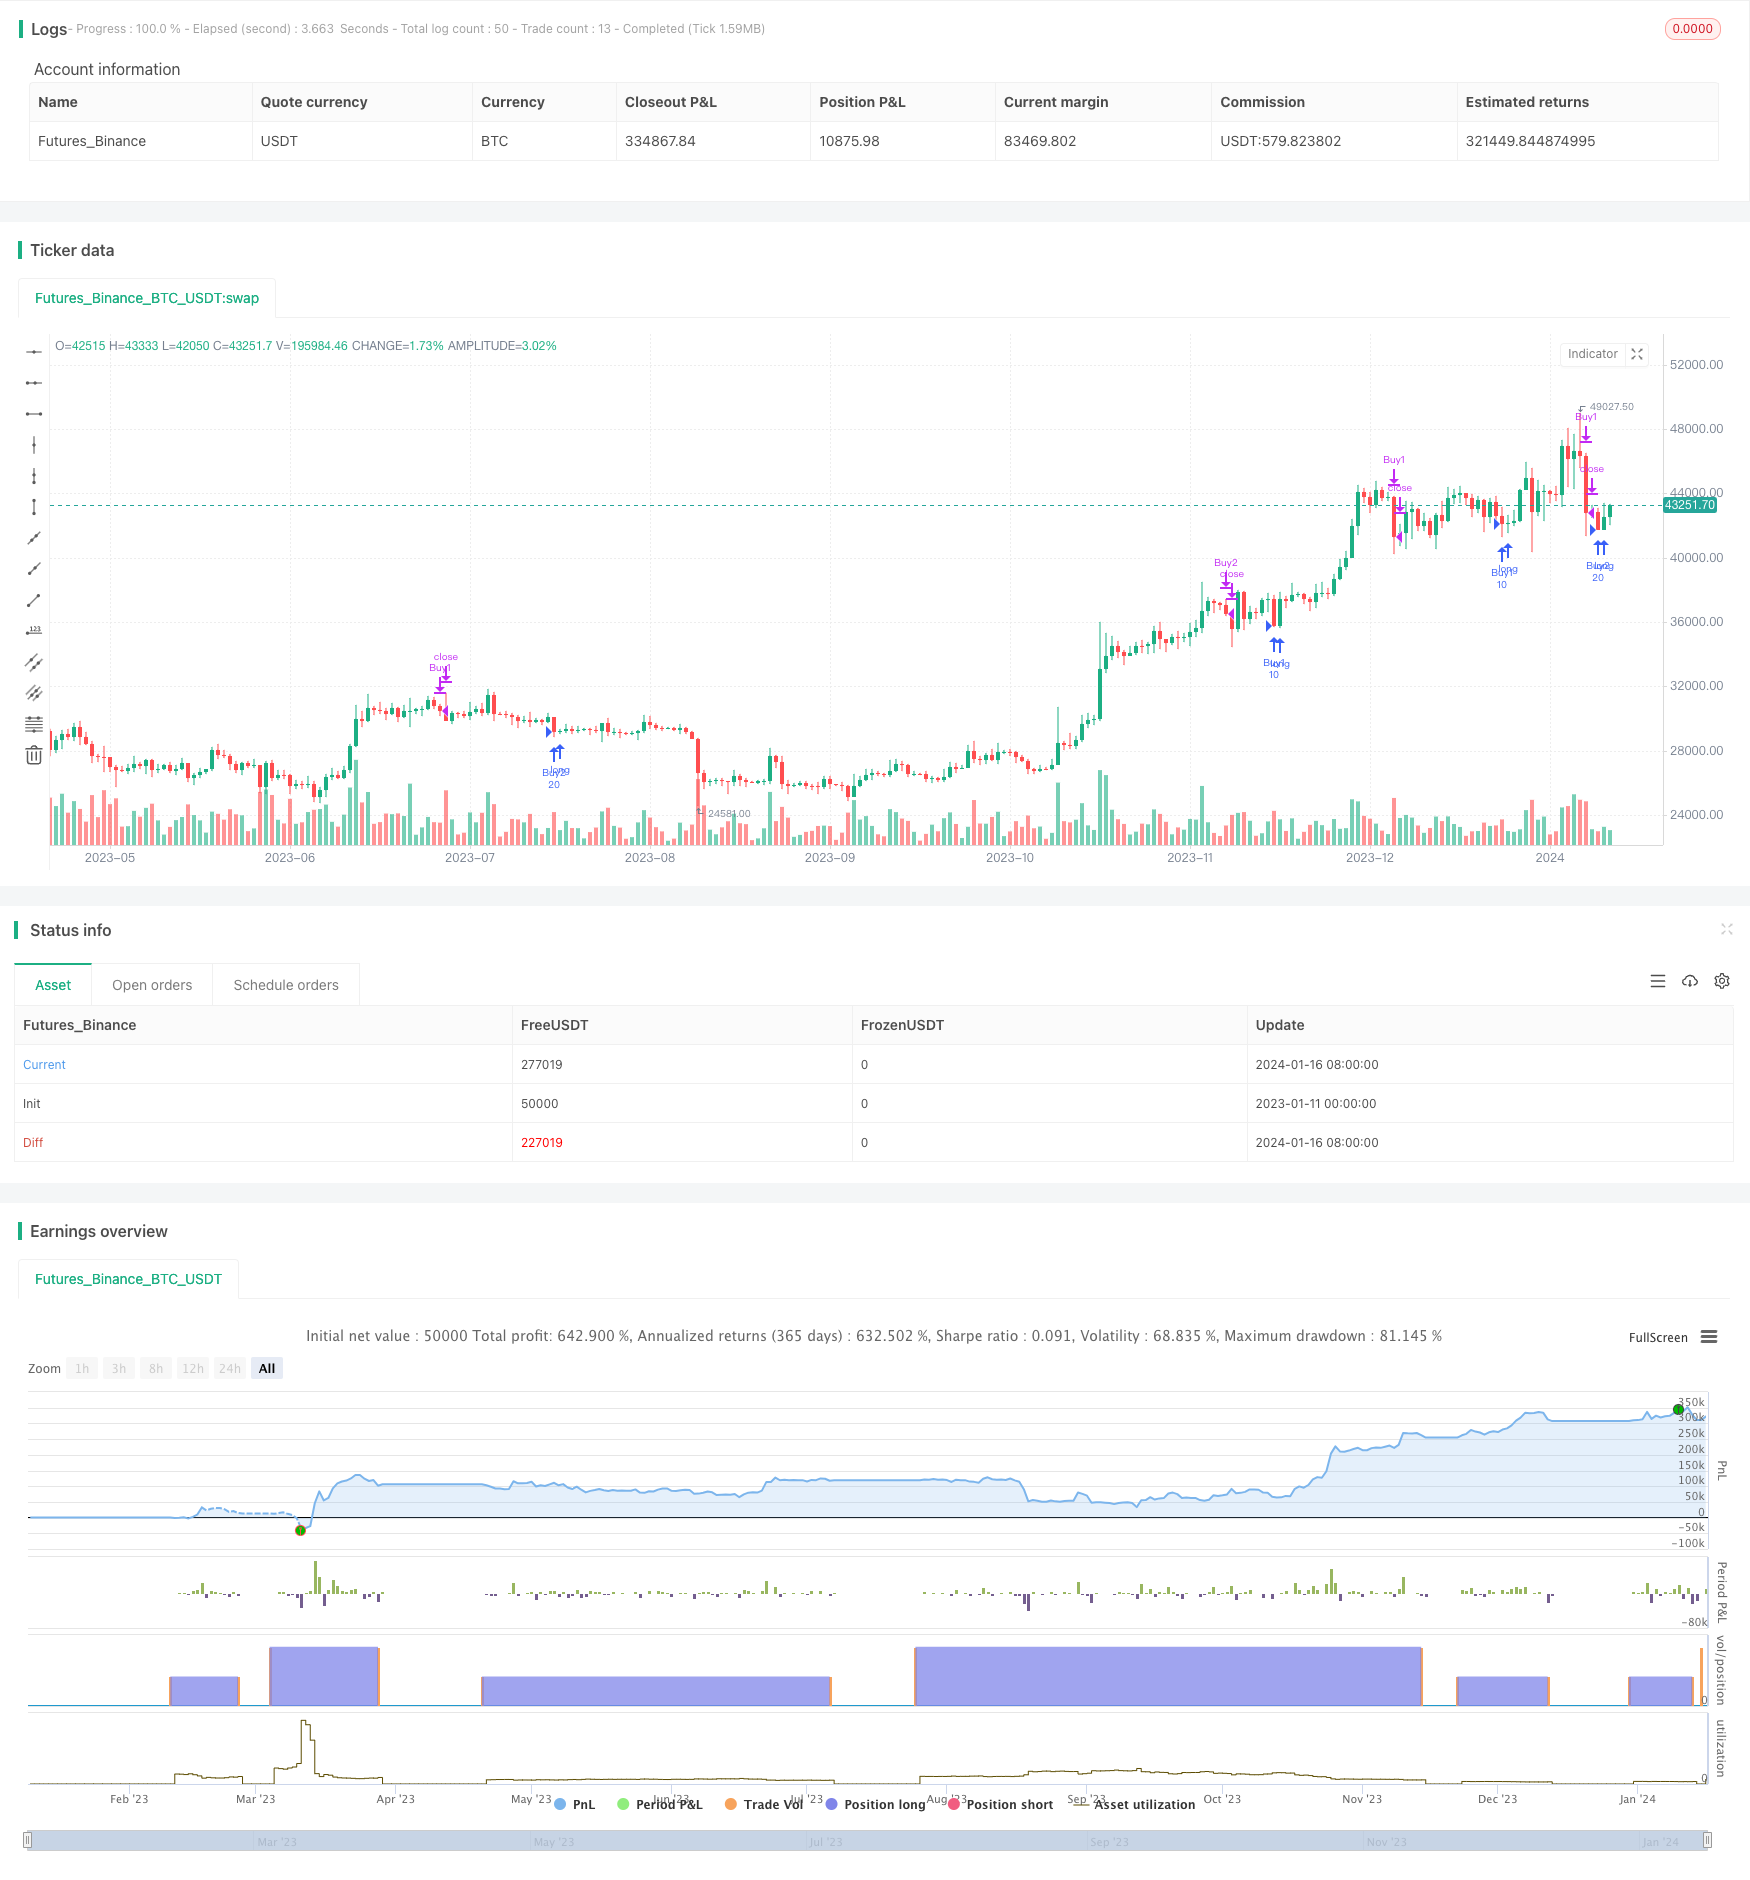
概述
该策略是基于均线的趋势追踪策略。它利用不同周期的EMA均线构建多组交易信号,实现了趋势追踪交易。当价格跌破较长周期的均线时逐步加仓做多,实现了价格平均成本的降低。策略同时设定止损条件,在短周期均线转折时止损退出,锁定收益。
策略原理
该策略使用5条不同周期的EMA均线构建交易信号。分别是10日线、20日线、50日线、100日线和200日线。策略根据价格与这些均线的关系设定4组买入条件,实现金字塔加仓。
当价格低于20日线且高于50日线时,触发第一组买入;当价格低于50日线且高于100日线时,触发第二组买入;当价格低于100日线且高于200日线时,触发第三组买入;当价格低于200日线时,触发第四组买入。每次买入的数量也在逐步放大,分别是qt1、qt2、qt3和qt4。
在卖出方面,策略同时使用了两组止损条件。第一组是当价格高于10日线,且10日线高于其他均线时止损;第二组是当价格低于前一日的10日线,且10日线高于其他均线时止损。这两组条件可以有效锁定中间的短线利润。
优势分析
该策略最大的优势在于可以自动跟踪市场趋势实现长线持有。通过多组买入条件和分批加仓,可以不断降低买入成本,获得超额收益。同时,也规避了单一买入点带来的价格风险。
在止损方面,策略也进行了优化设计。向上追踪短周期均线的turning point,可以快速止损并锁定收益。这避免了亏损进一步扩大的风险。
风险分析
该策略面临的最大风险是被困于长线调整行情中。当大盘处于震荡或下行通道时,均线信号并不可靠。这时有可能持续买入并持有头寸,承受较大亏损。
另一个风险点是均线并不总是精确。价格短期内的跳空或扩张行情可能会让均线发出错误信号。这需要结合其它技术指标进行验证和优化。
优化方向
可以考虑在买入条件中增加其它技术指标判断,例如成交量指标、Bollinger Bands信号等。这可以进一步提高买入的成功率。
在卖出条件中也可以加入Boll上轨或关键支撑位作为第二层止损线。这可以减少不必要的小止损。或者加入移动止损功能实时调整止损线,也可以进一步锁定收益。
总结
该策略使用均线系统进行趋势跟踪交易。通过金字塔式分批加仓,可以最大程度获取趋势行情的收益。同时也设定了双重止损条件保护了资金安全。这是一个值得长期跟踪并实盘验证的策略。可以根据实际情况不断对参数和模型进行优化调整。
/*backtest
start: 2023-01-11 00:00:00
end: 2024-01-17 00:00:00
period: 1d
basePeriod: 1h
exchanges: [{"eid":"Futures_Binance","currency":"BTC_USDT"}]
*/

//@version=5
strategy("EMA_zorba1", shorttitle="zorba_ema", overlay=true)

// Input parameters
qt1 = input.int(5, title="Quantity 1", minval=1)
qt2 = input.int(10, title="Quantity 2", minval=1)
qt3 = input.int(15, title="Quantity 3", minval=1)
qt4 = input.int(20, title="Quantity 4", minval=1)
ema10 = ta.ema(close, 10)
ema20 = ta.ema(close, 20)
ema50 = ta.ema(close, 50)
ema100 = ta.ema(close, 100)
ema200 = ta.ema(close, 200)

// Date range filter
start_date = timestamp(year=2021, month=1, day=1)
end_date = timestamp(year=2024, month=10, day=27)
in_date_range = true

// Profit condition
profit_percentage = input(1, title="Profit Percentage")  // Adjust this value as needed

// Pyramiding setting
pyramiding = input.int(2, title="Pyramiding", minval=1, maxval=10)

// Buy conditions
buy_condition_1 = in_date_range and close < ema20 and close > ema50 and close < open and close < low[1]
buy_condition_2 = in_date_range and close < ema50 and close > ema100 and close < open and close < low[1]
buy_condition_3 = in_date_range and close < ema100 and close > ema200 and close < open and close < low[1]
buy_condition_4 = in_date_range and close < ema200 and close < open and close < low[1]

// Exit conditions
profit_condition = strategy.position_avg_price * (1 + profit_percentage / 100) <= close
exit_condition_1 = in_date_range and (close > ema10 and ema10 > ema20 and ema10 > ema50 and ema10 > ema100 and ema10 > ema200 and close < open) and profit_condition and close < low[1] and close < low[2]
exit_condition_2 = in_date_range and (close < ema10 and close[1] > ema10 and close < close[1] and ema10 > ema20 and ema10 > ema50 and ema10 > ema100 and ema10 > ema200 and close < open) and profit_condition and close < low[1] and close < low[2]

// Exit condition for when today's close is less than the previous day's low
//exit_condition_3 = close < low[1]

// Strategy logic
strategy.entry("Buy1", strategy.long, qty=qt1 * pyramiding, when=buy_condition_1)
strategy.entry("Buy2", strategy.long, qty=qt2 * pyramiding, when=buy_condition_2)
strategy.entry("Buy3", strategy.long, qty=qt3 * pyramiding, when=buy_condition_3)
strategy.entry("Buy4", strategy.long, qty=qt4 * pyramiding, when=buy_condition_4)

strategy.close("Buy1", when=exit_condition_1 or exit_condition_2)
strategy.close("Buy2", when=exit_condition_1 or exit_condition_2)
strategy.close("Buy3", when=exit_condition_1 or exit_condition_2)
strategy.close("Buy4", when=exit_condition_1 or exit_condition_2)