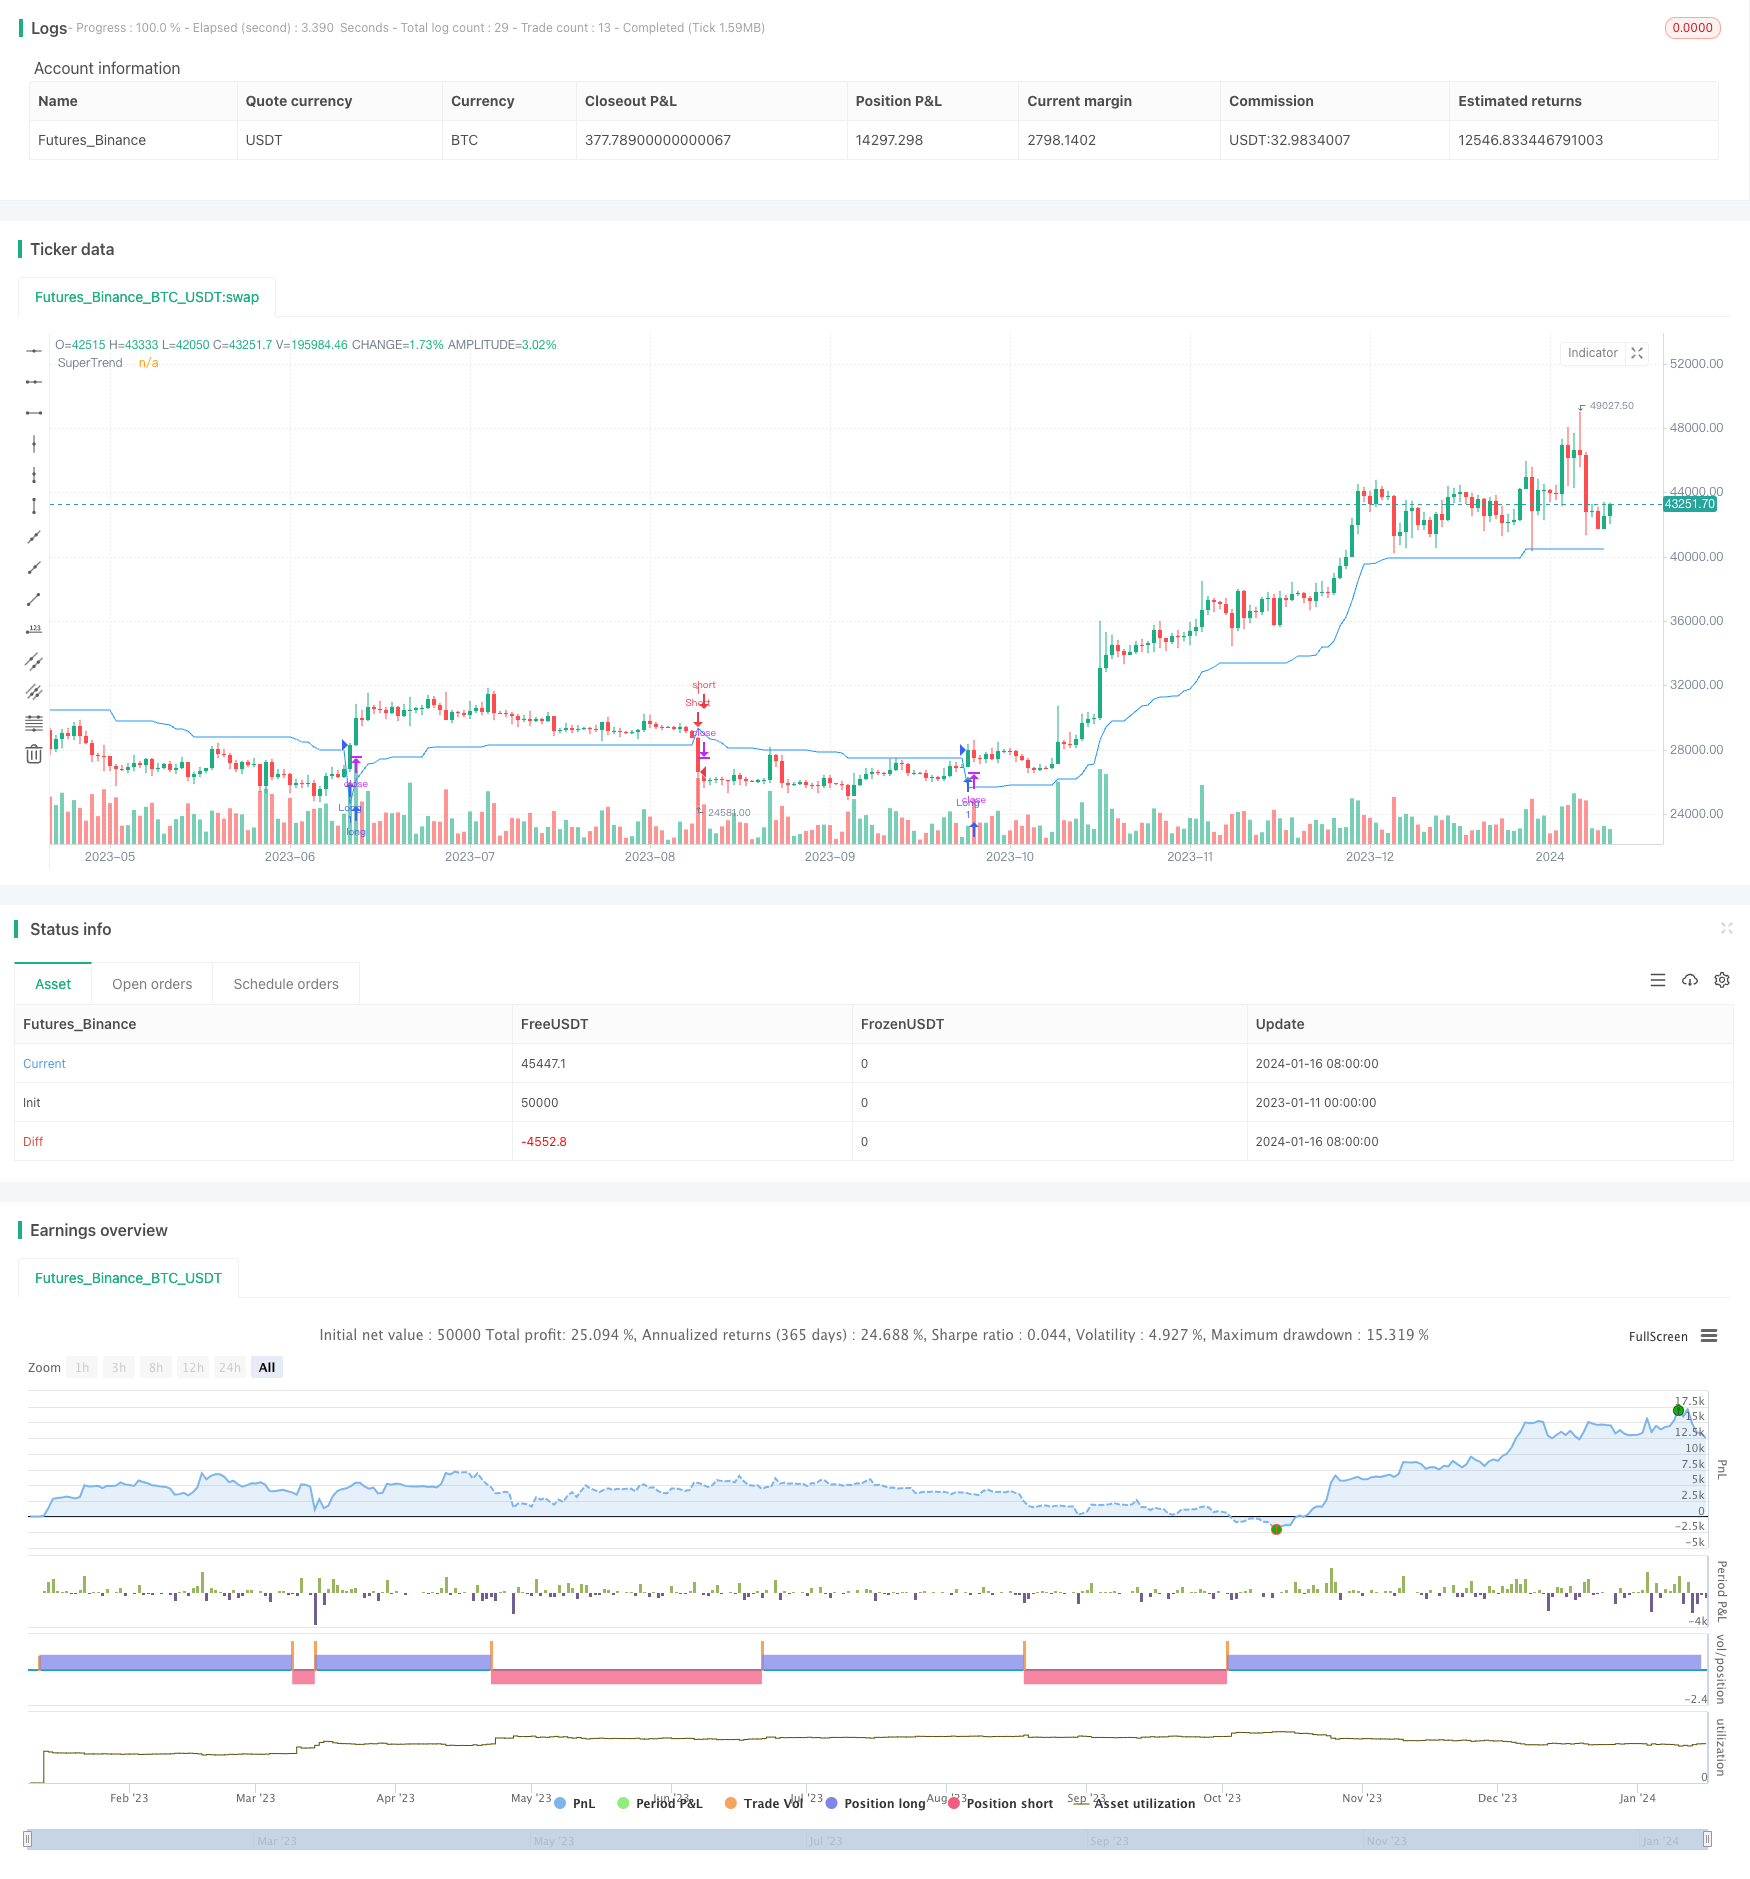
Overview
This strategy builds a SuperTrend channel based on the Average True Range (ATR) indicator to generate buy and sell signals when the price breaks through the channel. It combines the advantages of trend following and stop loss management.
Strategy Logic
The upper and lower bands of the SuperTrend channel are calculated as:
Upper Band = (Highest Price + Lowest Price) / 2 + ATR(n) * Factor Lower Band = (Highest Price + Lowest Price) / 2 - ATR(n) * Factor
Where ATR(n) is the n-period Average True Range and Factor is an adjustable parameter, default to 3.
A bullish signal is generated when the closing price crosses above the upper band. A bearish signal is generated when the closing price crosses below the lower band. The strategy determines entries and exits based on these signals.
Advantage Analysis
- Uses ATR to determine channel range based on market volatility, effectively tracking trends
- Looks for channel breakouts to determine entry timing, avoiding false breakouts
- Adjustable channel range via factor parameter, adaptable to markets with different volatility
- Integrates the advantages of trend following and stop loss management
Risk Analysis
- Improper factor parameter setting may lead to insufficient profit taking or excessive stop loss
- Frequent trading signals may occur during market consolidation, potentially overtrading
- Need to optimize match between ATR period and factor parameter
Risk Solving Methods:
- Adjust factor parameter based on different markets to reduce excessive stop loss
- Add condition filtering to avoid frequent trading during consolidation
- Comprehensively consider volatility, holding period etc. to match ATR period
Optimization Directions
- Incorporate other indicators to filter signals and optimize entries
- Add moving stop loss tracking to lock in more profits
- Parameter optimization for different products and timeframes
- Optimize match between ATR period and factor parameters
Summary
This strategy uses the SuperTrend channel for trend tracking and stop loss management. The match between ATR period and factor parameters is crucial. Next step is to further optimize the strategy via parameter tuning, signal filtering etc., making it adaptable to more complex market environments.
/*backtest
start: 2023-01-11 00:00:00
end: 2024-01-17 00:00:00
period: 1d
basePeriod: 1h
exchanges: [{"eid":"Futures_Binance","currency":"BTC_USDT"}]
*/

//@version=5
strategy("Supertrend Backtest", shorttitle="STBT", overlay=true)

// Input for ATR Length
atrLength = input.int(10, title="ATR Length", minval=1)
atrFactor = input.float(3.0, title="Factor", minval=0.01, step=0.01)

// Calculate SuperTrend
[supertrend, direction] = ta.supertrend(atrFactor, atrLength)
supertrend := barstate.isfirst ? na : supertrend

// Define entry and exit conditions
longCondition = ta.crossover(close, supertrend)
shortCondition = ta.crossunder(close, supertrend)

// Plot the SuperTrend
plot(supertrend, color=color.new(color.blue, 0), title="SuperTrend")

// Plot Buy and Sell signals
plotshape(series=longCondition, style=shape.triangleup, location=location.belowbar, color=color.green, size=size.small, title="Buy Signal")
plotshape(series=shortCondition, style=shape.triangledown, location=location.abovebar, color=color.red, size=size.small, title="Sell Signal")

// Strategy Entry and Exit
strategy.entry("Long", strategy.long, when=longCondition)
strategy.entry("Short", strategy.short, when=shortCondition)