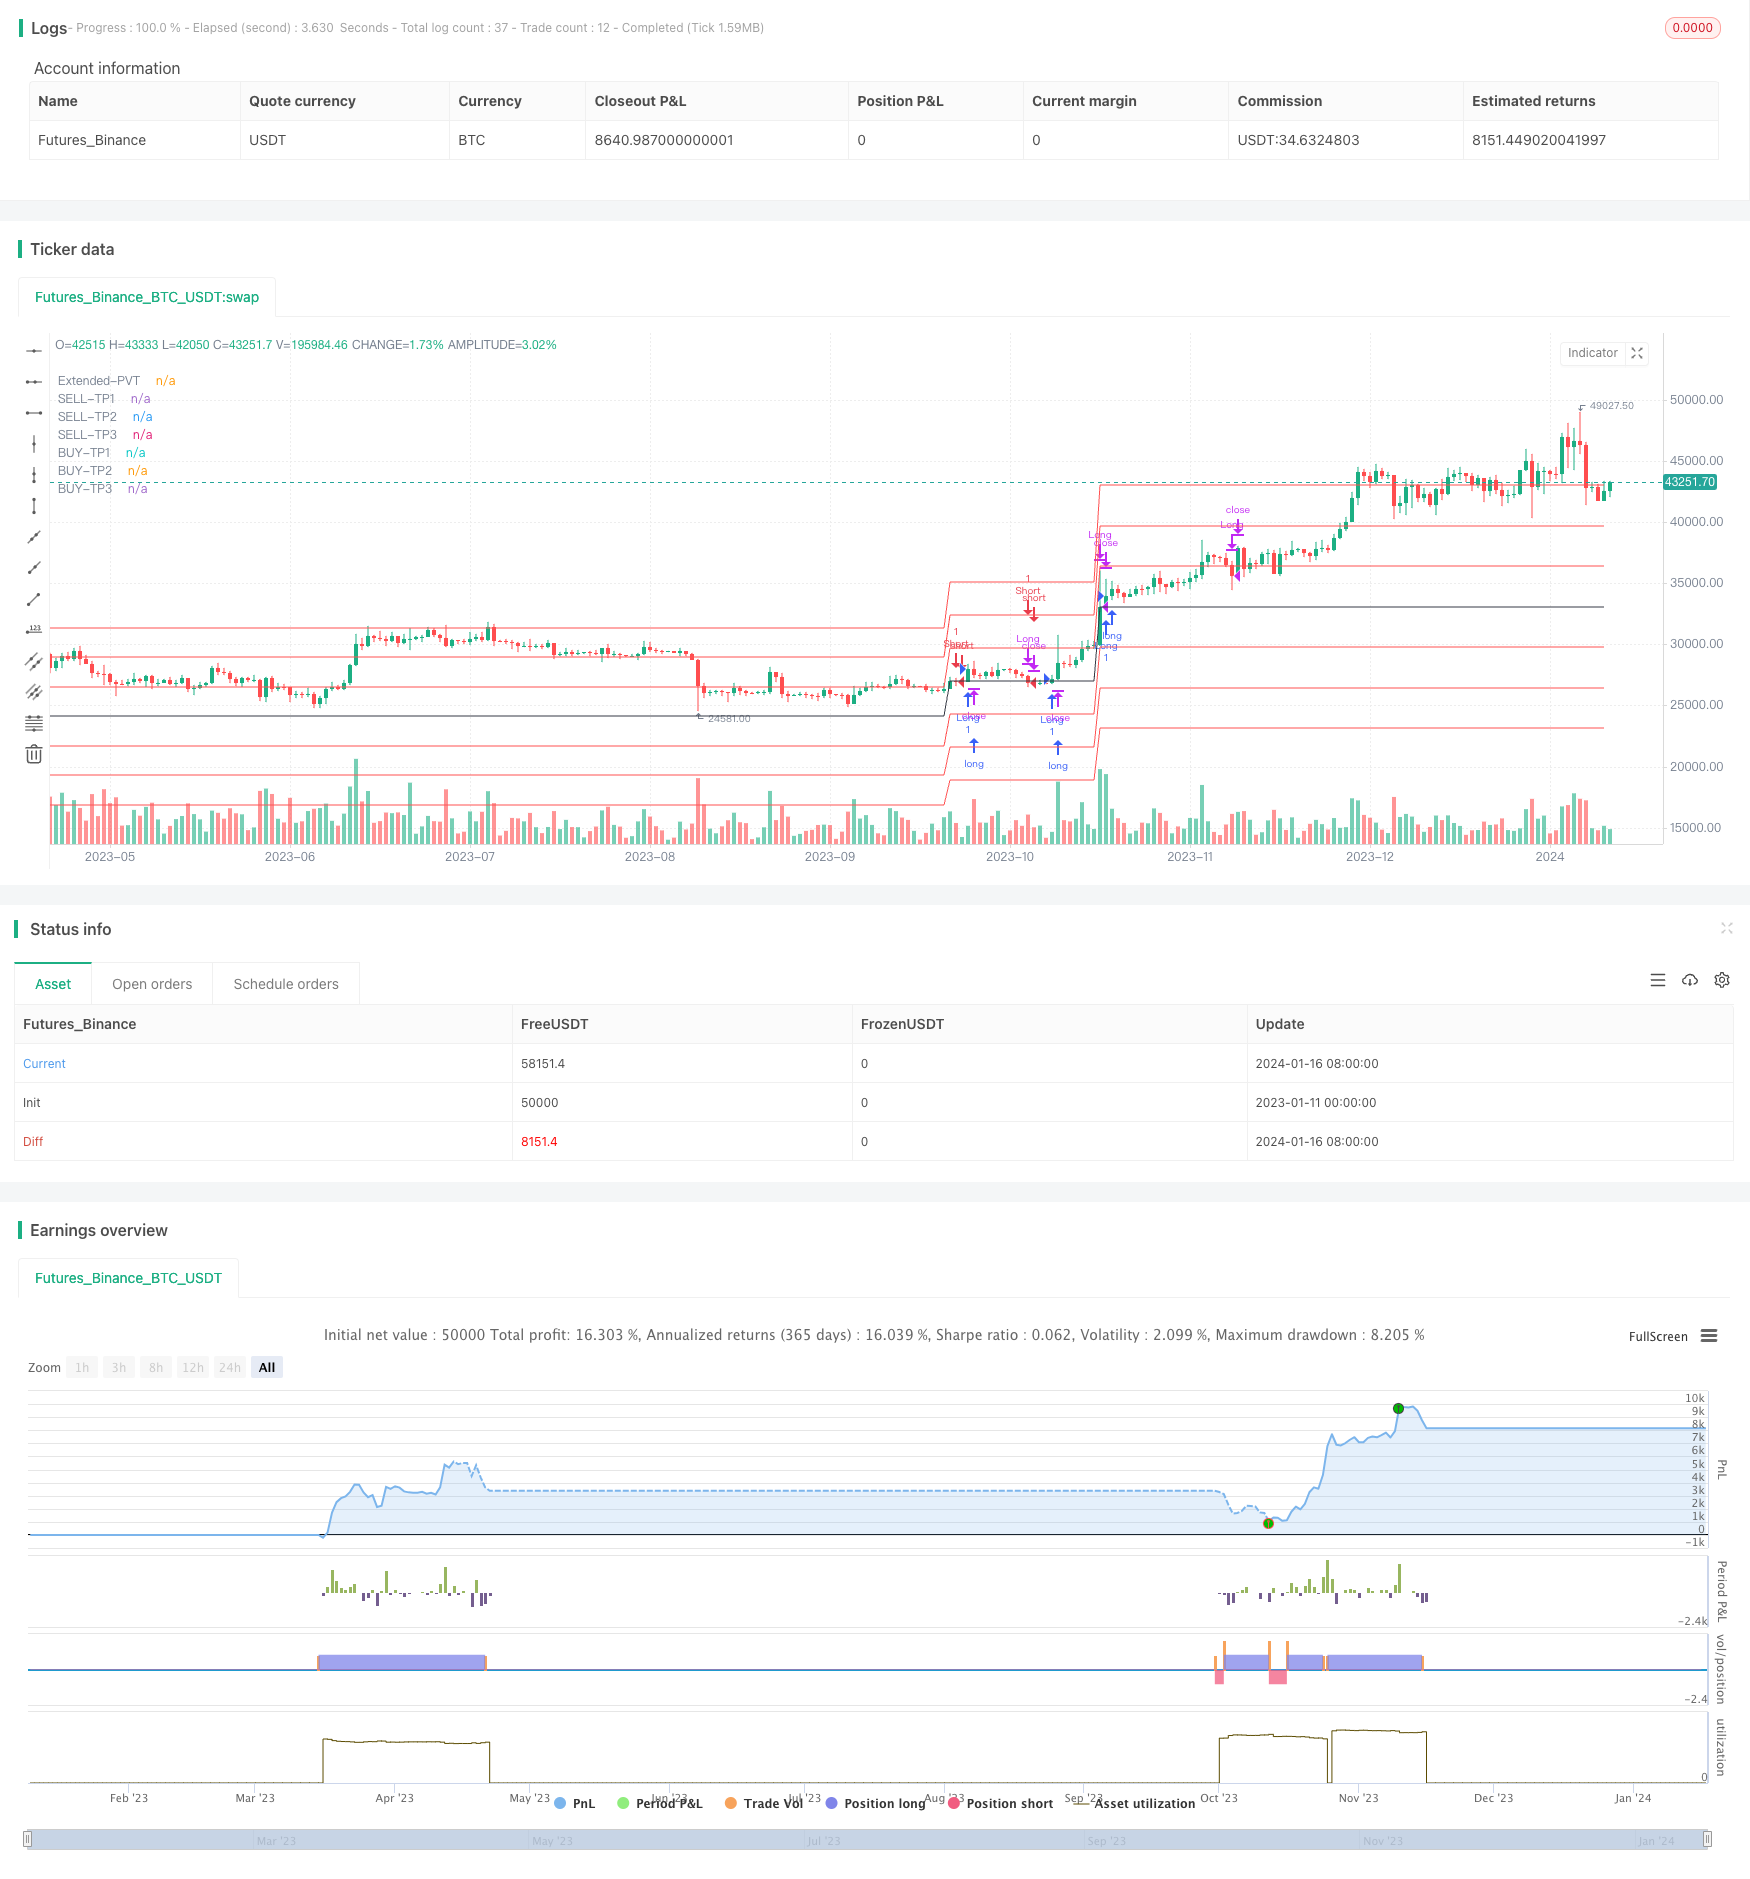
Overview
The Extended Price Volume Trend (EPVT) strategy is a technical indicator combination strategy. It combines the momentum acceleration indicator with other auxiliary indicators to identify potential trend reversal points and shifts in momentum.
Strategy Principle
The core indicator of this strategy is the Extended Price Volume Trend (EPVT). Its calculation method is: cumulative trading volume * percentage price change. Then calculate the maximum and minimum values of EPVT over a certain period to obtain the benchmark range. The EPVT indicator curve is the difference curve between EPVT and this benchmark range.
When the EPVT indicator curve crosses above the zero axis, it indicates that buying pressure is increasing and a long signal appears. Conversely, when the EPVT crosses below the zero axis, a short signal appears.
To improve signal quality, the strategy also uses a simple moving average to confirm the reliability of trend changes.
Advantage Analysis
This strategy combines indicators from three dimensions: trend, momentum and trading volume, which can more comprehensively judge market sentiment and intensity. Using the extended price volume trend indicator has a very good identification effect on excessive volume in the short term, and can capture turning points in the market.
Setting three take-profit levels to exit can choose different profit ratios according to your own risk preference.
Risk Analysis
This strategy relies relatively heavily on the morphology of indicator curves, and will issue false signals when the trend is atypical. In addition, three bars reversals and other situations will also lead to unnecessary reverse opening of positions.
Parameters can be adjusted appropriately or other filtering indicators can be added to optimize. A stop loss strategy can also reduce single losses.
Optimization Direction
Parameter optimization. Such as adjusting the cycle parameter of EPVT to find the optimal parameter combination.
Add trend filtering conditions. Such as judging the direction of the price channel or moving average based on the EPVT signal.
Optimize stop loss strategies. Such as setting fixed value stops or ATR stops.
Summary
The momentum acceleration extended price volume trend strategy captures changes in market sentiment through the EPVT indicator, taking advantage of potential trend turning points. Setting three take-profit levels of different ratios allows to meet different risk appetites of investors. This strategy is worth further testing and optimization to become an effective tool for identifying short-term trend changes in the market.
/*backtest
start: 2023-01-11 00:00:00
end: 2024-01-17 00:00:00
period: 1d
basePeriod: 1h
exchanges: [{"eid":"Futures_Binance","currency":"BTC_USDT"}]
*/

//@version=5
strategy(title="Extended Price Volume Trend", overlay=true )//@version=5
var cumVol = 0.
cumVol += nz(volume)
if barstate.islast and cumVol == 0
    runtime.error("No volume is provided by the data vendor.")
src = close
lenght = input(200,"Trend Lenght")
vt = ta.cum(ta.change(src)/src[1]*volume)
upx = ta.highest(vt,lenght)
downx = ta.lowest(vt,lenght)
basex = (upx +downx)/2
VTX = vt - basex
VTY = ta.valuewhen(ta.cross(VTX,0),close,0)
plot(VTY, color=color.black, title="Extended-PVT")

/////////////////////// STRATEGY ////////////////
/////////////////////// TAKE PROFIT SECTION ////////////////
longConditionx = ta.crossover(close,VTY)
ShortConditionx = ta.crossunder(close,VTY)
tp1 = input.int(10, minval=1,title = "TP-1")
tp2 = input.int(20, minval=1,title = "TP-2")
tp3 = input.int(30, minval=1,title = "TP-3")

ematp = ta.ema(close,2)
TPTAKA1S = VTY*(1-tp1/100)
plot(TPTAKA1S, "SELL-TP1", color=color.red,linewidth = 1)
TPTAKA2S = VTY*(1-tp2/100)
plot(TPTAKA2S, "SELL-TP2", color=color.red,linewidth = 1)
TPTAKA3S = VTY*(1-tp3/100)
plot(TPTAKA3S, "SELL-TP3", color=color.red,linewidth = 1)

TPTAKA1B = VTY*(1+tp1/100)
plot(TPTAKA1B, "BUY-TP1", color=color.red,linewidth = 1)
TPTAKA2B = VTY*(1+tp2/100)
plot(TPTAKA2B, "BUY-TP2", color=color.red,linewidth = 1)
TPTAKA3B = VTY*(1+tp3/100)
plot(TPTAKA3B, "BUY-TP3", color=color.red,linewidth = 1)

BUYTP = ta.crossunder(close,VTY) or ta.crossunder(ematp,TPTAKA1B) or ta.crossunder(ematp,TPTAKA2B) or ta.crossunder(ematp,TPTAKA3B)
SELLTP = ta.crossover(close,VTY) or ta.crossover(ematp,TPTAKA1S) or ta.crossover(ematp,TPTAKA2S) or ta.crossover(ematp,TPTAKA3S)
/////////////////////// STRATEGY ////////////////
// Check for Long Entry
longCondition = longConditionx==true
if longCondition
    strategy.entry('Long', strategy.long, comment = "ENTER-LONG")

buyclose = ShortConditionx==true or BUYTP==true
// Exit condition
strategy.close('Long', when=buyclose or BUYTP==true, comment = "EXIT-LONG")

// Check for Short Entry
ShortCondition = ShortConditionx==true
if ShortCondition
    strategy.entry('Short', strategy.short, comment = "ENTER-SHORT")

sellclose = longConditionx==true or SELLTP ==true
// Exit condition
strategy.close('Short', when=sellclose or SELLTP==true, comment = "EXIT-SHORT")
///// END OF STRATEGY ///////////