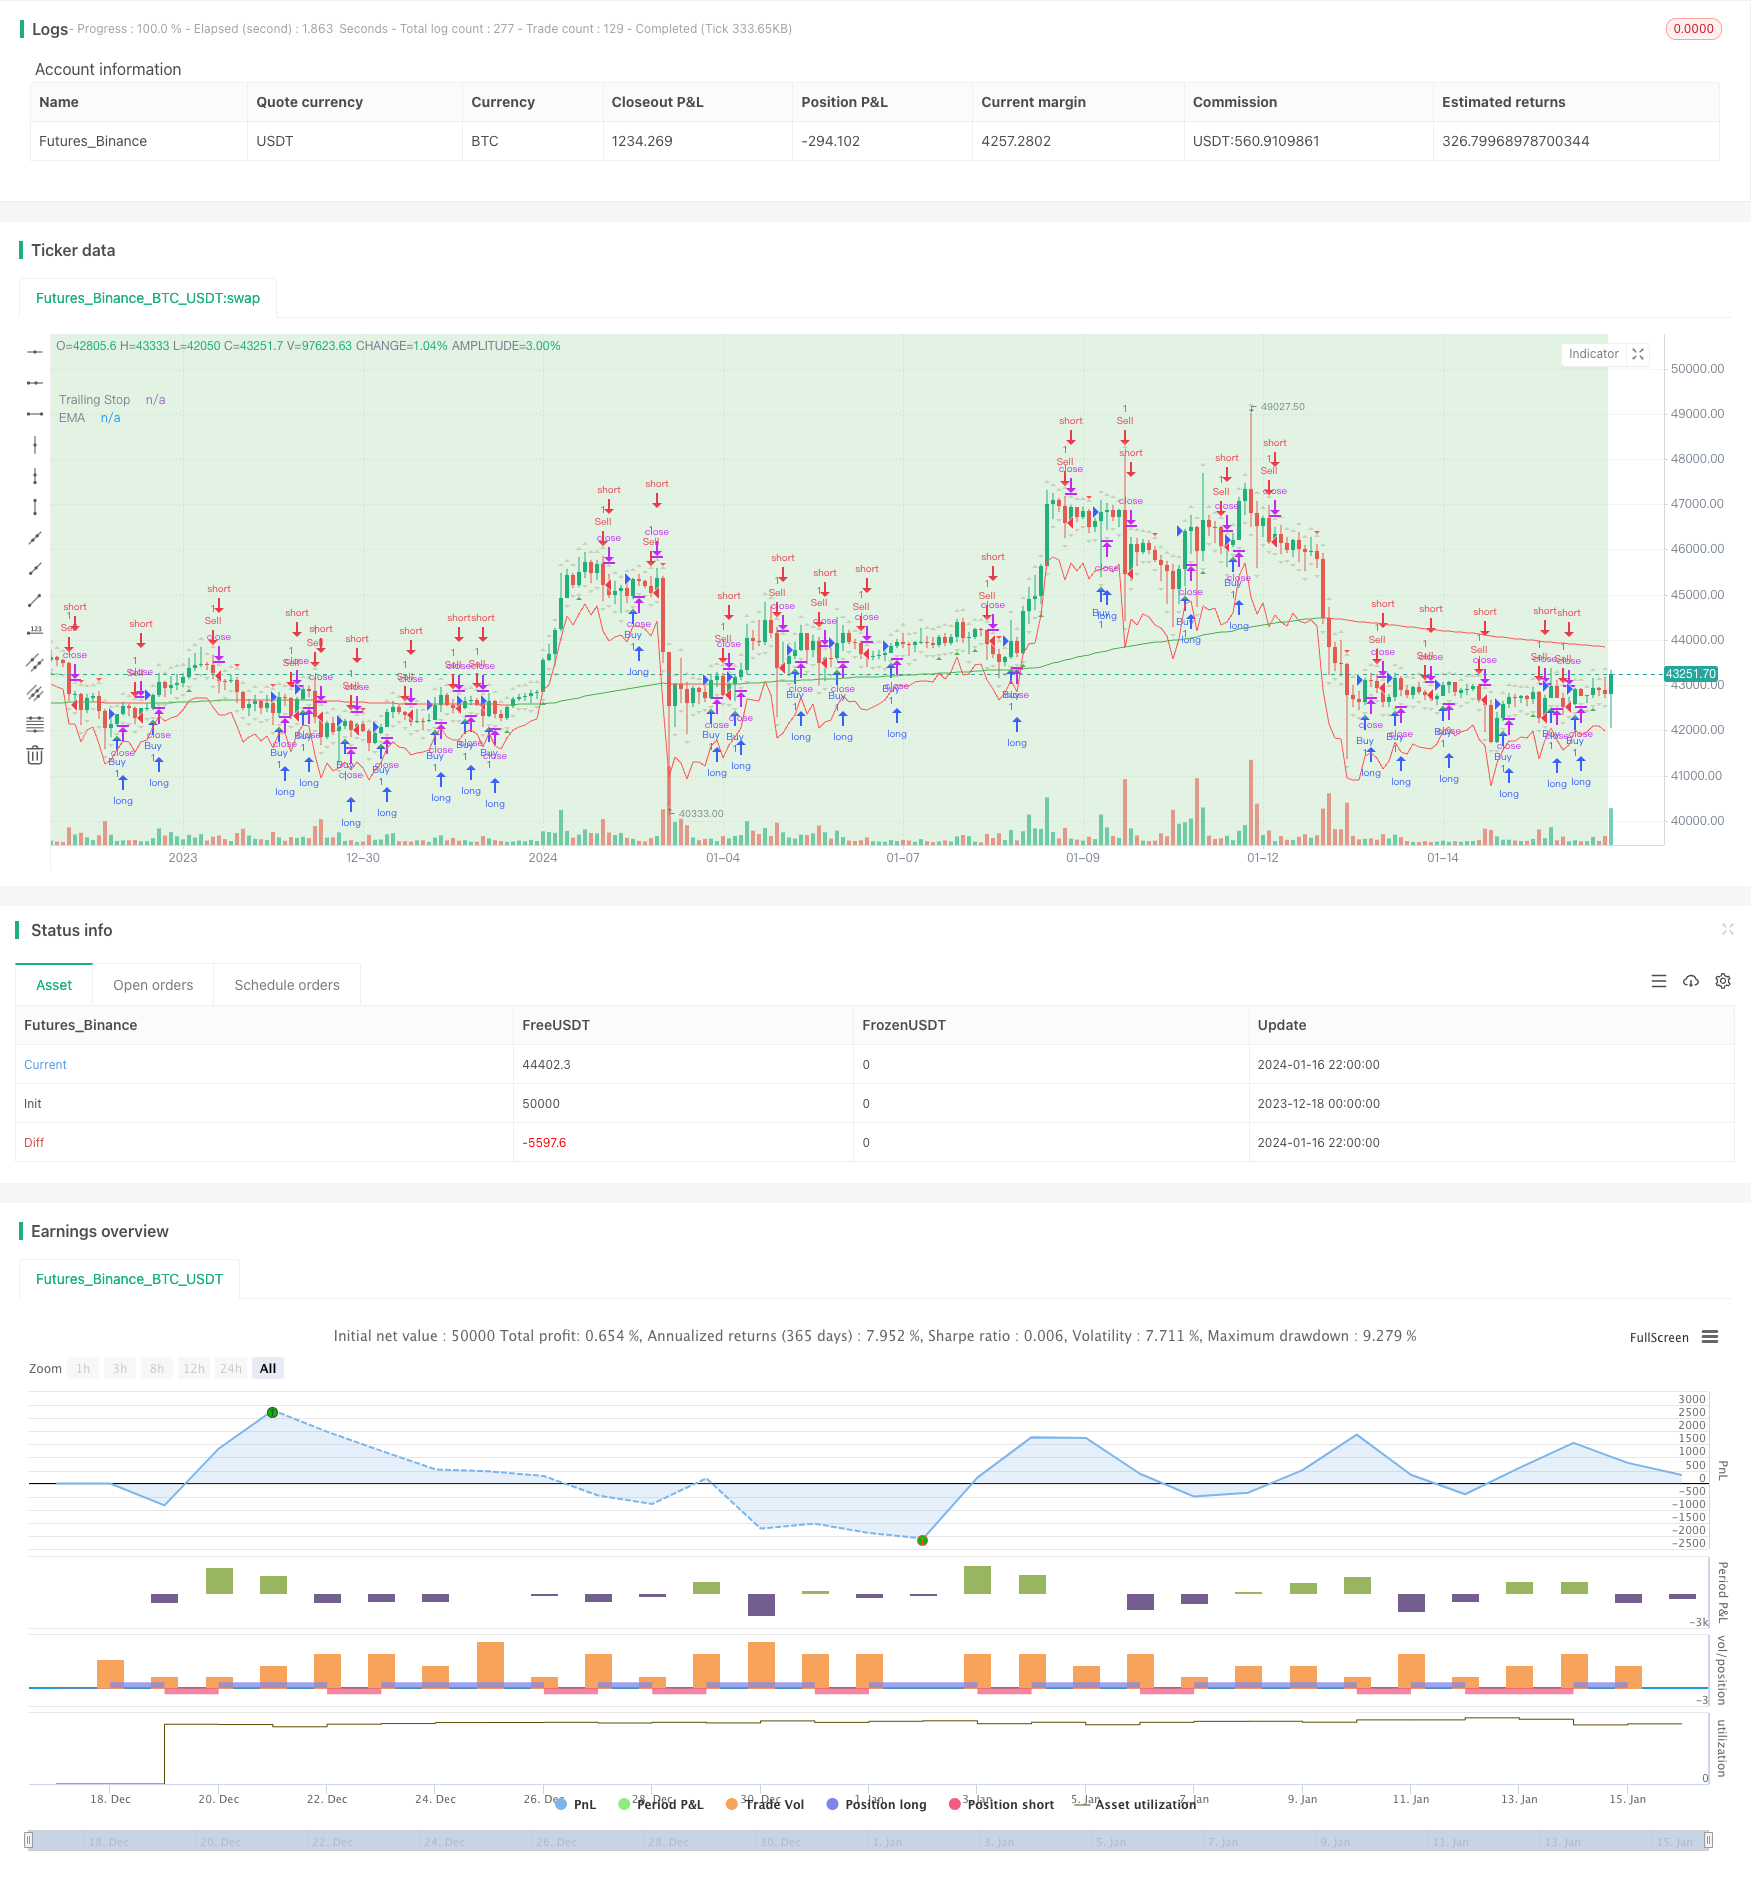
Overview
The strategy utilizes supply and demand zones, Exponential Moving Average (EMA), and Average True Range (ATR) trailing stop for trade signals. Users can adjust EMA settings and signal visibility. The strategy marks Higher High (HH), Lower Low (LL), Lower High (LH), and Higher Low (HL) zones. Signals are shown after the third candle, suitable for backtesting.
Strategy Logic
Indicator Calculations
Exponential Moving Average (EMA):
- EMA is calculated from closing prices over a period (default: 200).
- Formula: EMA = (Price_t x α) + (EMA_t-1 x (1 - α)), where α = 2/(length + 1)
Average True Range (ATR):
- ATR measures market volatility from true range of prices.
- True range is the greatest of:
- Current high minus current low
- Absolute value of current high minus previous close
- Absolute value of current low minus previous close
- ATR typically uses 14 periods.
Used to determine EMA for trend and ATR for volatility-based trailing stop.
Supply and Demand Zone Identification
It identifies “HH” (Higher High), “LL” (Lower Low), “HL” (Higher Low) and “LH” (Lower High) patterns:
Higher High (HH): Current peak > previous peak, upward momentum.
Lower Low (LL): Current trough < previous trough, downward momentum.
Higher Low (HL): Current trough > previous trough, upward continuation.
Lower High (LH): Current peak < previous peak, downward continuation.
Used with trends to identify reversals or continuations.
Entry and Exit
Entry Signal: Buy/sell on third candle closing above/below previous high/low.
Exit: Trailing stop loss based on ATR.
Advantages
- Combines trends, reversals, volatility for robust signals.
- Demand/supply zones identify key S/R.
- Dynamic ATR stop adjusts to volatility.
- Customizable parameters.
- Simple entry rules.
Risks and Improvements
- False signals: Optimize EMA length.
- High ATR multiplier risks chasing trends.
- Consider additional filters on entries.
- Test trend-focused approach.
Conclusion
Combines multiple techniques for decent backtests. Real-world is complex, optimization is key. Basic strategy allows extensions and combinations.
/*backtest
start: 2023-12-18 00:00:00
end: 2024-01-17 00:00:00
period: 2h
basePeriod: 15m
exchanges: [{"eid":"Futures_Binance","currency":"BTC_USDT"}]
*/

//@version=5
strategy("Supply and Demand Zones with EMA and Trailing Stop", shorttitle="SD Zones", overlay=true)

showBuySignals = input(true, title="Show Buy Signals", group="Signals")
showSellSignals = input(true, title="Show Sell Signals", group="Signals")
showHLZone = input(true, title="Show HL Zone", group="Zones")
showLHZone = input(true, title="Show LH Zone", group="Zones")
showHHZone = input(true, title="Show HH Zone", group="Zones")
showLLZone = input(true, title="Show LL Zone", group="Zones")

emaLength = input(200, title="EMA Length", group="EMA Settings")
atrLength = input(14, title="ATR Length", group="Trailing Stop")
atrMultiplier = input(2, title="ATR Multiplier", group="Trailing Stop")

// Function to identify supply and demand zones
getZones(src, len, mult) =>
    base = request.security(syminfo.tickerid, "D", close)
    upper = request.security(syminfo.tickerid, "D", high)
    lower = request.security(syminfo.tickerid, "D", low)
    multiplier = request.security(syminfo.tickerid, "D", mult)
    zonetype = base + multiplier * len
    zone = src >= zonetype
    [zone, upper, lower]

// Identify supply and demand zones
[supplyZone, _, _] = getZones(close, high[1] - low[1], 1)
[demandZone, _, _] = getZones(close, high[1] - low[1], -1)

// Plot supply and demand zones
bgcolor(supplyZone ? color.new(color.red, 80) : na)
bgcolor(demandZone ? color.new(color.green, 80) : na)

// EMA with Linear Weighted method
ema = ta.ema(close, emaLength)

// Color code EMA based on its relation to candles
emaColor = close > ema ? color.new(color.green, 0) : close < ema ? color.new(color.red, 0) : color.new(color.yellow, 0)

// Plot EMA
plot(ema, color=emaColor, title="EMA")

// Entry Signal Conditions after the third candle
longCondition = ta.crossover(close, high[1]) and bar_index >= 2
shortCondition = ta.crossunder(close, low[1]) and bar_index >= 2

// Trailing Stop using ATR
atrValue = ta.atr(atrLength)
trailStop = close - atrMultiplier * atrValue

// Strategy Entry and Exit
if (longCondition)
    strategy.entry("Buy", strategy.long)
    strategy.exit("TrailStop", from_entry="Buy", loss=trailStop)

if (shortCondition)
    strategy.entry("Sell", strategy.short)
    strategy.exit("TrailStop", from_entry="Sell", loss=trailStop)

// Plot Entry Signals
plotshape(series=showBuySignals ? longCondition : na, title="Buy Signal", color=color.new(color.green, 0), style=shape.triangleup, location=location.belowbar)
plotshape(series=showSellSignals ? shortCondition : na, title="Sell Signal", color=color.new(color.red, 0), style=shape.triangledown, location=location.abovebar)

// Plot Trailing Stop
plot(trailStop, color=color.new(color.red, 0), title="Trailing Stop")

// Plot HH, LL, LH, and HL zones
plotshape(series=showHHZone and ta.highest(high, 2)[1] and ta.highest(high, 2)[2] ? 1 : na, title="HH Zone", color=color.new(color.blue, 80), style=shape.triangleup, location=location.abovebar)
plotshape(series=showLLZone and ta.lowest(low, 2)[1] and ta.lowest(low, 2)[2] ? 1 : na, title="LL Zone", color=color.new(color.blue, 80), style=shape.triangledown, location=location.belowbar)
plotshape(series=showLHZone and ta.highest(high, 2)[1] and ta.lowest(low, 2)[2] ? 1 : na, title="LH Zone", color=color.new(color.orange, 80), style=shape.triangleup, location=location.abovebar)
plotshape(series=showHLZone and ta.lowest(low, 2)[1] and ta.highest(high, 2)[2] ? 1 : na, title="HL Zone", color=color.new(color.orange, 80), style=shape.triangledown, location=location.belowbar)