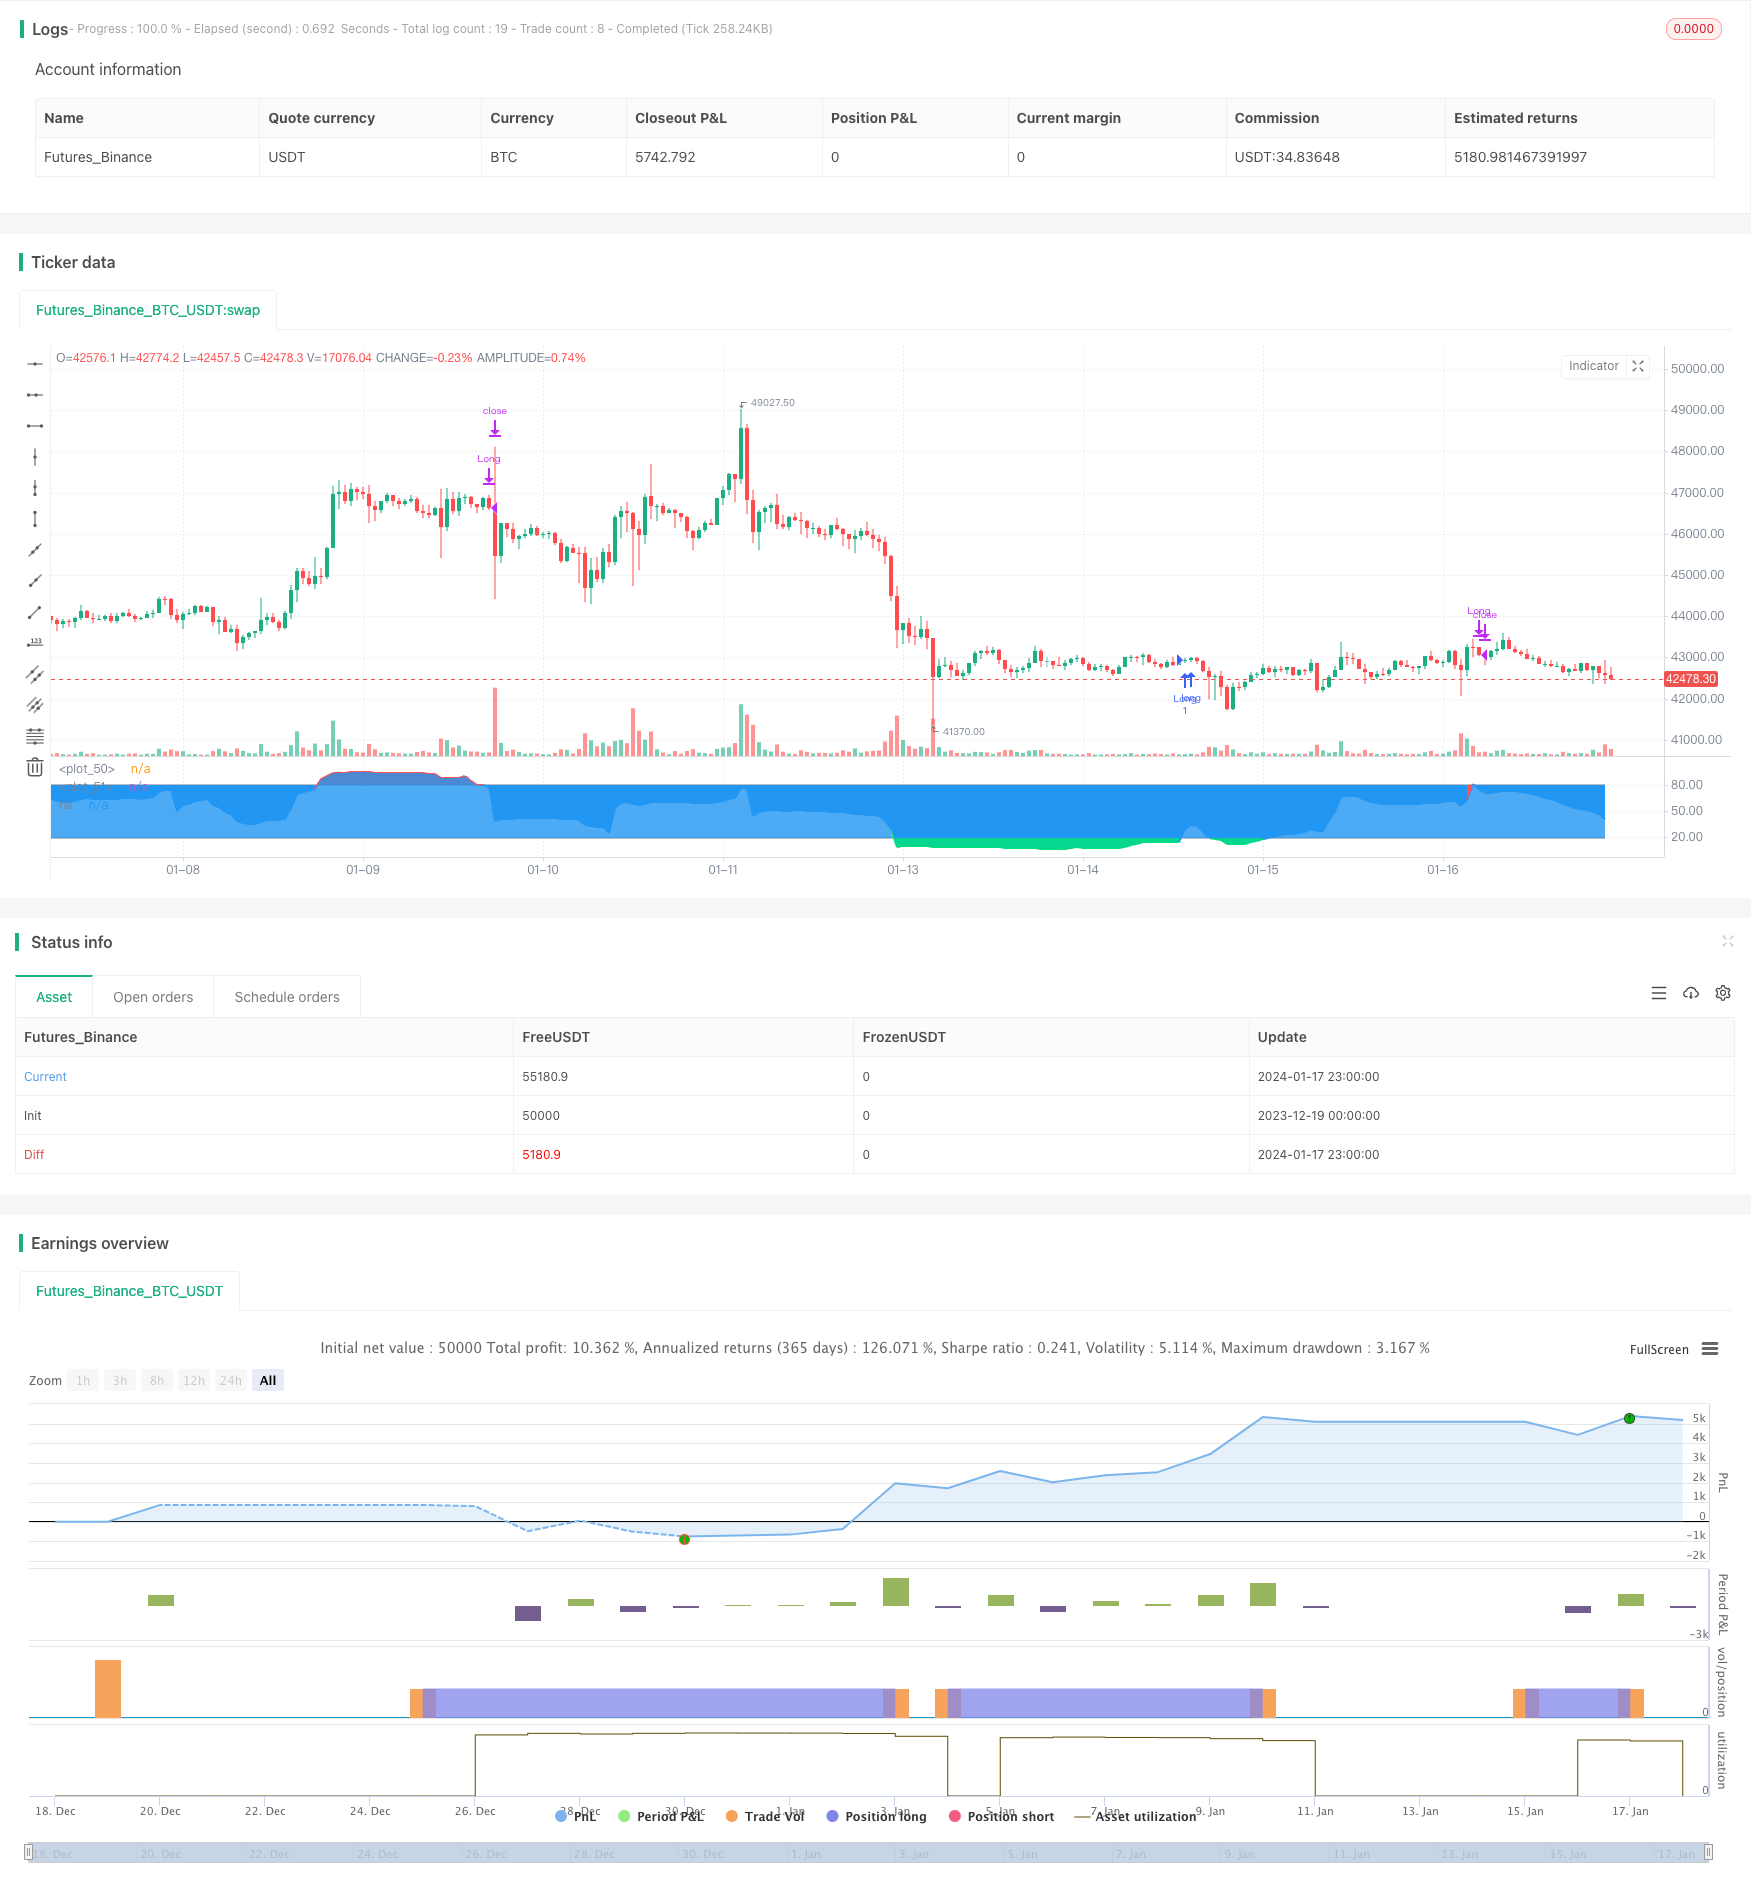
Overview
This strategy is named “RSI-VWAP Short-term Strategy”. It uses the RSI indicator and Volume Weighted Average Price (VWAP) as technical indicators to generate long and short signals and thus make buy and sell decisions. The strategy aims to capture the overbought and oversold phenomena in the short-term market in order to achieve excess returns.
Strategy Principle
- Use the RSI indicator to determine if the market is overbought or oversold. RSI values above 80 indicate an overbought area and below 20 indicate an oversold area.
- The RSI indicator uses VWAP instead of closing price as source data. VWAP reflects the average trading price of the day better.
- A buy signal is generated when the RSI crosses up through 20 from the oversold area. A sell signal is generated when the RSI crosses down through 80 from the overbought area.
- This strategy only goes long and does not go short. That is, only buy in oversold and sell in overbought.
Advantage Analysis
- Using VWAP as the data source for RSI makes the RSI indicator judge the market more accurately, avoiding being misled by false breakouts.
- Only going long reduces trading frequency and helps obtain long-term stable returns.
- The RSI parameter is 17, which is suitable for short-term operations.
- The low frequency trading method expects fewer trades, reducing transaction costs and helping obtain higher return rates.
Risk Analysis
- There is overfitting risk in quant strategy backtesting and actual results may differ from backtest.
- Unable to seize opportunities in downtrends by only going long.
- The overbought and oversold criteria may not suit all products, parameters need to be adjusted for different products.
- Any technical indicator can generate false signals and losses can not be completely avoided.
Risks can be reduced by appropriately relaxing overbought and oversold criteria, combining other indicators to confirm signals, adjusting parameter ranges, etc.
Optimization Directions
- Test the effects of different parameters on strategy performance and optimize RSI length and overbought/oversold thresholds.
- Add stop loss strategies to lock in some profits through moving stop loss, time stop loss etc, reducing drawdowns.
- Filter signals by combining other indicators to improve signal accuracy.
- Set independent parameter ranges according to characteristics of different products so that the strategy can better suit different products.
Conclusion
Overall this is a simple and practical short-term strategy. Using VWAP makes RSI judgement more accurate, only going long reduces trading frequency. The strategy idea is clear and easy to understand and implement, suitable for quant trading beginners. But any single indicator strategy can hardly be perfect and needs constant optimization for better live performance.
/*backtest
start: 2023-12-19 00:00:00
end: 2024-01-18 00:00:00
period: 1h
basePeriod: 15m
exchanges: [{"eid":"Futures_Binance","currency":"BTC_USDT"}]
*/

// This source code is subject to the terms of the Mozilla Public License 2.0 at https://mozilla.org/MPL/2.0/
// © Xaviz

//#####©ÉÉÉɶN###############################################
//####*..´´´´´´,,,»ëN########################################
//###ë..´´´´´´,,,,,,''%©#####################################
//###'´´´´´´,,,,,,,'''''?¶###################################
//##o´´´´´´,,,,,,,''''''''*©#################################
//##'´´´´´,,,,,,,'''''''^^^~±################################
//#±´´´´´,,,,,,,''''''''^í/;~*©####æ%;í»~~~~;==I±N###########
//#»´´´´,,,,,,'''''''''^;////;»¶X/í~~/~~~;=~~~~~~~~*¶########
//#'´´´,,,,,,''''''''^^;////;%I^~/~~/~~~=~~~;=?;~~~~;?ë######
//©´´,,,,,,,''''''''^^~/////X~/~~/~~/~~»í~~=~~~~~~~~~~^;É####
//¶´,,,,,,,''''''''^^^;///;%;~/~~;í~~»~í?~?~~~?I/~~~~?*=íÑ###
//N,,,,,,,'''''''^^^^^///;;o/~~;;~~;£=»í»;IX/=~~~~~~^^^^'*æ##
//#í,,,,,''''''''^^^^^;;;;;o~»~~~~íX//~/»~;í?IíI»~~^/*?'''=N#
//#%,,,'''''''''^^^^^^í;;;;£;~~~//»I»/£X/X/»í*&~~~^^^^'^*~'É#
//#©,,''''''''^^^^^^^^~;;;;&/~/////*X;í;o*í»~=*?*===^'''''*£#
//##&''''''''^^^^^^^^^^~;;;;X=í~~~»;;;/~;í»~»±;^^^^^';=''''É#
//##N^''''''^^^^^^^^^^~~~;;;;/£;~~/»~~»~~///o~~^^^^''''?^',æ#
//###Ñ''''^^^^^^^^^^^~~~~~;;;;;í*X*í»;~~IX?~~^^^^/?'''''=,=##
//####X'''^^^^^^^^^^~~~~~~~~;;íííííí~~í*=~~~~Ií^'''=''''^»©##
//#####£^^^^^^^^^^^~~~~~~~~~~~íííííí~~~~~*~^^^;/''''='',,N###
//######æ~^^^^^^^^~~~~~~~~~~~~~~íííí~~~~~^*^^^'=''''?',,§####
//########&^^^^^^~~~~~~~~~~~~~~~~~~~~~~~^^=^^''=''''?,íN#####
//#########N?^^~~~~~~~~~~~~~~~~~~~~~~~~^^^=^''^?''';í@#######
//###########N*~~~~~~~~~~~~~~~~~~~~~~~^^^*'''^='''/É#########
//##############@;~~~~~~~~~~~~~~~~~~~^^~='''~?'';É###########
//#################É=~~~~~~~~~~~~~~^^^*~'''*~?§##############
//#####################N§£I/~~~~~~»*?~»o§æN##################

//@version=4
strategy("RSI-VWAP INDICATOR", overlay=false)

// ================================================================================================================================================================================
// RSI VWAP INDICATOR
// ================================================================================================================================================================================

// Initial inputs
Act_RSI_VWAP = input(true, "RSI VOLUME WEIGHTED AVERAGE PRICE")
RSI_VWAP_length = input(17, "RSI-VWAP LENGTH")
RSI_VWAP_overSold = input(19, "RSI-VWAP OVERSOLD", type=input.float)
RSI_VWAP_overBought = input(80, "RSI-VWAP OVERBOUGHT", type=input.float)

// RSI with VWAP as source
RSI_VWAP = rsi(vwap(close), RSI_VWAP_length)

// Plotting, overlay=false
r=plot(RSI_VWAP, color = RSI_VWAP > RSI_VWAP_overBought ? color.red : RSI_VWAP < RSI_VWAP_overSold ? color.lime : color.blue, title="rsi", linewidth=2, style=plot.style_line)
h1=plot(RSI_VWAP_overBought, color = color.gray, style=plot.style_stepline)
h2=plot(RSI_VWAP_overSold, color = color.gray, style=plot.style_stepline)
fill(r,h1, color = RSI_VWAP > RSI_VWAP_overBought ? color.red : na, transp = 60)
fill(r,h2, color = RSI_VWAP < RSI_VWAP_overSold ? color.lime : na, transp = 60)

// Long only Backtest
strategy.entry("Long", strategy.long, when = (crossover(RSI_VWAP, RSI_VWAP_overSold)))
strategy.close("Long", when = (crossunder(RSI_VWAP, RSI_VWAP_overBought)))