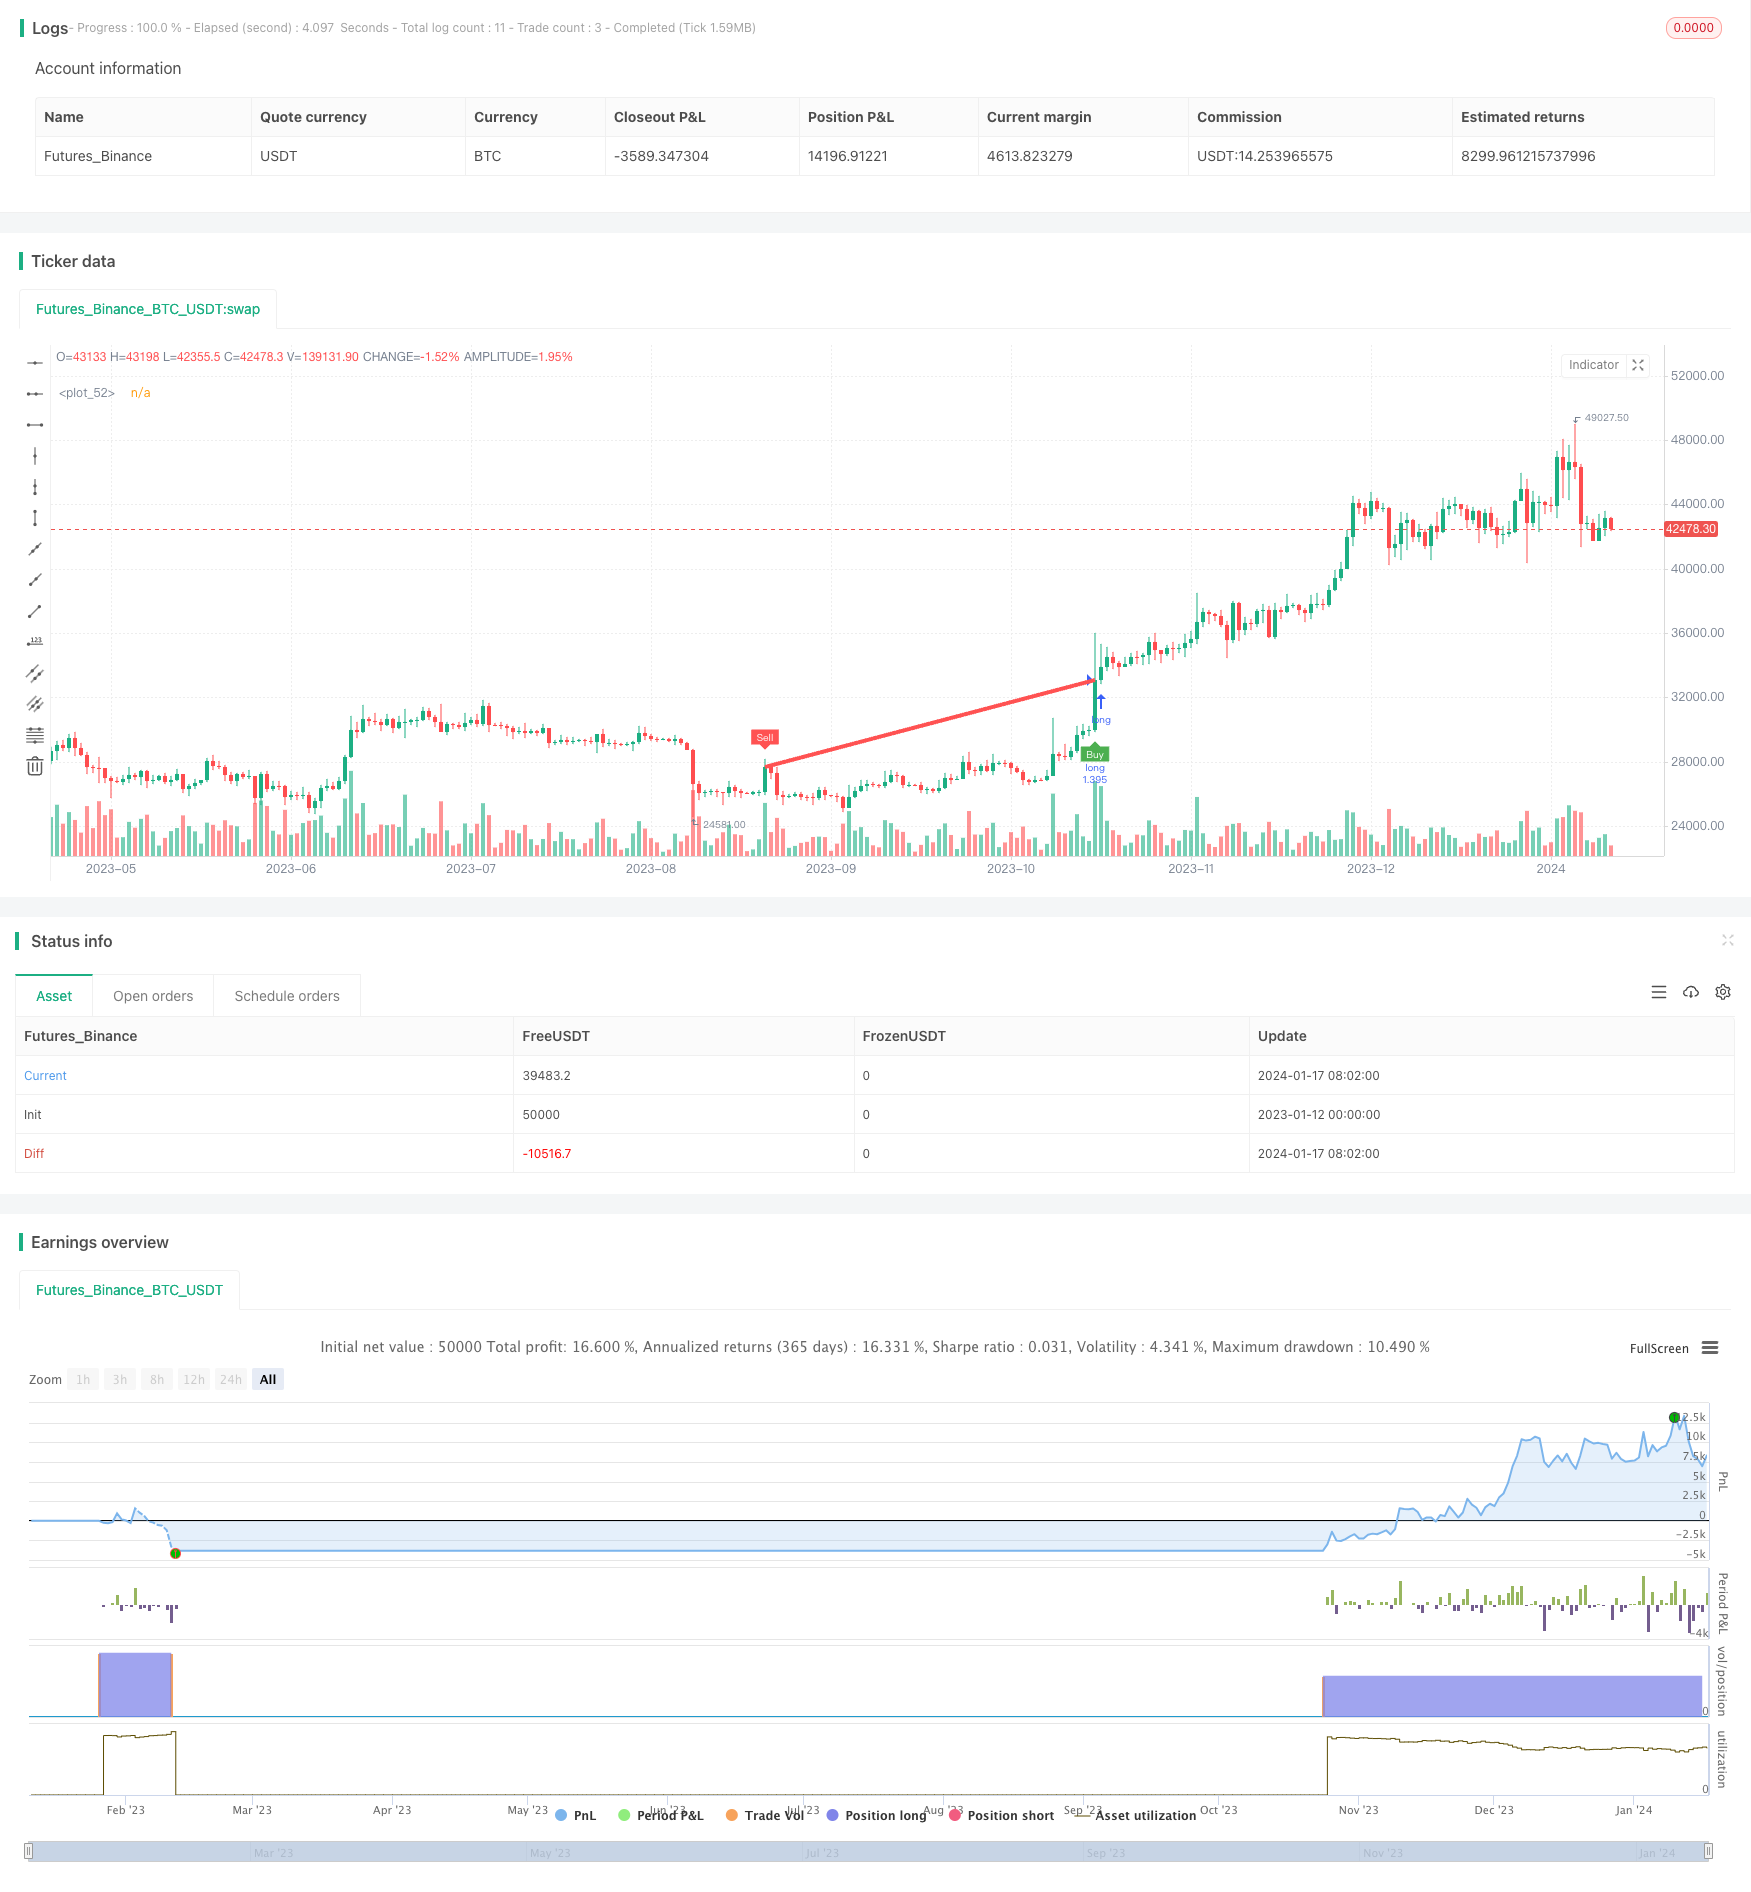
Overview
This strategy is a cryptocurrency trend following strategy based on the Heiken Ashi indicator. It uses two exponential moving averages (EMAs) with different periods combined with Heiken Ashi and various conditions to generate trading signals. The goal of this strategy is to identify mid- to long-term price trends and get in timely when trend reversal occurs.
Strategy Logic
The strategy employs 50- and 100-period EMAs. Meanwhile, it calculates Heiken Ashi candles, which is a special candlestick that can filter out market noise. The strategy uses open, close, high and low prices of the Heiken Ashi candles and applies them to the 100-period EMA to generate more accurate trading signals.
Specifically, when the open price of the 100-period Heiken Ashi is above the close price, and the open price of the previous candle is below the close price, it is a long signal. On the contrary, when the open price of the 100-period Heiken Ashi is below the close price, and the open price of the previous candle is above the close price, it is a short signal.
The strategy combines the dual EMA system and Heiken Ashi indicator, aiming to capture opportunities timely when mid- to long-term trends form. It uses Heiken Ashi to filter out short-term market noise so that trading signals can be more reliable.
Advantages
- Using Heiken Ashi can effectively filter out noise and make trading signals clearer
- The dual-EMA combined with Heiken Ashi can identify relatively strong mid- to long-term trends
- Multiple condition judgments help avoid missing good chances
- The strategy is especially suitable for the highly volatile cryptocurrency market
- It can be configured as long-only strategy to reduce trading risks
Risks
- There may be large losses due to the stop loss being too loose
- The strategy may generate more ineffective trades in range-bound markets
- There is still some degree of lag in Heiken Ashi, unable to completely avoid risks
- It cannot determine trend reversal points, facing risks of expanding losses
To mitigate risks, we can appropriately reduce the stop loss range, or consider combining other indicators to determine trend reversal. When the market enters a range-bound period, we can also pause the strategy and wait for new trends to emerge.
Optimization Directions
The strategy can also be optimized in the following aspects:
- Optimize EMA parameters to find the best parameter combination
- Try other indicators to replace Heiken Ashi, such as KDJ, MACD etc.
- Add price breakout as entry confirmation
- Incorporate volatility indicators to determine trend reversal
- Use machine learning methods to dynamically optimize parameters
Conclusion
The cryptocurrency trend following strategy based on Heiken Ashi has comprehensively considered aspects like trend judgment, entry timing, stop loss control etc., making it very adaptive to highly volatile assets like cryptocurrencies. By using Heiken Ashi to filter out noise and adopting robust risk control methods, the strategy can effectively seize trading opportunities brought by mid- to long-term price trends. There is still much room for improvement in the strategy’s performance if we can further optimize parameters, indicator selections and risk control methods.
/*backtest
start: 2023-01-12 00:00:00
end: 2024-01-18 00:00:00
period: 1d
basePeriod: 1h
exchanges: [{"eid":"Futures_Binance","currency":"BTC_USDT"}]
*/

//@version=4
//@SoftKill21
strategy(title="CRYPTO HA Strategy", shorttitle="CRYPTO HA Strategy", overlay=true , default_qty_type =strategy.percent_of_equity, default_qty_value =100, commission_type= strategy.commission.percent,commission_value =0.1 )


ma1_len = input(50)
ma2_len = input(100)

fromDay = input(defval = 1, title = "From Day", minval = 1, maxval = 31)
fromMonth = input(defval = 1, title = "From Month", minval = 1, maxval = 12)
fromYear = input(defval = 2020, title = "From Year", minval = 1970)
 //monday and session
// To Date Inputs
toDay = input(defval = 31, title = "To Day", minval = 1, maxval = 31)
toMonth = input(defval = 12, title = "To Month", minval = 1, maxval = 12)
toYear = input(defval = 2020, title = "To Year", minval = 1970)

startDate = timestamp(fromYear, fromMonth, fromDay, 00, 00)
finishDate = timestamp(toYear, toMonth, toDay, 00, 00)
time_cond = true


//First Moving Average data
o = ema(open, ma1_len)
c = ema(close, ma1_len)
h = ema(high, ma1_len)
l = ema(low, ma1_len)

// === HA calculator ===
ha_t = heikinashi(syminfo.tickerid)
ha_o = security(ha_t, timeframe.period, o)
ha_c = security(ha_t, timeframe.period, c)
ha_h = security(ha_t, timeframe.period, h)
ha_l = security(ha_t, timeframe.period, l)

//Second Moving Average data

o2 = ema(ha_o, ma2_len)
c2 = ema(ha_c, ma2_len)
h2 = ema(ha_h, ma2_len)
l2 = ema(ha_l, ma2_len)

// === Color def ===
ha_col = o2 > c2 ? color.white : color.lime

sell = o2 > c2 and o2[1] < c2[1] and time_cond
buy = o2 < c2 and o2[1] > c2[1] and time_cond
plotshape(buy, color=color.green, text= "Buy", location= location.belowbar,style= shape.labelup, textcolor=color.white, size = size.tiny, title="Buy Alert",editable=false, transp=60)
plotshape(sell, color=color.red, text= "Sell", location= location.abovebar,style= shape.labeldown, textcolor=color.white, size = size.tiny, title="Sell Alert", editable=false, transp=60)

trendColor = buy ? color.red : sell ? color.green : na
plot( buy ? close: sell  ? close : na , color=trendColor, style=plot.style_line, linewidth=4, editable=false)


onlylong=input(true)
original=input(false)

if(onlylong)
    strategy.entry("long",1,when=buy)
    strategy.close("long",when=sell)
if(original)
    strategy.entry("long",1,when=buy)
    strategy.entry("short",0,when=sell)

sl = input(0.075)
strategy.exit("closelong", "long" , loss = close * sl / syminfo.mintick, alert_message = "sl point")
strategy.exit("closeshort", "short" , loss = close * sl / syminfo.mintick, alert_message = "sl point")