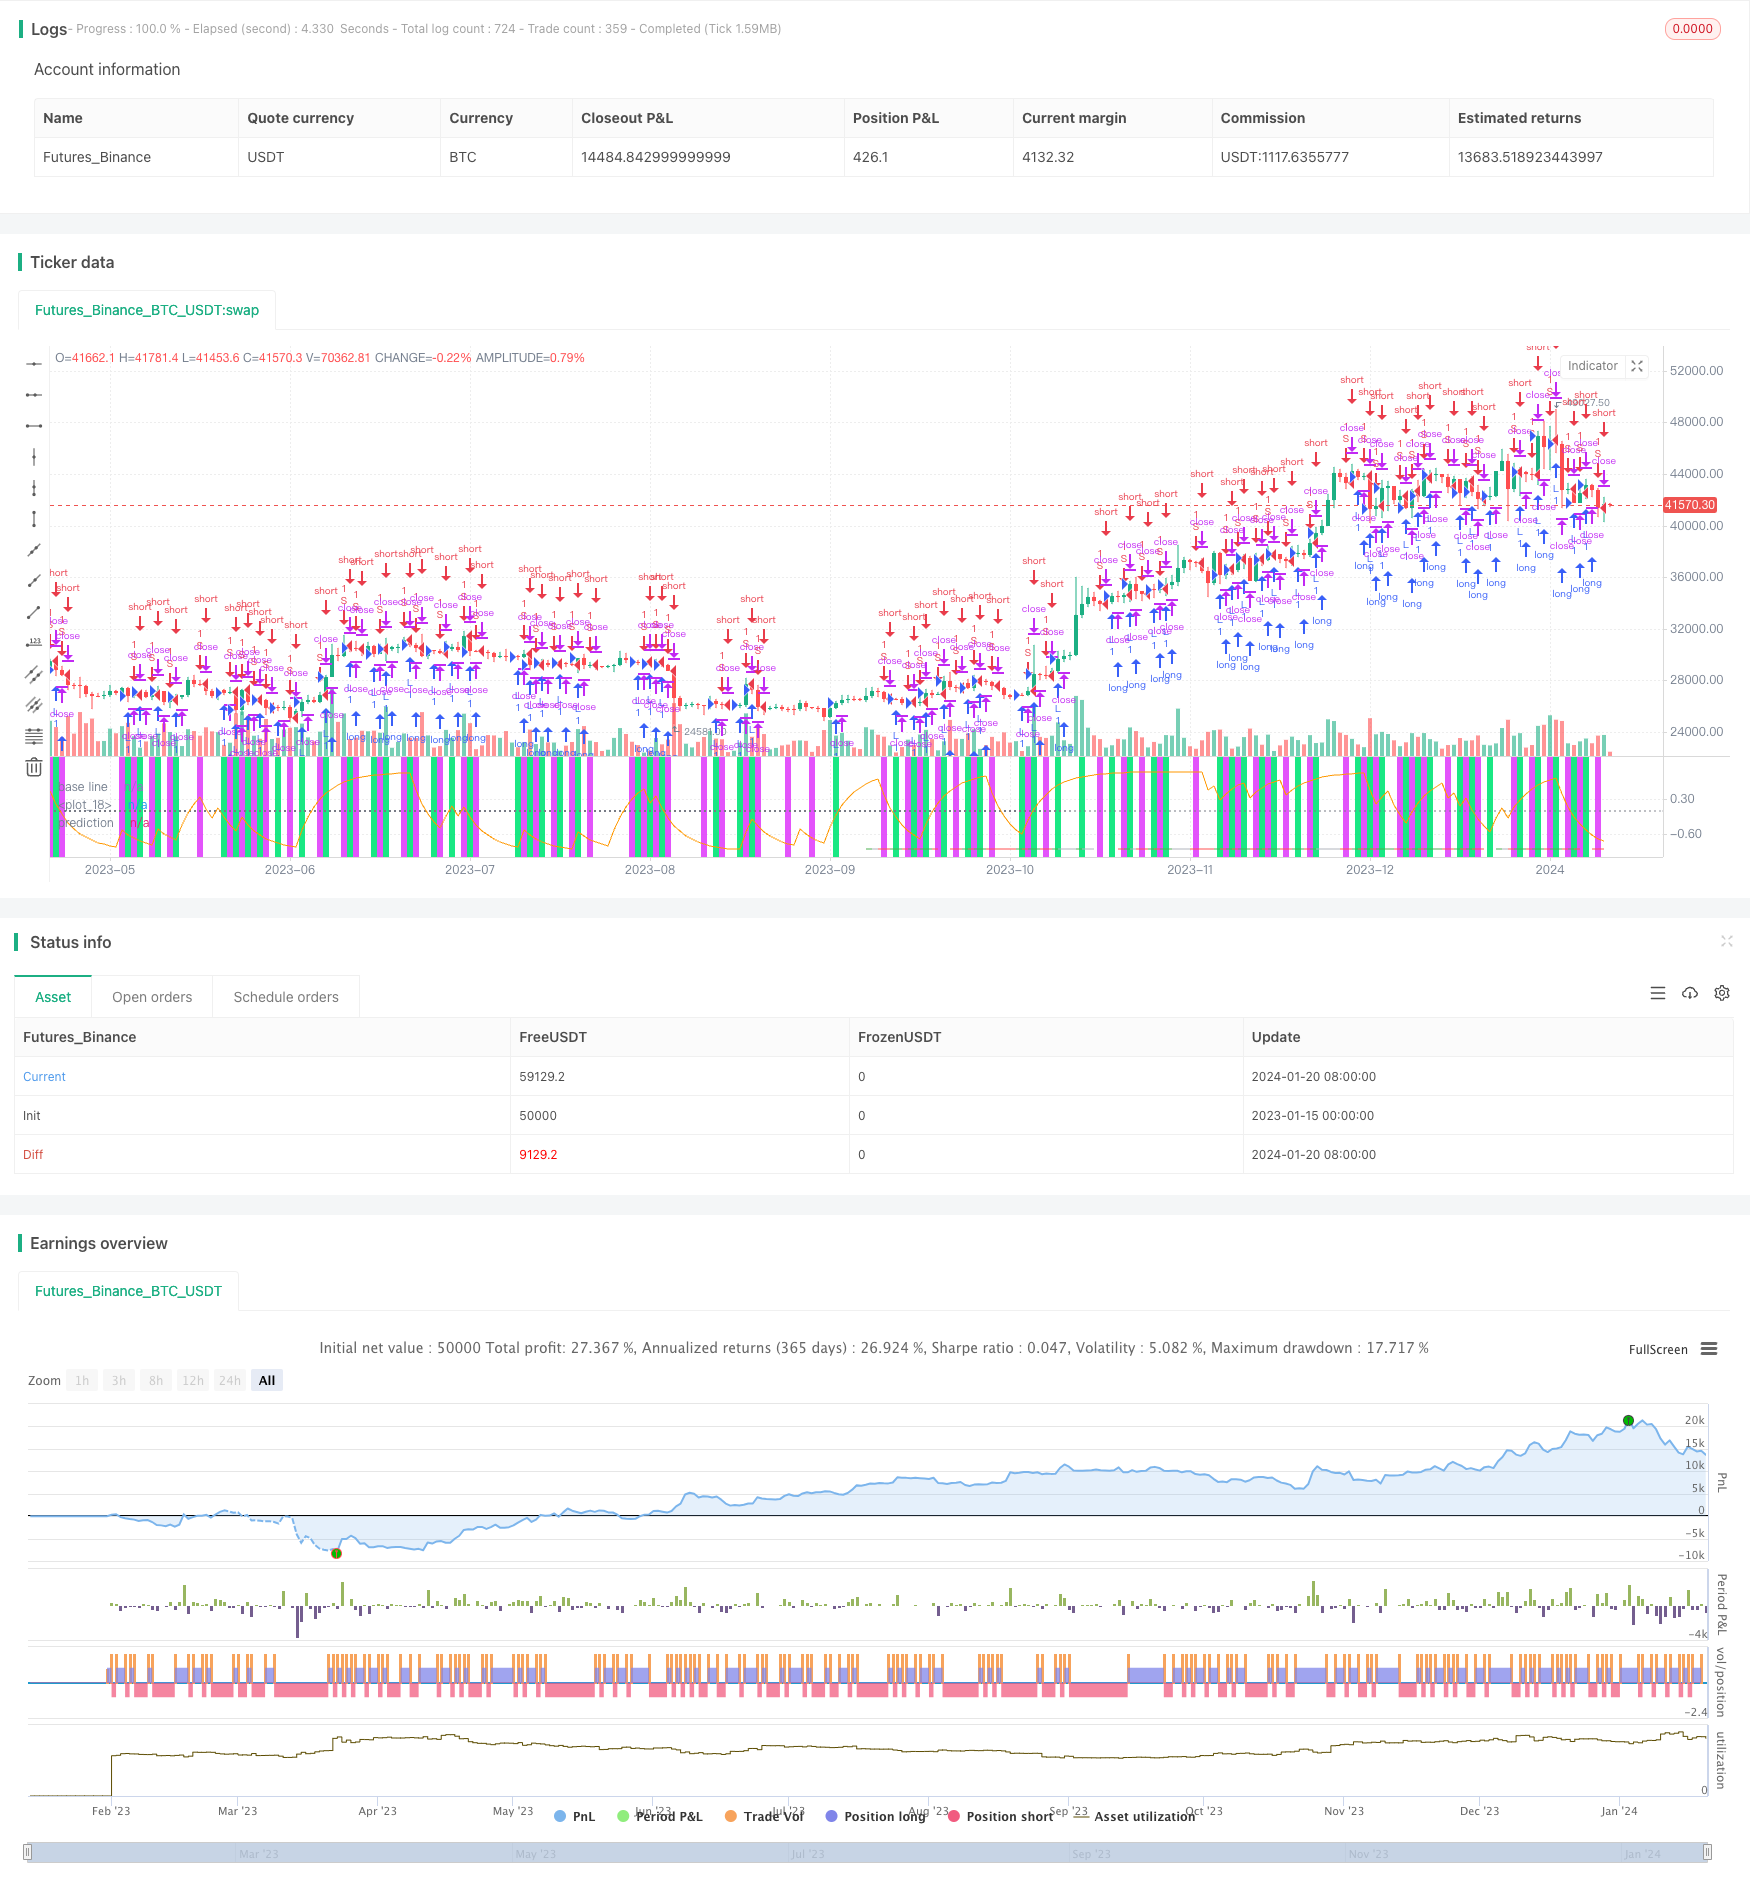
Overview
This is an improvement of drkhodakarami’s Scaled Normalized Vector strategy, mainly adding activation functions to enhance the strategy’s performance. The strategy calculates the rate of change in the market based on timeframe differences, and determines long and short signals based on threshold values. Meanwhile, swish, ReLU and step activation functions are introduced to smooth the differential sequence and improve the accuracy of signal judgement.
Strategy Logic
- Calculate the percentage price change x of close on the set timeframe
- Pass x to the activation function to get the processed sequence p
- Set positive and negative thresholds th, go long when p crosses above th, and go short when crossing below -th
- Disable repainting to avoid fake signals
Advantage Analysis
- Activation functions help filter noise and improve signal judgement
- New entry and close logic enables automated trading
- More parameter customization adapts to more markets
- Excellent visualization intuitively presents trade signals
Risk Analysis
- Improper threshold settings may miss trade opportunities
- Unsuitable activation functions may over-filter market information
- Repainting-induced signal distortions need testing
Solutions:
- Adjust threshold parameters to find optimum
- Try different activation functions to find the best match
- Add repainting detection logic to confirm valid signals
Optimization Directions
- Add adaptive threshold setting
- Optimize activation function parameters
- Incorporate automatic stop loss
- Filter signals with more factors
Conclusion
Based on drkhodakarami’s work, this strategy introduces activation functions to enhance performance. The expanded parameter customization better adapts to market changes. Meanwhile, the excellent visualization intuitively presents trading opportunities. Next steps are to further optimize activation functions and threshold settings, incorporate stop loss logic and more signal filtering to achieve even better strategy efficacy.
/*backtest
start: 2023-01-15 00:00:00
end: 2024-01-21 00:00:00
period: 1d
basePeriod: 1h
exchanges: [{"eid":"Futures_Binance","currency":"BTC_USDT"}]
*/

//@version=4
// author: capissimo
strategy("Scaled Normalized Vector Strategy, ver.4", precision=2, overlay=false)
// This is a modification of my Scaled Normalized Vector Strategy
// original: Drkhodakarami (https://www.tradingview.com/script/Fxv2xFWe-Normalized-Vector-Strategy-By-Drkhodakarami-Opensource/)

price    = input(close,  "Price Data")
tf       = input(18,     "Timeframe", minval=1, maxval=1440)
thresh   = input(14.,    "Threshold", minval=.1, step=.1)
div      = input(1000000,"Divisor", options=[1,10,100,1000,10000,100000,1000000,10000000,100000000])
mmx      = input(233,    "Minimax Lookback", options=[1, 2, 3, 5, 8, 13, 21, 34, 55, 89, 144, 233, 377, 610, 987, 1597, 2584])
showVol  = input(false,  "Volume")
useold   = input(true,   "Use Old System")
method   = input("Swish", "Activation", options=["Step", "LReLU", "Swish", "None"])

scaleMinimax(X, p, min, max) =>
    hi = highest(X, p), lo = lowest(X, p)
    (max - min) * (X - lo)/(hi - lo) + min

getdiff(prc, tf) =>
    prev  = scaleMinimax((useold ? security(syminfo.tickerid, tostring(tf), prc[1], barmerge.gaps_off, barmerge.lookahead_on)
                                 : security(syminfo.tickerid, tostring(tf), prc[1])), tf, 0, 1)
    curr  = scaleMinimax((useold ? security(syminfo.tickerid, tostring(tf), hlc3, barmerge.gaps_off, barmerge.lookahead_on)
                                 : security(syminfo.tickerid, tostring(tf), hlc3)), tf, 0, 1)
    (curr/prev) - 1

relu(x) => max(x, 0)
lrelu(x, alpha) => relu(x) - alpha * relu(-x)
step(x) => x >= 0 ? 1 : -1
log2(x) => log(x) / log(2)
sigmoid(x) => 1 / (1 + exp(-x))
swish(x) => x * sigmoid(x)

f(m) => method==m

vol  = useold ? security(syminfo.tickerid, tostring(tf), volume, barmerge.gaps_off, barmerge.lookahead_on)
              : security(syminfo.tickerid, tostring(tf), volume)
obv  = cum(change(price) > 0 ? vol : change(price) < 0 ? -vol : 0*vol)
prix = showVol ? obv : price
x    = getdiff(prix, tf)
p    = f("Swish") ? swish(x) : f("Step") ? step(x) : f("LReLU") ? lrelu(x, .8) : x
th   = thresh/div
long = crossover(p, th)
short= crossunder(p, -th)

lime  = color.new(color.lime, 10), fuchsia = color.new(color.fuchsia, 10),
black = color.new(color.black, 100), gray = color.new(color.gray, 50)
bg    = long ? lime : short ? fuchsia : black
cl    = p > th ? color.green : p < -th ? color.red : color.silver

bgcolor(bg, editable=false)
plot(scaleMinimax(th, mmx, -1, 1), color=lime, editable=false, transp=0)
hline(0, linestyle=hline.style_dotted, title="base line", color=gray, editable=false)
plot(scaleMinimax(-th, mmx, -1, 1), color=fuchsia, editable=false, transp=0)
plot(scaleMinimax(p, mmx, -1, 1), color=cl, style=plot.style_histogram, transp=70, editable=false)
plot(scaleMinimax(p, mmx, -1, 1), color=cl, style=plot.style_linebr, title="prediction", transp=0, editable=false)

strategy.entry("L", true, 1, when=long)
strategy.entry("S", false, 1, when=short)

alertcondition(long, title='Long', message='Long Signal!')
alertcondition(short, title='Short', message='Short Signal!')

//*** Karobein Oscillator
per  = input(8, "Karobein Osc Lookback")

prix2 = ema(price, per)
a = ema(prix2 < prix2[1] ? prix2/prix2[1] : 0, per)
b = ema(prix2 > prix2[1] ? prix2/prix2[1] : 0, per)
c = (prix2/prix2[1])/(prix2/prix2[1] + b)
d = 2*((prix2/prix2[1])/(prix2/prix2[1] + c*a)) - 1

plot(scaleMinimax(d, mmx, -1, 1), color=color.orange, transp=0)