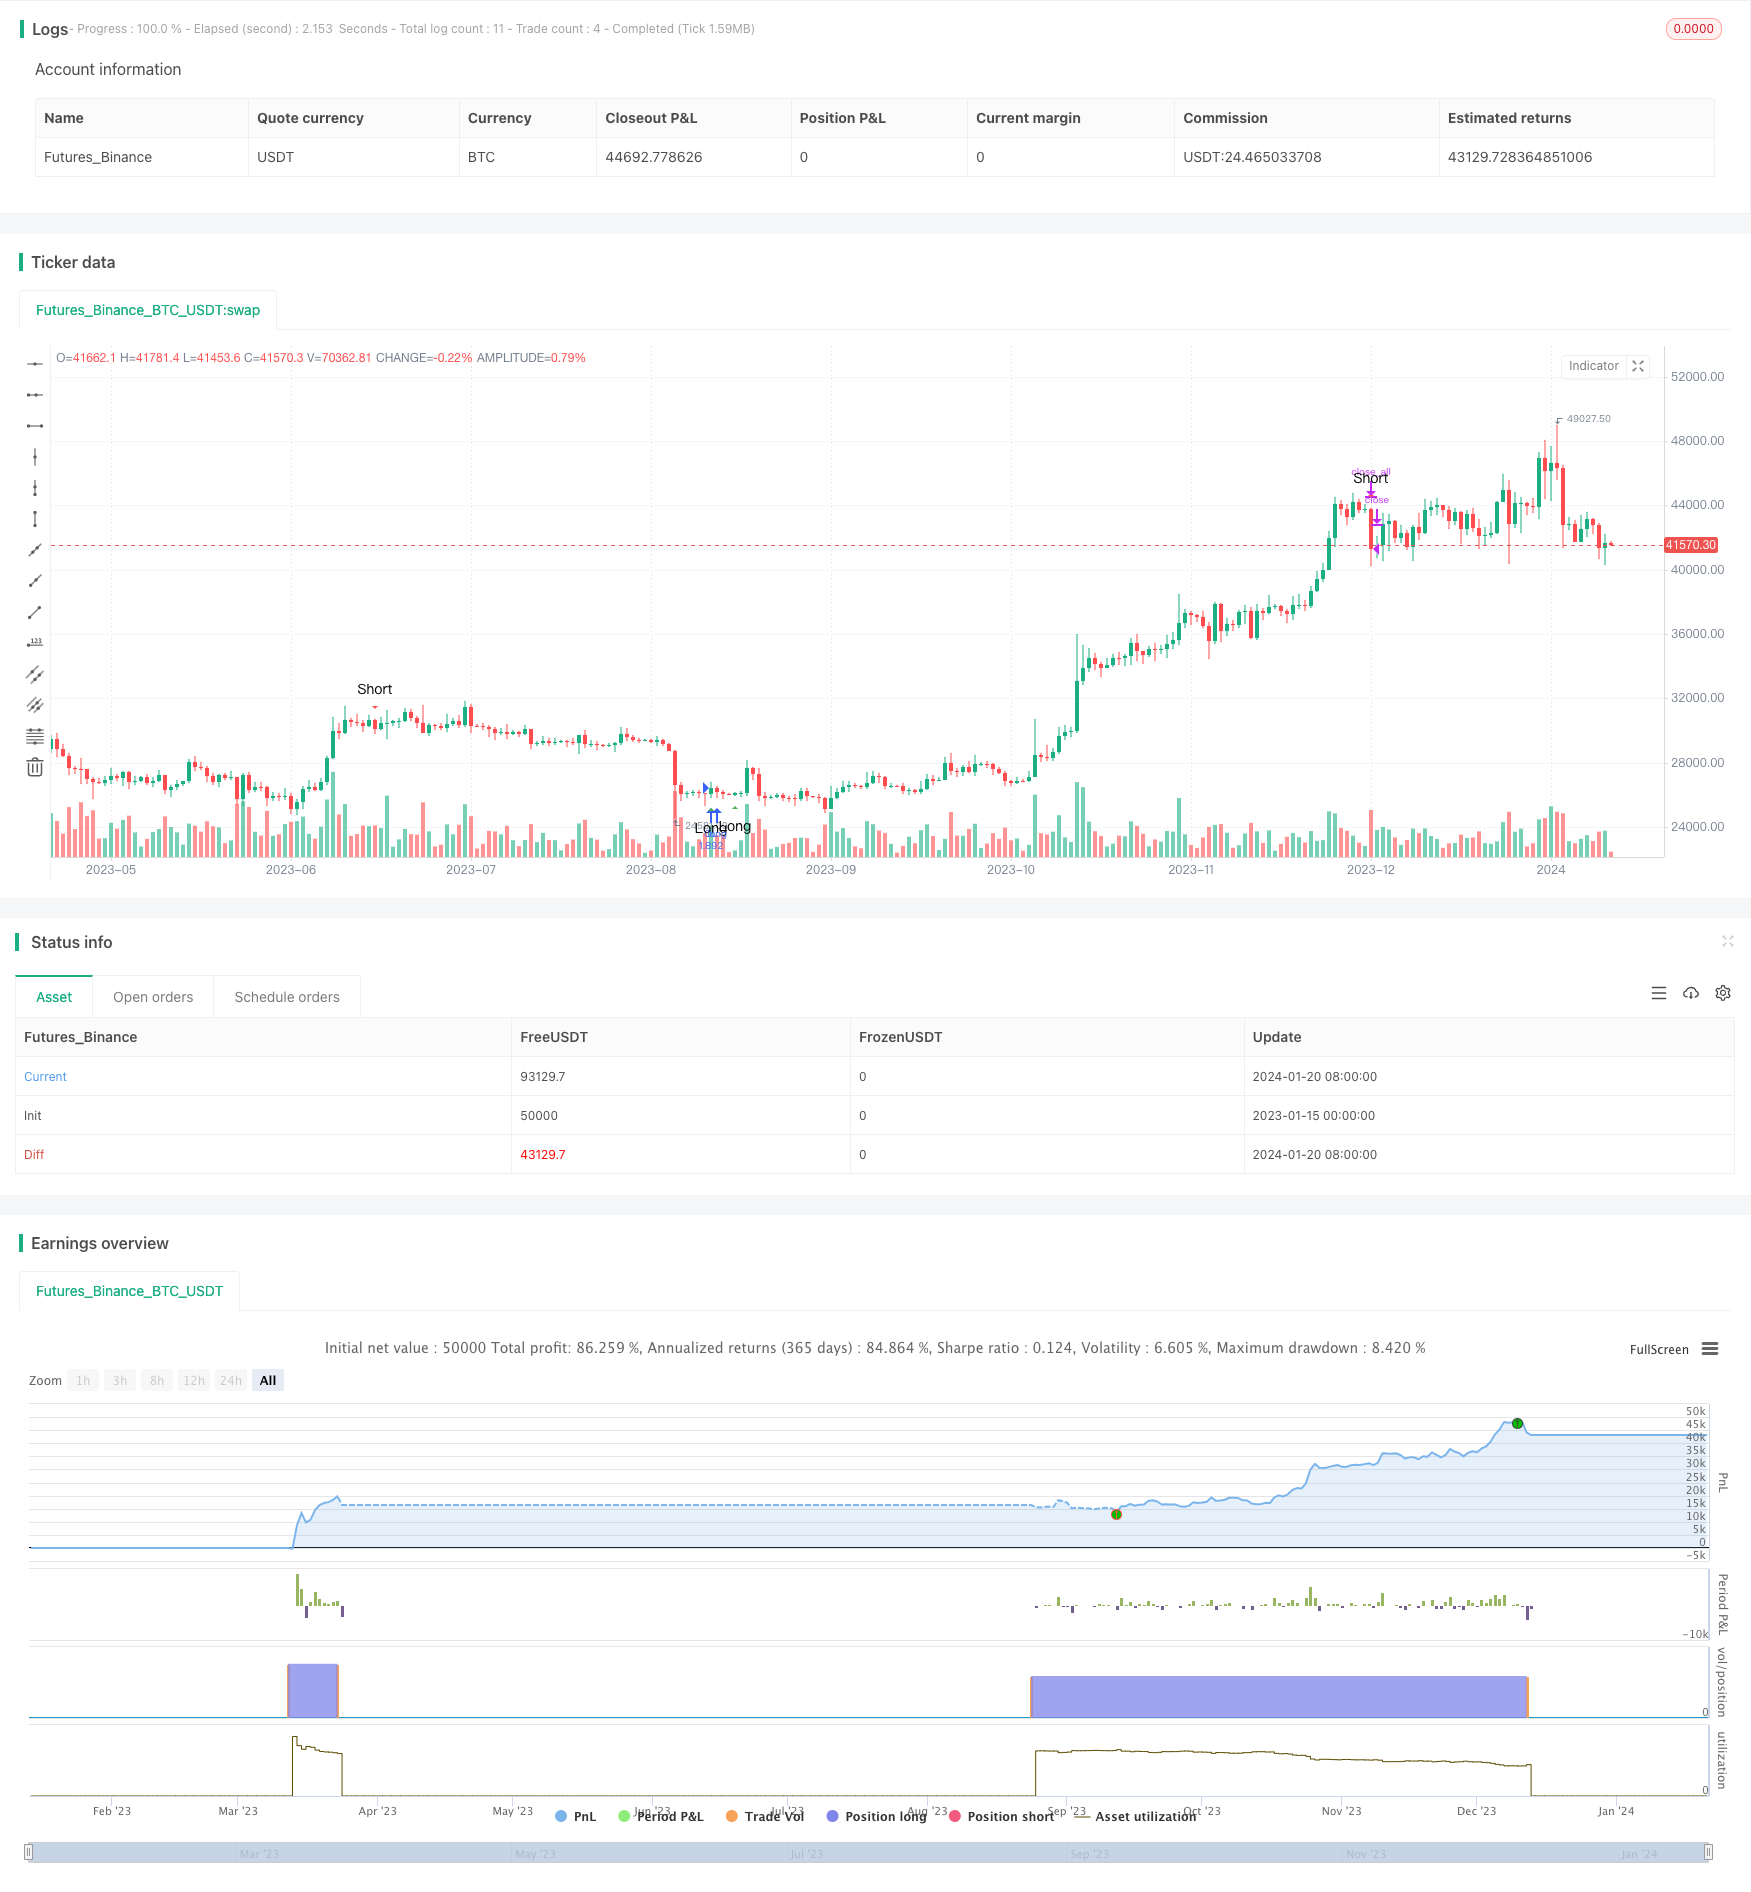
Low Risk DCA Trend Trading Strategy
Author: ChaoZhang, Date: 2024-01-22 10:20:40Tags:

Overview
This is a DCA trend trading strategy based on the BTCUSDT 4-hour timeframe. The main idea is to generate trading signals when there is divergence formed in the overbought/oversold areas of the RSI indicator. It then adopts a DCA trend following approach to open multiple positions and spread out the risk. The main features of this strategy are low risk and simple logic.
Strategy Logic
The strategy uses the RSI indicator to determine overbought/oversold signals. RSI greater than or equal to 70 is considered overbought, while RSI less than or equal to 30 is considered oversold. When RSI breaks down from the overbought area or bounces up from the oversold area, it indicates a potential top formation and triggers a sell signal. When RSI breaks up from the oversold area or bounces down from the overbought area, it indicates a potential bottom formation and triggers a buy signal.
To further confirm the signals, the strategy also incorporates engulfing candlestick patterns. Therefore, only when the RSI reversal aligns with a bearish engulfing candle in overbought scenarios or a bullish engulfing candle in oversold scenarios, a confirmed trading signal will be triggered. This helps to further reduce the probability of false signals.
Once a trading signal emerges, if it is a buy signal, the strategy will open a long position with a certain percentage of the closing price as the position size, and continue to place conditional buy stop orders to achieve a DCA effect, with a maximum of 5 open positions. If it is a sell signal, all existing long positions will be closed immediately.
Advantage Analysis
The biggest advantage of this strategy lies in controllable risks. Firstly, the combination of RSI and candlestick patterns greatly reduces false signal rates and ensures reliable signals. Secondly, the partial scaling in approach helps diversify risks so that losses on individual positions can be minimized even if the market moves against the trade idea. Also, the maximum number of positions is limited to 5 to avoid overconcentration. Lastly, conditional stop loss orders are placed to avoid uncontrolled losses on single positions. Therefore, from an overall perspective, low risks are the greatest strength.
Risk Analysis
The biggest risk is that holding periods could turn out longer than expected. By adopting scaling in and trend following techniques, position holding time tends to drag on especially when the market is not moving as favorably. This leads to mounting costs on open positions and even risks from trend reversals.
Additionally, the complex position opening logic also introduces risks from execution errors. Since it requires the simultaneous consideration of both RSI and candlestick signals, it has a steep learning curve and judgment errors can easily result in wrongly opened positions. This poses quite a challenge for beginners.
Enhancement Opportunities
The strategy can be enhanced from the following aspects:
-
Add stop loss logic. Mandatory stop losses can be introduced at certain loss threshold to avoid uncontrolled losses on single positions.
-
Optimize position sizing. Different position sizes can be backtested to discover a better risk-return profile.
-
Test other indicators. Alternative or auxiliary indicators like MACD and KD can be tried instead of RSI to improve signal accuracy.
-
Optimize timeframes. Different timeframe combinations can be tested to find the set of parameters that is most coherent with the strategy logic.
Conclusion
This low risk DCA trend trading strategy mainly uses RSI plus candlestick signals and adopts trailing stop orders to scale into positions. It has controllable risks and suits investors with relatively low risk tolerance. But it also suffers from potential issues like overextended holding periods and execution errors. Further enhancements around optimization can help improve strategy performance. Overall it is a recommended system.
/*backtest
start: 2023-01-15 00:00:00
end: 2024-01-21 00:00:00
period: 1d
basePeriod: 1h
exchanges: [{"eid":"Futures_Binance","currency":"BTC_USDT"}]
*/

//@version=4
strategy("Phil's Pine Scripts - low risk long DCA Trend trade", overlay=true)

////
//// trade on BTCUSDT 4H chart
//// $500 balance = $50 per trade, max 5 positions
//// backtested 54% profit over 3 years (~270)
////

//// define $ amount per trade
position_size = 50000

//// Plot short / long signals

// Get user input
rsiSource = input(title="RSI Source", type=input.source, defval=close)
rsiLength = input(title="RSI Length", type=input.integer, defval=14)
rsiOverbought = input(title="RSI Overbought Level", type=input.integer, defval=70)
rsiOversold = input(title="RSI Oversold Level", type=input.integer, defval=30)

// Get RSI value
rsiValue = rsi(rsiSource, rsiLength)
rsiOB = rsiValue >= rsiOverbought
rsiOS = rsiValue <= rsiOversold

// Identify engulfing candles
bullishEC = close > open[1] and close[1] < open[1]
bearishEC = close < open[1] and close[1] > open[1]
tradeSignal = ((rsiOS or rsiOS[1]) and bullishEC) or ((rsiOB or rsiOB[1]) and bearishEC)

// Plot signals to chart
plotshape(tradeSignal and bullishEC, title="Long", location=location.belowbar, color=color.green, transp=0, style=shape.triangleup, text="Long")
plotshape(tradeSignal and bearishEC, title="Short", location=location.abovebar, color=color.red, transp=0, style=shape.triangledown, text="Short")

//// DCA long trade when there is a bullish signal

if tradeSignal and bullishEC
    strategy.entry("OL", strategy.long, qty=position_size / close)

//// Close all positions when there is a bearish signal

if tradeSignal and bearishEC
    strategy.close_all()
- RSI Divergence Trading Strategy
- Multi-Indicator Decision Tree Strategy: IMACD, EMA and Ichimoku
- MACD Double Optimization Trading Strategy
- Dual EMA Golden Cross Strategy
- Multi-timeframe RSI and Moving Average Trading Strategy
- Weekly Swing Trading Strategy
- EVWMA based MACD Trading Strategy
- Bollinger Bands Channel Breakout Mean Reversion Strategy
- Quantitative Trend Tracking Strategy Based on Multiple Technical Indicators
- RSI & CCI Combination Quantitative Trading Strategy
- Stochastic Momentum Strategy
- Momentum Oscillator Trend Tracking Strategy
- Zero Lag Overlapping Moving Average with Chandelier Exit Trading Strategy
- RSI 5 Momentum Trading Strategy
- Scaled Normalized Vector Strategy with Activation Functions, ver.4
- Trend Following Strategy Based on Historical High
- Cryptocurrency Trend Following Strategy Based on Heiken Ashi
- Quantitative Strategy of MA Strength Trend Tracking
- Dual Moving Average Price Channel Trading Strategy
- Bitcoin and Gold 5-Minute Scalping Strategy 2.0