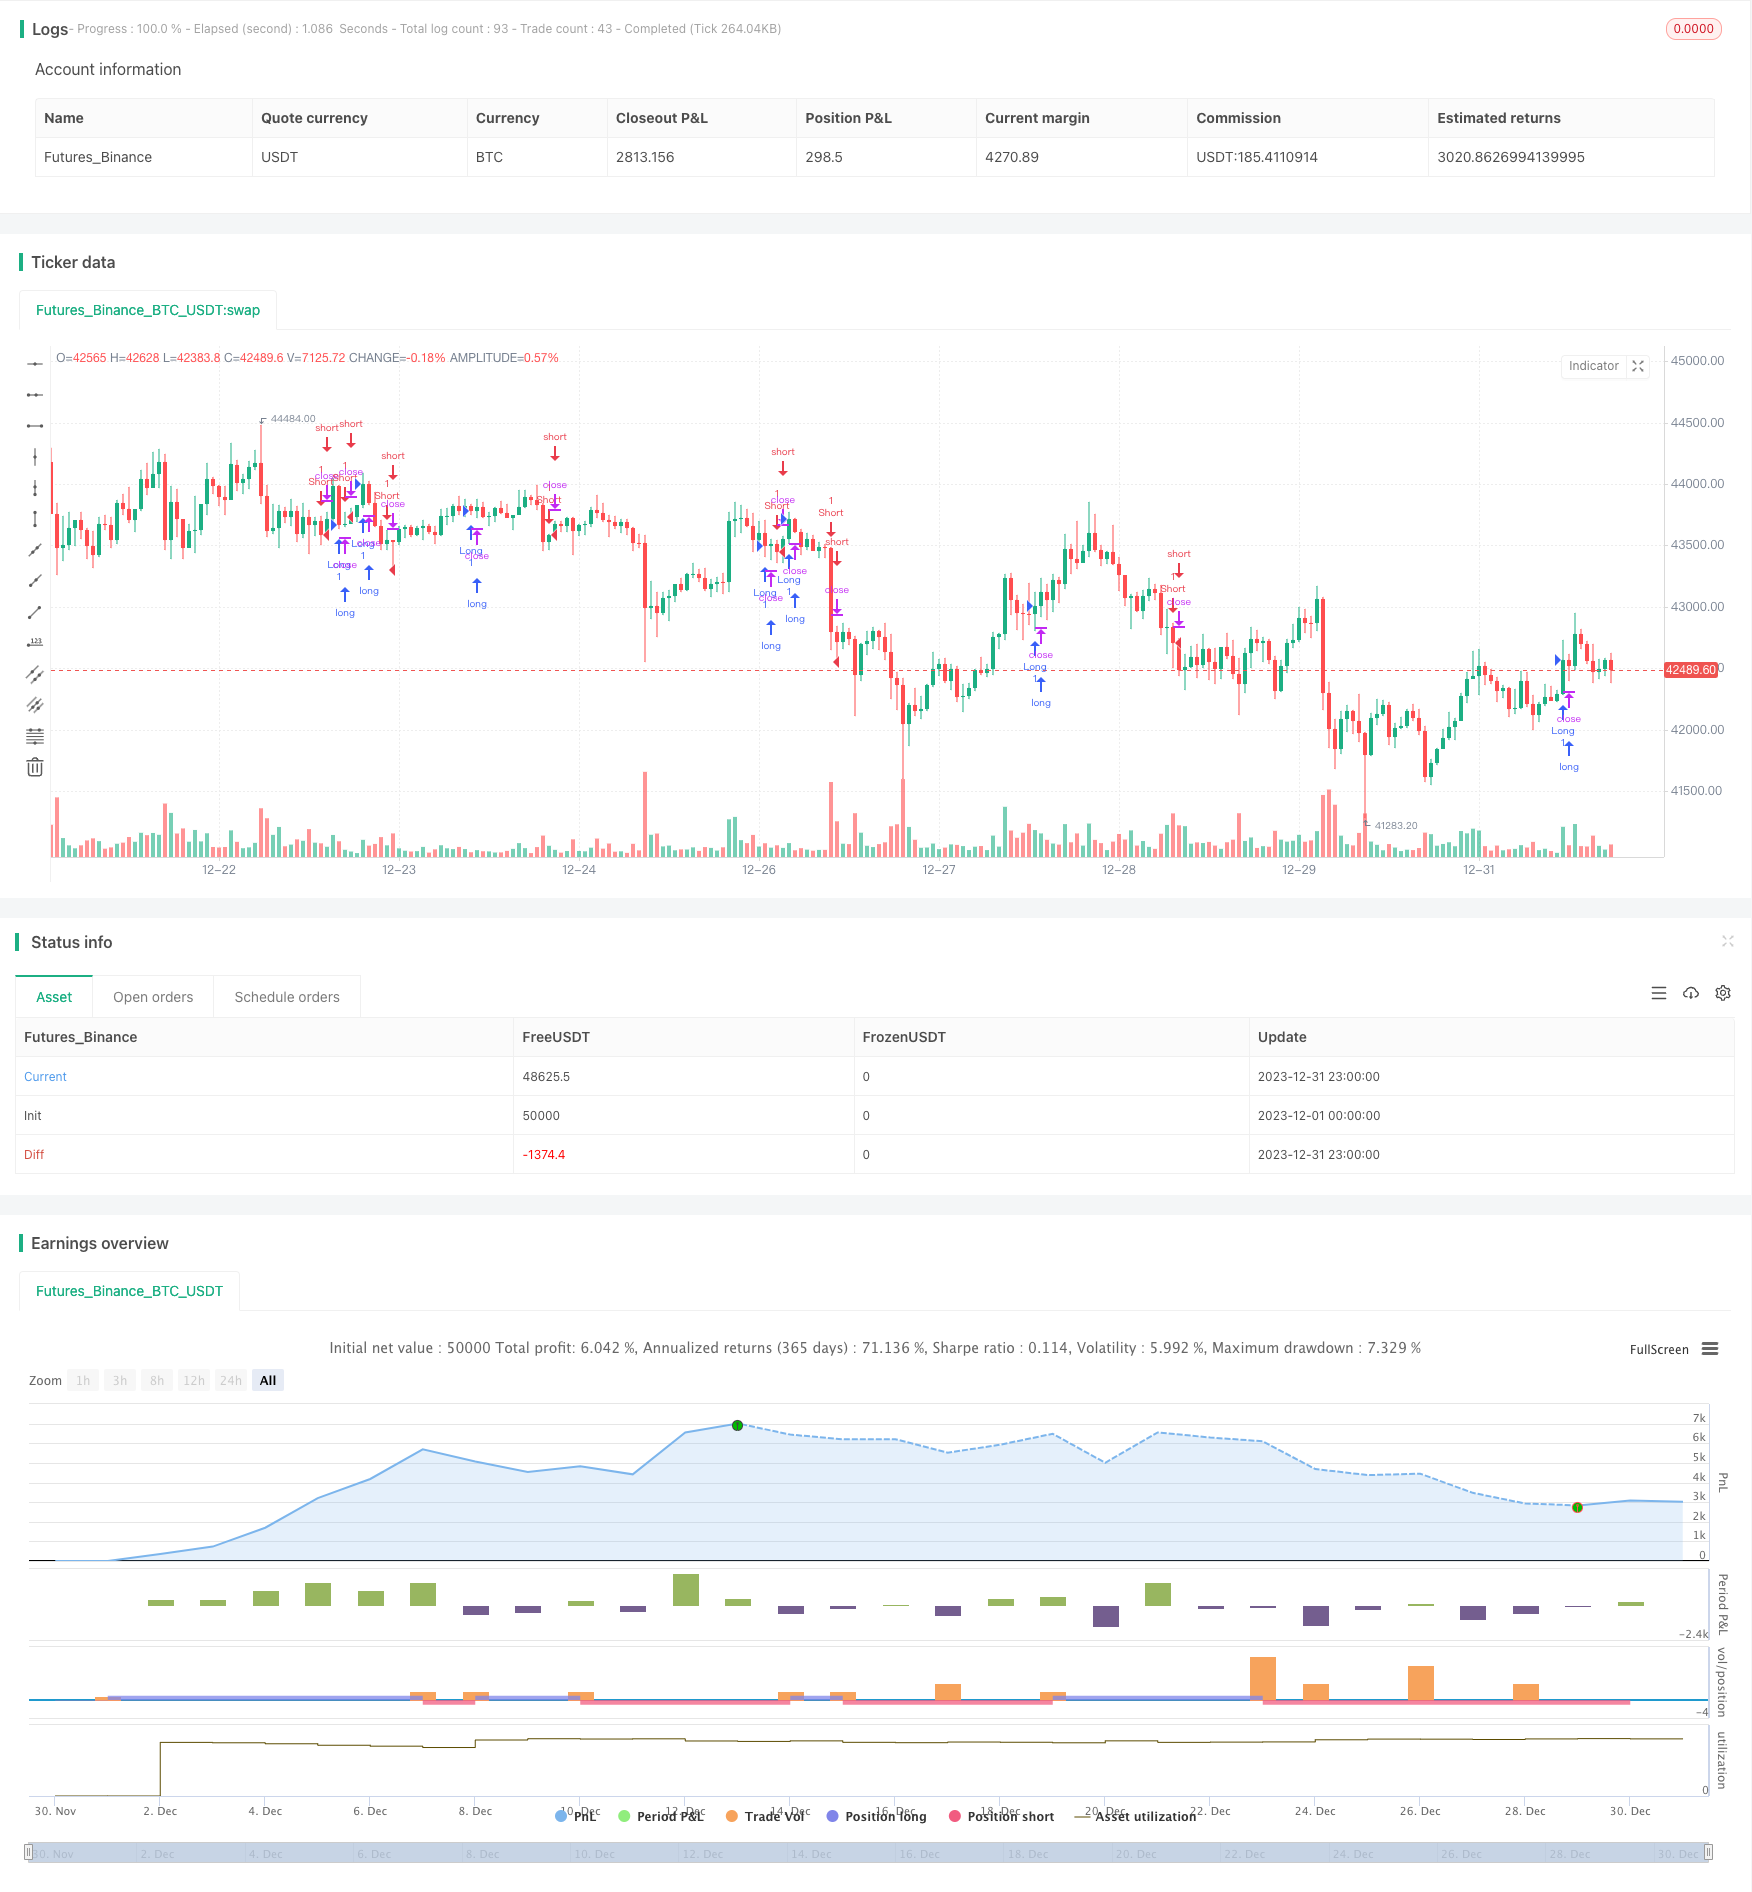
Overview
This strategy is built based on the dual EMA indicator for the purpose of recognizing price trends and following the trends. It first calculates the medium-to-long term EMA and short-term EMA, and then implements long position when there is golden cross and short position when there is death cross between the two EMAs. Meanwhile, the highest/lowest filtering is also introduced to further eliminate false signals.
Strategy Principles
The core indicators of this strategy are the dual EMAs, one is short-term and the other is long-term. Specifically, the following variables are defined in the strategy:
ema1: Medium-to-long term EMA period, default to 34 days
ema2: Short-term EMA period, default to 13 days
ema_sr: Medium-to-long term EMA based on close price
highest_ema: Highest EMA of ema_sr, period is ema2
lowest_ema: Lowest EMA of ema_sr, period is ema2
ema_ysl: EMA used to generate trading signals, calculated based on relationship between ema_sr and highest/lowest_ema
crosses detect golden and death crosses between ema_sl and ema_ysl, and thus achieve trend following.
The combination of dual EMA can judge price trends more accurately. The medium-to-long term EMA filters out short-term noise, while the short-term EMA can timely trace the turns of medium-term trends. The introduction of highest/lowest EMA can further eliminate false signals and reduce unnecessary trades.
Advantage Analysis
The biggest advantage of this strategy lies in its accurate trend identification. The dual EMA itself is superior to single EMA, SMA and other indicators for capturing trend changes. And the application of highest/lowest_ema can effectively filter out false signals caused by short-term pullbacks, which is critical for trend following strategies.
In addition, the parameters of this strategy is simple and easy to adjust and optimize. Users only need to focus on the two EMA parameters, which is very intuitive. This also makes the strategy easy to understand and use.
Risk Analysis
The main risk of this strategy is that it fails to identify trend reversals. When the price forms long-term adjustments or major turns, the lag of the dual EMA may lead to missing the best entry points. At this time, oversized position may lead to greater losses.
In addition, the EMA itself has no ability to respond to emergencies. The strategy may also suffer losses when black swan events occur.
To mitigate the above risks, we recommend appropriately shortening the length of the medium-to-long term EMA, or introducing indicators like MACD to cope with emergencies. At the same time, stop loss can also be set to control maximum losses.
Optimization Directions
There is room for further optimization of this strategy. Specifically, the main directions are as follows:
Test more combinations of EMA parameters to find the optimal parameters;
Add volume judgment to avoid issuing wrong signals when price oscillates;
Combine trend lines, channels and other tools to judge trend turning points more accurately.
Through parameter optimization, adding filter conditions and other means, it is promising to further improve the stability and profitability of the strategy. This requires quantitative analysts to continuously conduct backtests and optimizations.
Summary
In general, this strategy has relatively strong ability to identify trends by filtering out noise with dual EMA and effectively smoothing the price curve. The introduction of Highest/Lowest EMA also enhances the reliability of signals. Judging from the backtest results, the strategy can obtain good steady returns.
However, the strategy itself has some lag in timely identifying trend reversals. This is the main risk it faces and also the key direction for future optimizations. We look forward to further enhancing the robustness of the strategy through parameter tuning, signal filtering and other means, so that it can achieve steady returns under more market environments.
/*backtest
start: 2023-12-01 00:00:00
end: 2023-12-31 23:59:59
period: 1h
basePeriod: 15m
exchanges: [{"eid":"Futures_Binance","currency":"BTC_USDT"}]
*/

//@version=3
// Modified from kivancfr3762's A2MK script

strategy("EMA STRATEGY", overlay=true)

ema2=input(13, "EMA2 Length")
ema1=input(34, "EMA1 Length")

ema_sr = ema((max(close[1], high) + min(close[1], low)) / 2, ema1)

highest_ema = ema(highest(ema_sr, 3), ema2)
lowest_ema = ema(lowest(ema_sr, 3), ema2)
k1 = ema_sr > highest_ema
k2 = ema_sr < lowest_ema

ema_ysl = iff(k1, lowest_ema, highest_ema)


longCondition = crossover(ema_ysl, ema_sr)
if (longCondition)
    strategy.entry("Short", strategy.short)

shortCondition = crossunder(ema_ysl, ema_sr)
if (shortCondition)
    strategy.entry("Long", strategy.long)