概述
该策略运用RSI指标判断市场超买超卖的同时,结合布林带上下轨来判断价格震荡范围。此外,基于高低点生成动态支撑阻力,发现价格接近支撑阻力时才实施买入卖出操作。用户可自行设定趋势过滤条件,例如简单移动均线判断价格与趋势方向一致时才交易。该策略综合运用多种技术指标,判断力较强,可以有效把握市场机会。
策略原理
该策略主要由RSI指标、布林带、动态支撑阻力 3部分组成。
RSI部分用于判断超买超卖。RSI低于30时为超卖区域,此时将发出买入信号。RSI高于70时为超卖区域,此时将发出卖出信号。
布林带是根据价格均线及标准差计算上下轨,用于判断价格是否脱离常态震荡区间。价格接近上轨时卖出,接近下轨时买入。
支撑阻力部分运用动态计算方法,以一定周期内的最高最低价(或开收盘价)为基准,限定一定百分比内的范围,并记录价格历史翻转点作为关键支撑阻力位。当价格升至关键阻力位附近时,发出卖出信号;当价格跌至关键支撑位时,发出买入信号。
综上,该策略同时满足RSI超买超卖、价格脱离常态区间、接近动态支撑阻力 3个条件时,才会实施买入卖出操作。
策略优势
基本面指标与技术指标相结合。RSI判断基本面超买超卖的同时,运用布林带判断价格技术形态。
动态支撑阻力计算,更贴近价格运动的真实支撑阻力。
用户可添加趋势过滤器,配合RSI及布林带,判断力大大提高,可过滤掉大部分噪音信号。
策略风险
RSI参数设定不当可能导致误判。RSI长度过短会增加噪声;RSI超买超卖阈值设定不当也易造成失误。
布林带参数如长度、 StdDev倍数设定不当也会影响判断准确性。
动态支撑阻力因计算历史高低点而产生滞后。用户应适当优化支撑阻力参数,使支撑阻力水平更贴近当前价格。
本策略较复杂,多指标组合可能产生互相干扰。用户应测试指标参数,减少指标冲突。另外可适当简化组合条件,减少误判概率。
策略优化方向
测试RSI参数设置,优化RSI长度、超买超卖阈值。
测试布林带参数设置,优化布林带长度、StdDev 倍数。
优化动态支撑阻力参数,使支撑阻力水平更贴近价格。可尝试更短周期、更少历史高低点等设定。
添加或测试其它辅助指标,如 KDJ、MACD等与RSI形成组合,提高判断准确度。
测试趋势过滤器参数,优化过滤器长度,提高持仓时间,减少不必要反向操作。
总结
本策略综合运用RSI、布林带、动态支撑阻力等多个指标,充分发挥各指标优势,相互验证,判断力较强。同时可添加趋势过滤器进一步减少噪声。该策略参数设置灵活,用户可根据自己需要调整参数组合。在进行参数优化测试后,效果会更加明显。这是一个非常有潜力的量化策略
/*backtest
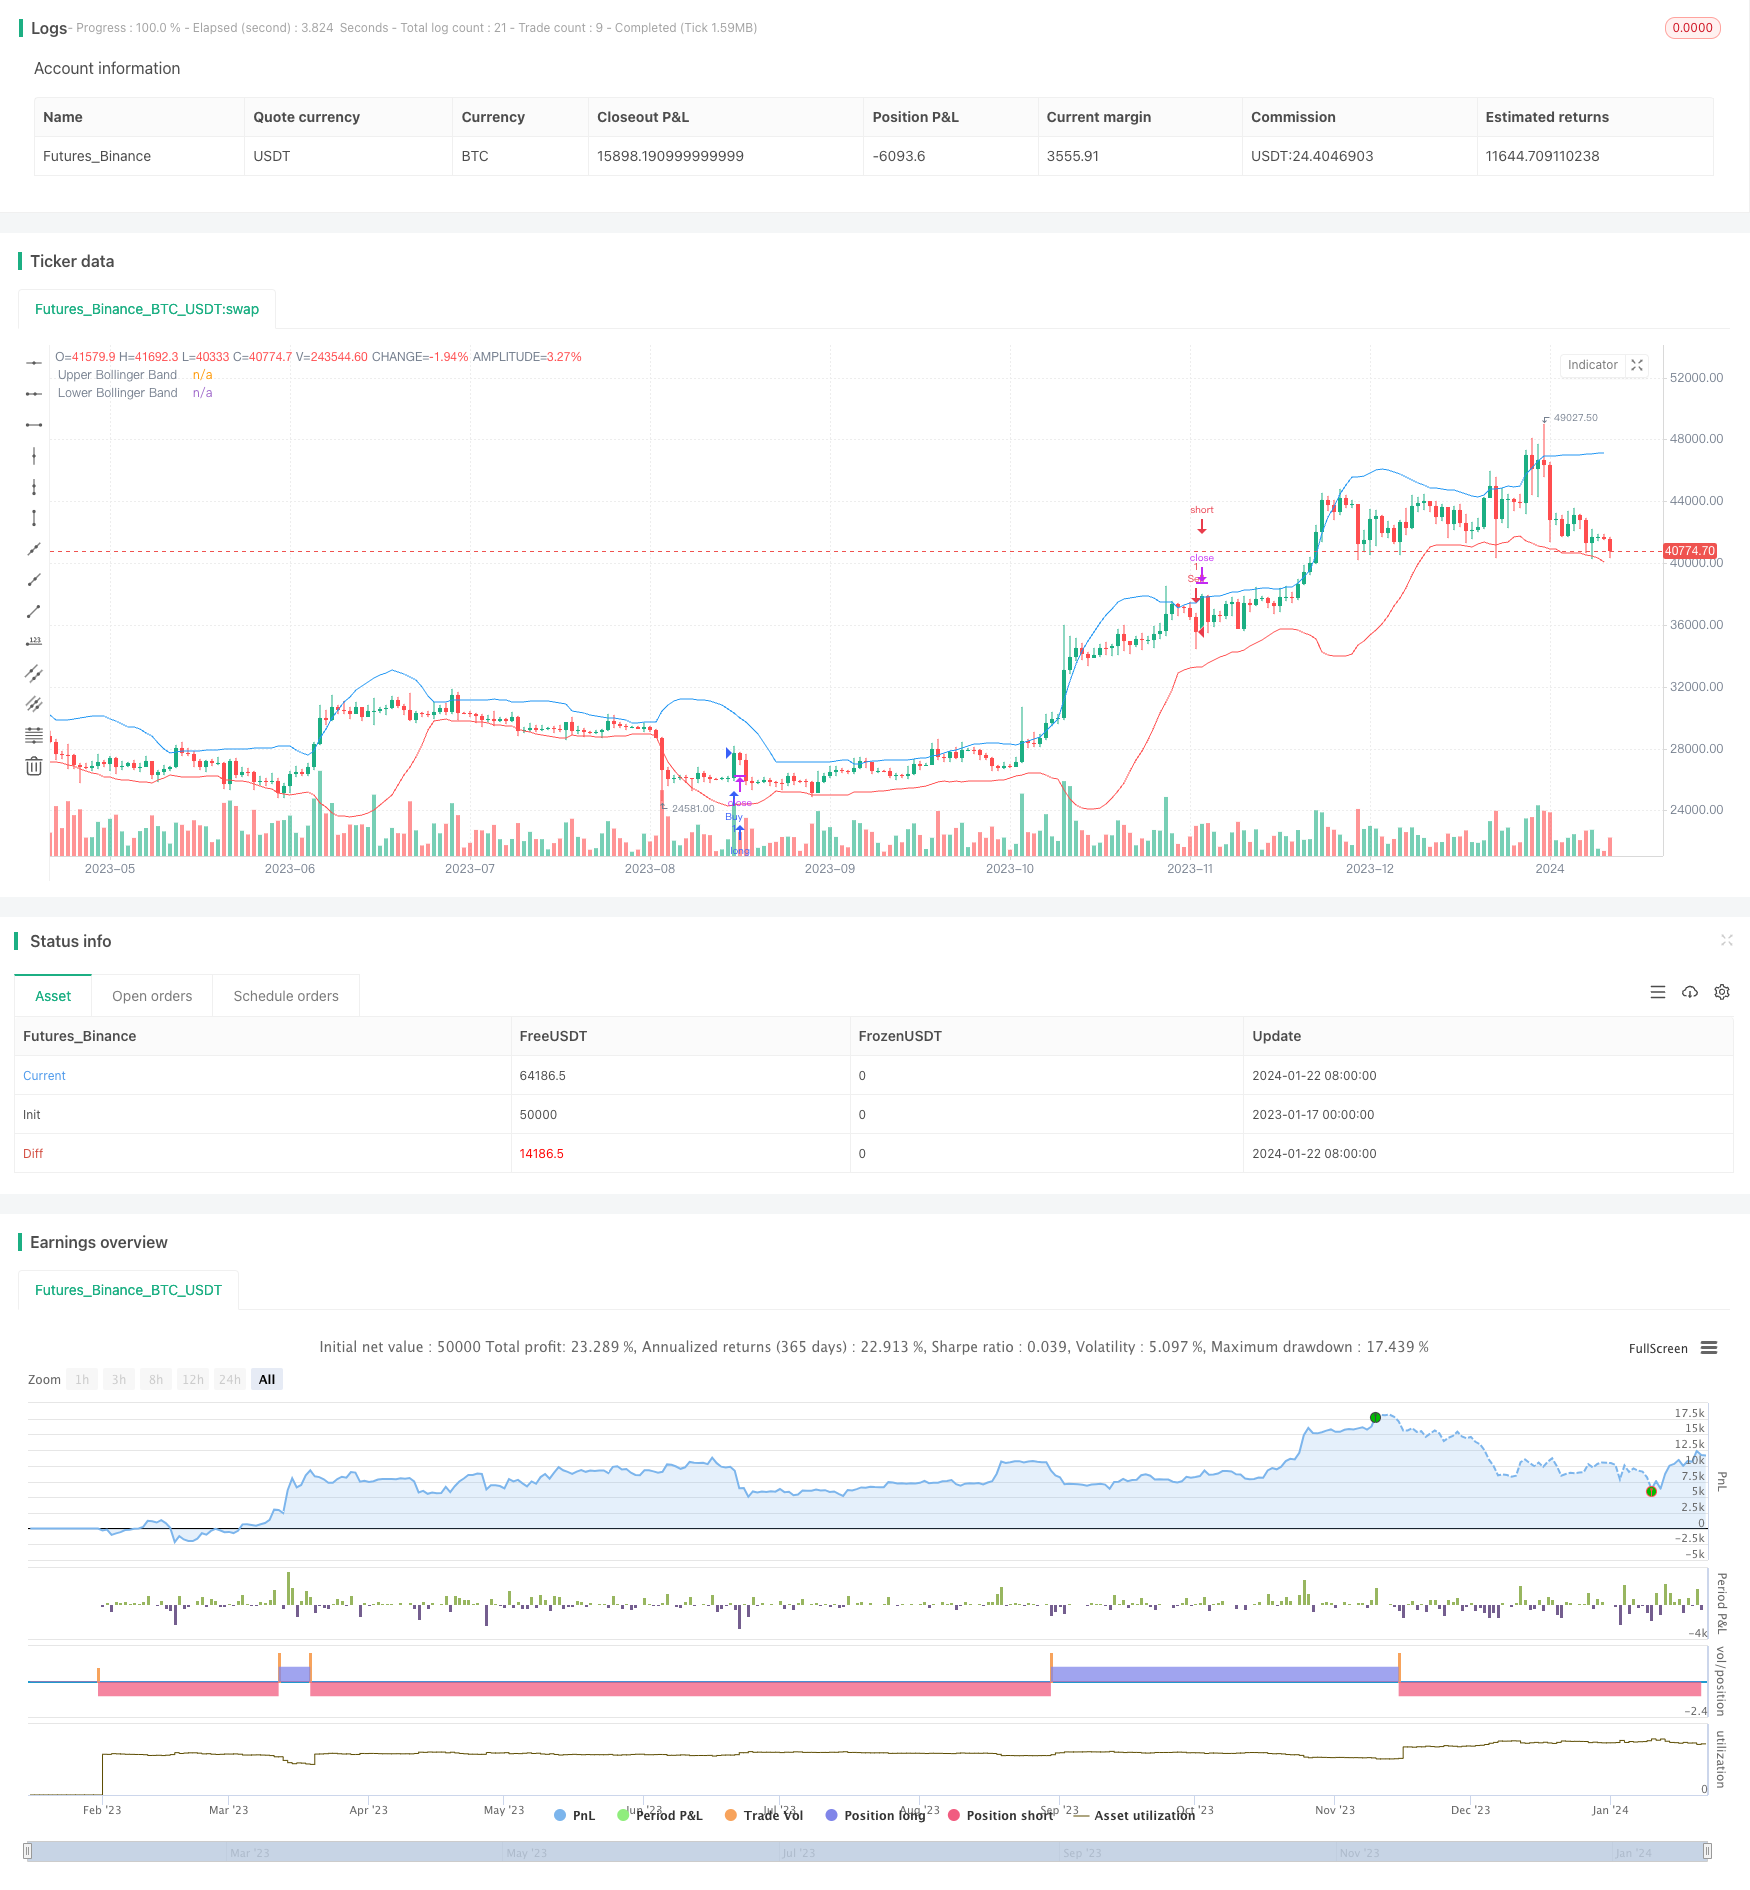
start: 2023-01-17 00:00:00
end: 2024-01-23 00:00:00
period: 1d
basePeriod: 1h
exchanges: [{"eid":"Futures_Binance","currency":"BTC_USDT"}]
*/
//@version=5
strategy("RSI + BB + S/R Strategy with Trend Filter", shorttitle="RSI + BB + S/R + Trend Filter", overlay=true)
// RSI Settings
rsi_length = input.int(14, title="RSI Length")
overbought = input.int(70, title="Overbought Level")
oversold = input.int(30, title="Oversold Level")
// Bollinger Bands Settings
bb_length = input.int(20, title="BB Length")
bb_deviation = input.float(2.0, title="BB Deviation")
// Dynamic Support/Resistance Settings
pivot_period = input.int(10, title="Pivot Period")
pivot_source = input.string("High/Low", title="Pivot Source", options=["High/Low", "Close/Open"])
max_pivots = input.int(20, title="Maximum Number of Pivot", minval=5, maxval=100)
channel_width = input.int(10, title="Maximum Channel Width %", minval=1)
max_sr_levels = input.int(5, title="Maximum Number of S/R Levels", minval=1, maxval=10)
min_strength = input.int(2, title="Minimum Strength", minval=1, maxval=10)
// Trend Filter Settings
use_trend_filter = input.bool(false, title="Use Trend Filter")
trend_filter_length = input.int(50, title="Trend Filter Length")
// Calculate RSI and Bollinger Bands
rsi = ta.rsi(close, rsi_length)
basis = ta.sma(close, bb_length)
deviation = ta.stdev(close, bb_length)
upper_band = basis + bb_deviation * deviation
lower_band = basis - bb_deviation * deviation
// Plot Bollinger Bands on the chart
plot(upper_band, color=color.blue, title="Upper Bollinger Band")
plot(lower_band, color=color.red, title="Lower Bollinger Band")
// Dynamic Support/Resistance Calculation
float src1 = pivot_source == "High/Low" ? high : math.max(close, open)
float src2 = pivot_source == "High/Low" ? low : math.min(close, open)
float ph = ta.pivothigh(src1, pivot_period, pivot_period)
float pl = ta.pivotlow(src2, pivot_period, pivot_period)
// Calculate maximum S/R channel zone width
prdhighest = ta.highest(300)
prdlowest = ta.lowest(300)
cwidth = (prdhighest - prdlowest) * channel_width / 100
var pivotvals = array.new_float(0)
if ph or pl
array.unshift(pivotvals, ph ? ph : pl)
if array.size(pivotvals) > max_pivots
array.pop(pivotvals)
get_sr_vals(ind) =>
float lo = array.get(pivotvals, ind)
float hi = lo
int numpp = 0
for y = 0 to array.size(pivotvals) - 1 by 1
float cpp = array.get(pivotvals, y)
float wdth = cpp <= lo ? hi - cpp : cpp - lo
if wdth <= cwidth
if cpp <= hi
lo := math.min(lo, cpp)
else
hi := math.max(hi, cpp)
numpp += 1
[hi, lo, numpp]
var sr_up_level = array.new_float(0)
var sr_dn_level = array.new_float(0)
sr_strength = array.new_float(0)
find_loc(strength) =>
ret = array.size(sr_strength)
for i = ret > 0 ? array.size(sr_strength) - 1 : na to 0 by 1
if strength <= array.get(sr_strength, i)
break
ret := i
ret
check_sr(hi, lo, strength) =>
ret = true
for i = 0 to array.size(sr_up_level) > 0 ? array.size(sr_up_level) - 1 : na by 1
if array.get(sr_up_level, i) >= lo and array.get(sr_up_level, i) <= hi or array.get(sr_dn_level, i) >= lo and array.get(sr_dn_level, i) <= hi
if strength >= array.get(sr_strength, i)
array.remove(sr_strength, i)
array.remove(sr_up_level, i)
array.remove(sr_dn_level, i)
else
ret := false
break
ret
if ph or pl
array.clear(sr_up_level)
array.clear(sr_dn_level)
array.clear(sr_strength)
for x = 0 to array.size(pivotvals) - 1 by 1
[hi, lo, strength] = get_sr_vals(x)
if check_sr(hi, lo, strength)
loc = find_loc(strength)
if loc < max_sr_levels and strength >= min_strength
array.insert(sr_strength, loc, strength)
array.insert(sr_up_level, loc, hi)
array.insert(sr_dn_level, loc, lo)
if array.size(sr_strength) > max_sr_levels
array.pop(sr_strength)
array.pop(sr_up_level)
array.pop(sr_dn_level)
// Calculate the Trend Filter
trend_filter = use_trend_filter ? ta.sma(close, trend_filter_length) : close
// Buy Condition (RSI + Proximity to Support + Trend Filter)
buy_condition = ta.crossover(rsi, oversold) and close <= ta.highest(high, max_sr_levels) and close >= ta.lowest(low, max_sr_levels) and (not use_trend_filter or close > trend_filter)
// Sell Condition (RSI + Proximity to Resistance + Trend Filter)
sell_condition = ta.crossunder(rsi, overbought) and close >= ta.lowest(low, max_sr_levels) and close <= ta.highest(high, max_sr_levels) and (not use_trend_filter or close < trend_filter)
// Strategy Orders
strategy.entry("Buy", strategy.long, when = buy_condition)
strategy.entry("Sell", strategy.short, when = sell_condition)