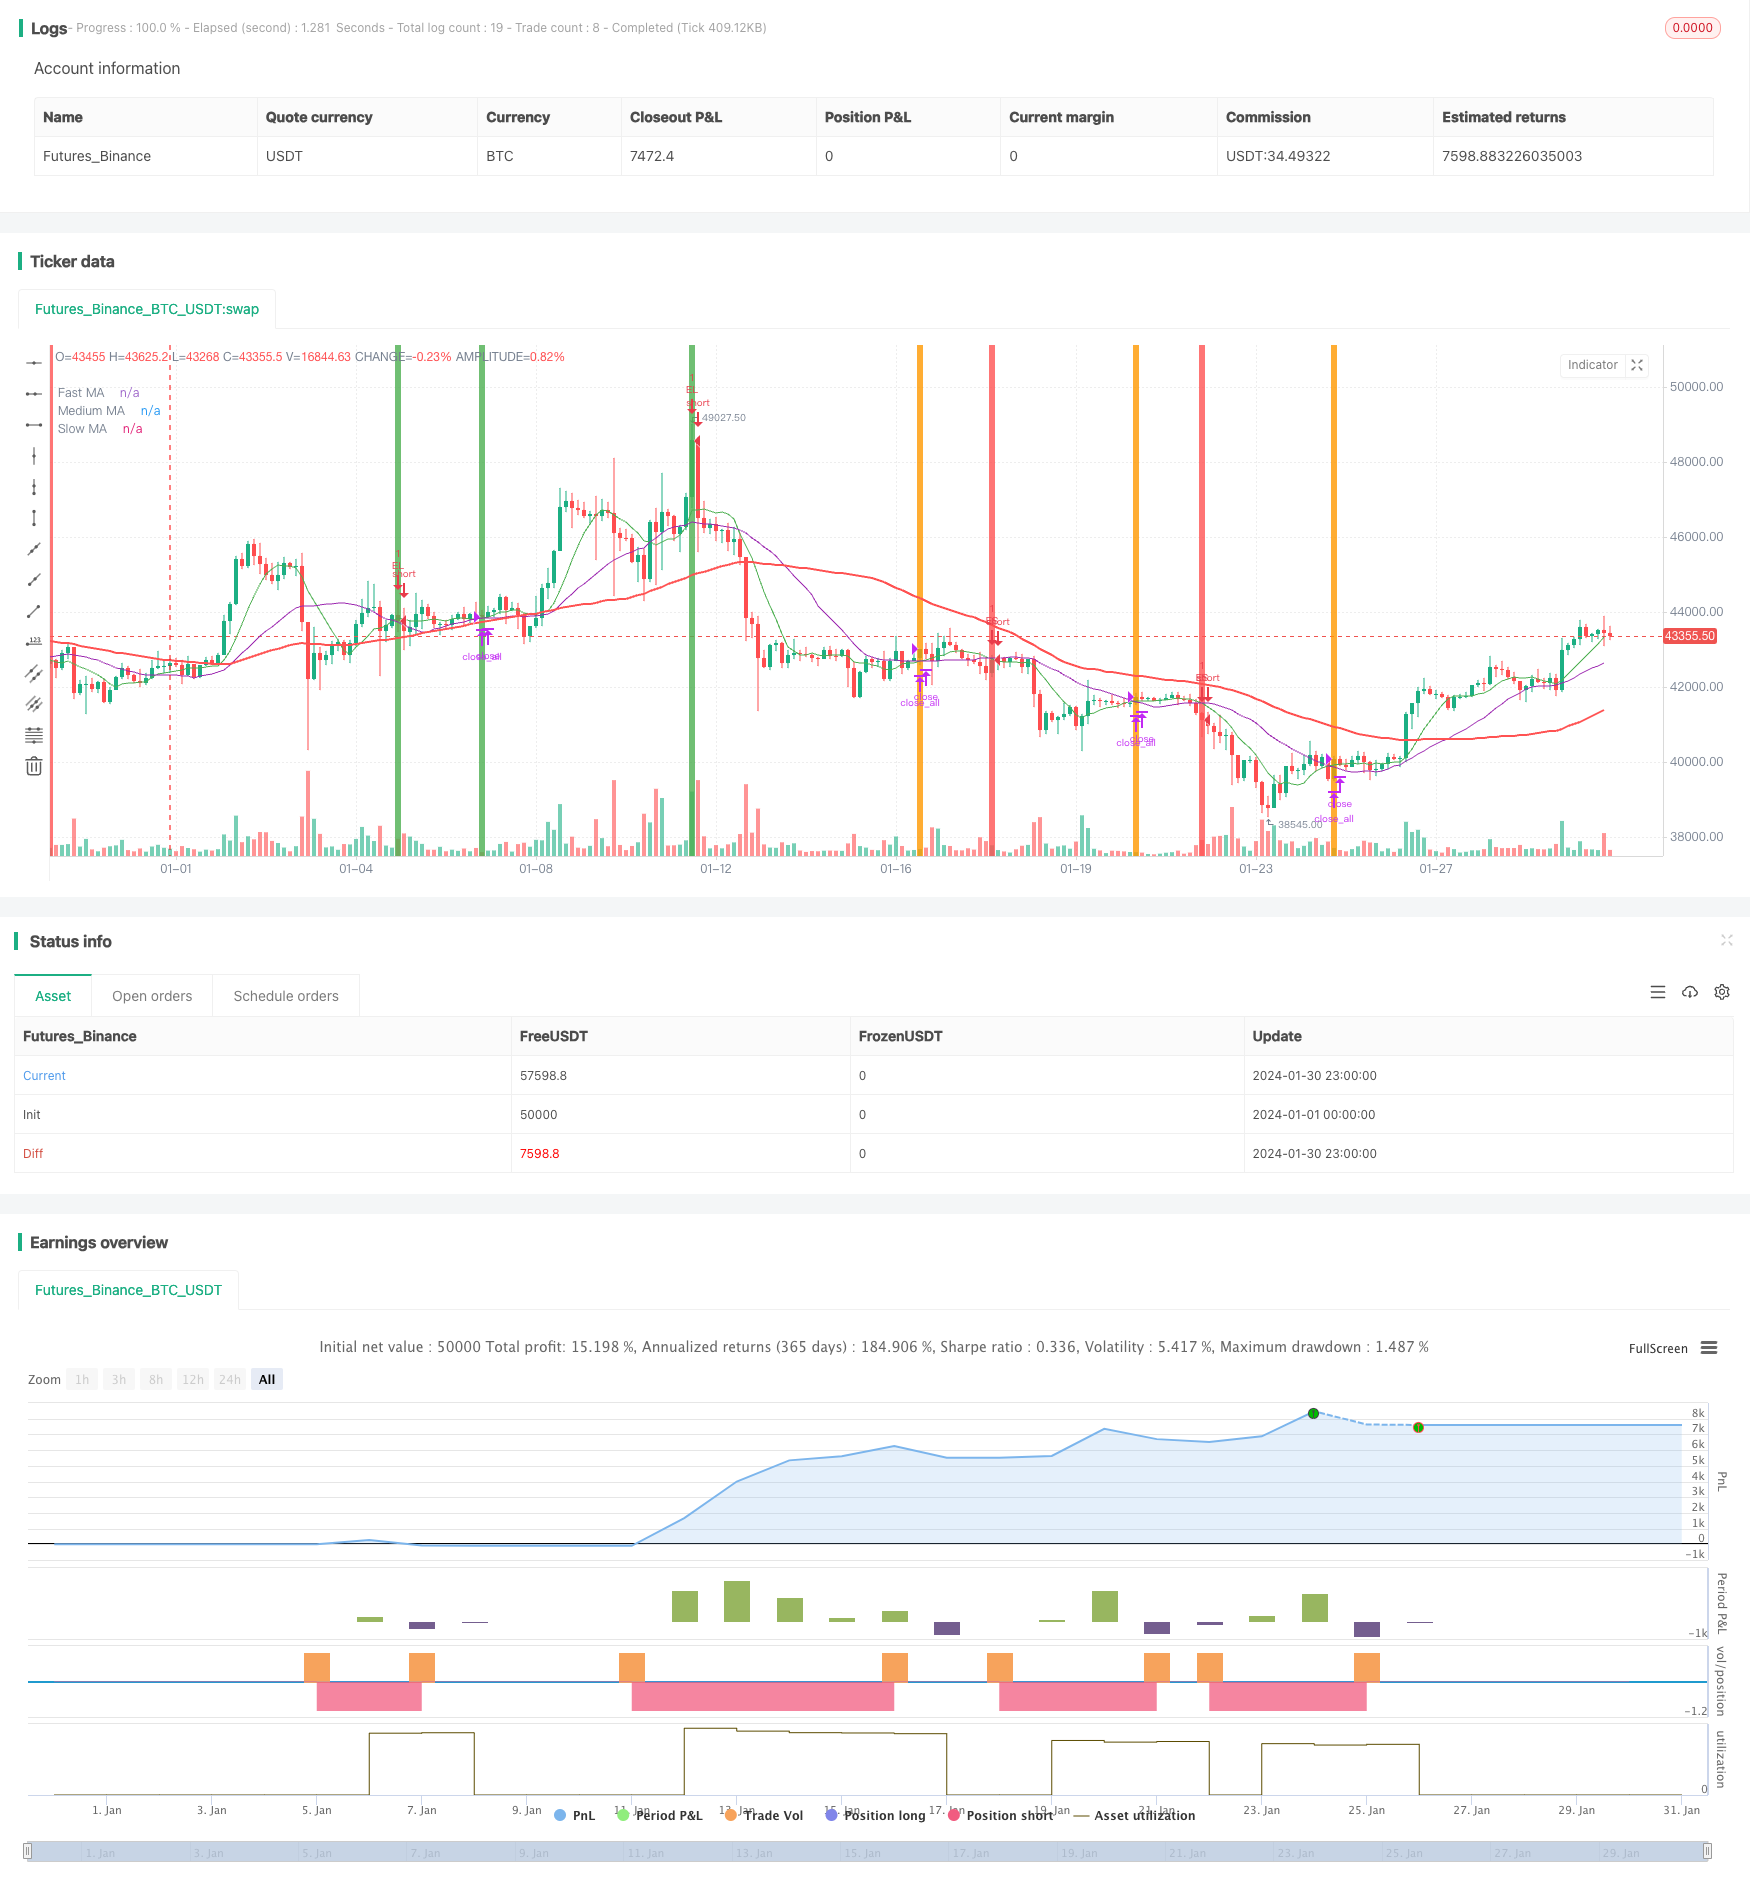
Triple Moving Average Trend Following Strategy
Author: ChaoZhang, Date: 2024-02-01 11:02:17Tags:

Overview
This strategy combines the concept of turtle trading with Niko Bakkers’ phase analysis, using three moving averages of different cycles to determine the trend direction for trend following. It goes long when the fast moving average crosses over the medium moving average and all three moving averages are in the same upward or downward trend; It goes short when the fast moving average crosses below the medium moving average and all three moving averages are in the same upward or downward trend.
Strategy Logic
Calculate three moving averages of different cycles: the fast moving average period is 8 days, the medium moving average period is 21 days, and the slow moving average period is 55 days.
Determine entry conditions: when the fast moving average crosses above the medium moving average, and all three moving averages are in an upward trend, go long; when the fast moving average crosses below the medium moving average, and all three moving averages are in a downward trend, go short.
Determine exit conditions: close positions when the fast moving average crosses the medium moving average in the opposite direction.
Position sizing: use fixed position sizing, open 1 contract each time. ATR can also be used to dynamically adjust position sizing.
Advantage Analysis
Using three moving averages helps determine the trend direction and avoid false breakouts.
Trend following for profit potential.
Using moving averages results in stable profits and relatively small drawdowns.
Controllable stop loss strategy reduces probability of huge losses.
Risk Analysis
Prone to multiple small losses, lowering profit efficiency.
Moving averages lag and may miss trend reversal points.
Fixed position sizing cannot effectively control risks, may cause margin call during significant market fluctuation.
Improper parameter optimization leads to over-trading, increasing trading costs and slippage.
Optimization
Optimize moving average periods to suit the characteristics of the trading instrument.
Use ATR to dynamically adjust position sizing.
Add stop loss strategy.
Incorporate trading volume indicators to determine reliability of trends.
Summary
This strategy integrates traditional technical indicators and the philosophy of turtle trading, using three moving averages to track trends. With proper parameter optimization, it can achieve good profitability. But it also has some risks. Stop loss, position sizing and other measures need to be utilized to control risks and obtain long-term steady profits from this quantitative trading strategy.
/*backtest
start: 2024-01-01 00:00:00
end: 2024-01-31 00:00:00
period: 3h
basePeriod: 15m
exchanges: [{"eid":"Futures_Binance","currency":"BTC_USDT"}]
*/

// LOVE JOY PEACE PATIENCE KINDNESS GOODNESS FAITHFULNESS GENTLENESS SELF-CONTROL
// This source code is subject to the terms of the Mozilla Public License 2.0 at https://mozilla.org/MPL/2.0/
// © JoshuaMcGowan

//@version=4

// 1. Define strategy settings
strategy(title="Triple Moving Average", overlay=true,
     pyramiding=0, initial_capital=1000,
     commission_type=strategy.commission.cash_per_order,
     commission_value=4, slippage=2)

fastMALen = input(title="Fast MA Length", type=input.integer, defval=8)
medMALen  = input(title="Medium MA Length", type=input.integer, defval=21)
slowMALen = input(title="Slow MA Length", type=input.integer, defval=55)

//endMonth = input(title="End Month Backtest", type=input.integer, defval=11)
//endYear  = input(title="End Year Backtest", type=input.integer, defval=2019)

// === INPUT BACKTEST RANGE ===
FromMonth = input(defval = 12, title = "From Month", minval = 1, maxval = 12)
FromDay   = input(defval = 1, title = "From Day", minval = 1, maxval = 31)
FromYear  = input(defval = 2016, title = "From Year", minval = 2017)
ToMonth   = input(defval = 1, title = "To Month", minval = 1, maxval = 12)
ToDay     = input(defval = 1, title = "To Day", minval = 1, maxval = 31)
ToYear    = input(defval = 9999, title = "To Year", minval = 2017)

// === FUNCTION EXAMPLE ===
start     = timestamp(FromYear, FromMonth, FromDay, 00, 00)  // backtest start window
finish    = timestamp(ToYear, ToMonth, ToDay, 23, 59)        // backtest finish window
window()  => true

usePosSize = input(title="Use Position Sizing?", type=input.bool, defval=true)
riskPerc   = input(title="Risk %", type=input.float, defval=0.5, step=0.25)

// 2. Calculate strategy values
fastMA = sma(close, fastMALen)
medMA  = sma(close, medMALen)
slowMA = sma(close, slowMALen)

//Position Sizing
riskEquity  = (riskPerc / 100) * strategy.equity
atrCurrency = (atr(20) * syminfo.pointvalue)
posSize     = usePosSize ? floor(riskEquity / atrCurrency) : 1

//Backtest Window
//tradeWindow = (time <= timestamp(endYear, endMonth, 1, 0, 0))

// 3. Determine long trading conditions
enterLong = crossover(fastMA, medMA) and
     (fastMA > slowMA) and (medMA > slowMA) and
     window()

exitLong = crossunder(fastMA, medMA)

// 4. Code short trading conditions
enterShort = crossunder(fastMA, medMA) and
     (fastMA < slowMA) and (medMA < slowMA) and
     window()

exitShort = crossover(fastMA, medMA)

// 5. Output strategy data
plot(series=fastMA, color=color.green, title="Fast MA")
plot(series=medMA, color=color.purple, title="Medium MA")
plot(series=slowMA, color=color.red, title="Slow MA",
     linewidth=2)

bgColour =
     enterLong and (strategy.position_size < 1) ? color.green :
     enterShort and (strategy.position_size > -1) ? color.red :
     exitLong and (strategy.position_size > 0) ? color.lime :
     exitShort and (strategy.position_size < 0) ? color.orange :
     na

bgcolor(color=bgColour, transp=85)

// 6. Submit entry orders
if (enterLong)
    strategy.entry(id="EL", long=true, qty=1)

if (enterShort)
    strategy.entry(id="ES", long=false, qty=1)

// 7. Submit exit orders
strategy.close_all(when=exitLong and
     (strategy.position_size > 0))
strategy.close_all(when=exitShort and
     (strategy.position_size < 0))

strategy.close_all(when=not window())

//END
- Cryptocurrency Trading Strategy Based on MACD and Stochastic Indicators
- Swing Dual Moving Average and RSI Crossover Strategy
- Golden Bollinger Band Gap Reversion System
- Quantitative Trend Tracking Strategy
- Moving Average and Stochastic RSI Strategy
- Ichimoku Cloud Trend Following Strategy
- Long-Term Trading Strategy Based on Bollinger Bands %B Indicator
- The Triple Moving Average Channel Strategy for Patiently Mining Valuable Information from Candlestick Lines
- Yin Yang Hanging Man Strategy
- Trailing Stop Loss Percent Strategy
- Tracking Stop Loss Moving Average Trading Strategy
- Dual Indicator Mean Reversion Trend Following Strategy
- Dynamic Price Channel with Stop Loss Tracking Strategy
- Dynamic Stop Loss Bollinger Bands Strategy
- Reversal Breakout Bandpass Combo Strategy
- Dynamic Moving Average Crossover Strategy
- EMA Crossover Trend Following Strategy
- Short-Term Trading Strategy Based on RSI and SMA
- Momentum Breakout Intraday Trading Strategy
- KDJ Golden Cross Long Entry Strategy