本策略综合运用双移动平均线和RSI指标构建多空交叉交易策略。该策略可以捕捉中长线趋势,同时利用短线指标避免不必要的震荡。
策略原理
本策略使用两组移动平均线,分别是快速移动平均线(EMA 59和EMA 82)和慢速移动平均线(EMA 96和EMA 95)。当价格从下向上跨过快速移动平均线时,做多;当价格从上向下跨过快速移动平均线时,做空。同时,RSI指标的过买过卖区域用于确认交易信号和止损。
具体来说,当快速EMA向上突破慢速EMA时生成多头信号。此时如果RSI低于30(超卖区域),则进行多头入场。当快速EMA向下跌破慢速EMA时,产生空头信号。如果这时RSI高于70(超买区域),则进行空头入场。
使用双移动平均线的优势是可以更好地识别中长线趋势的变化。RSI指标则可以过滤掉部分假突破带来的噪音交易。
策略优势
- 利用双移动平均线捕捉中长线趋势
- RSI指标过滤噪音交易
- 结合趋势跟随和反转交易
- 交易逻辑简单清晰
风险分析
- 大幅度震荡市场中,移动平均线生成的交易信号可能受到欺骗
- RSI指标在某些市场情况下也会失效
- 止损点设置需要谨慎,避免过于宽松或紧迫
策略优化方向
- 测试更长周期的移动平均线组合
- 尝试不同的参数调整,如RSI看涨看跌区间的变化
- 增加附加过滤条件,如交易量指标等
- 优化止损策略,结合ATR等指标动态止损
总结
本策略整合双移动平均线的趋势跟随与RSI指标的反转交易。双EMA追踪中长线趋势方向,RSI用于确认交易信号有效性和止损。这是一个简单实用的多空交叉策略,通过参数调整和优化可适应不同市场环境。
策略源码
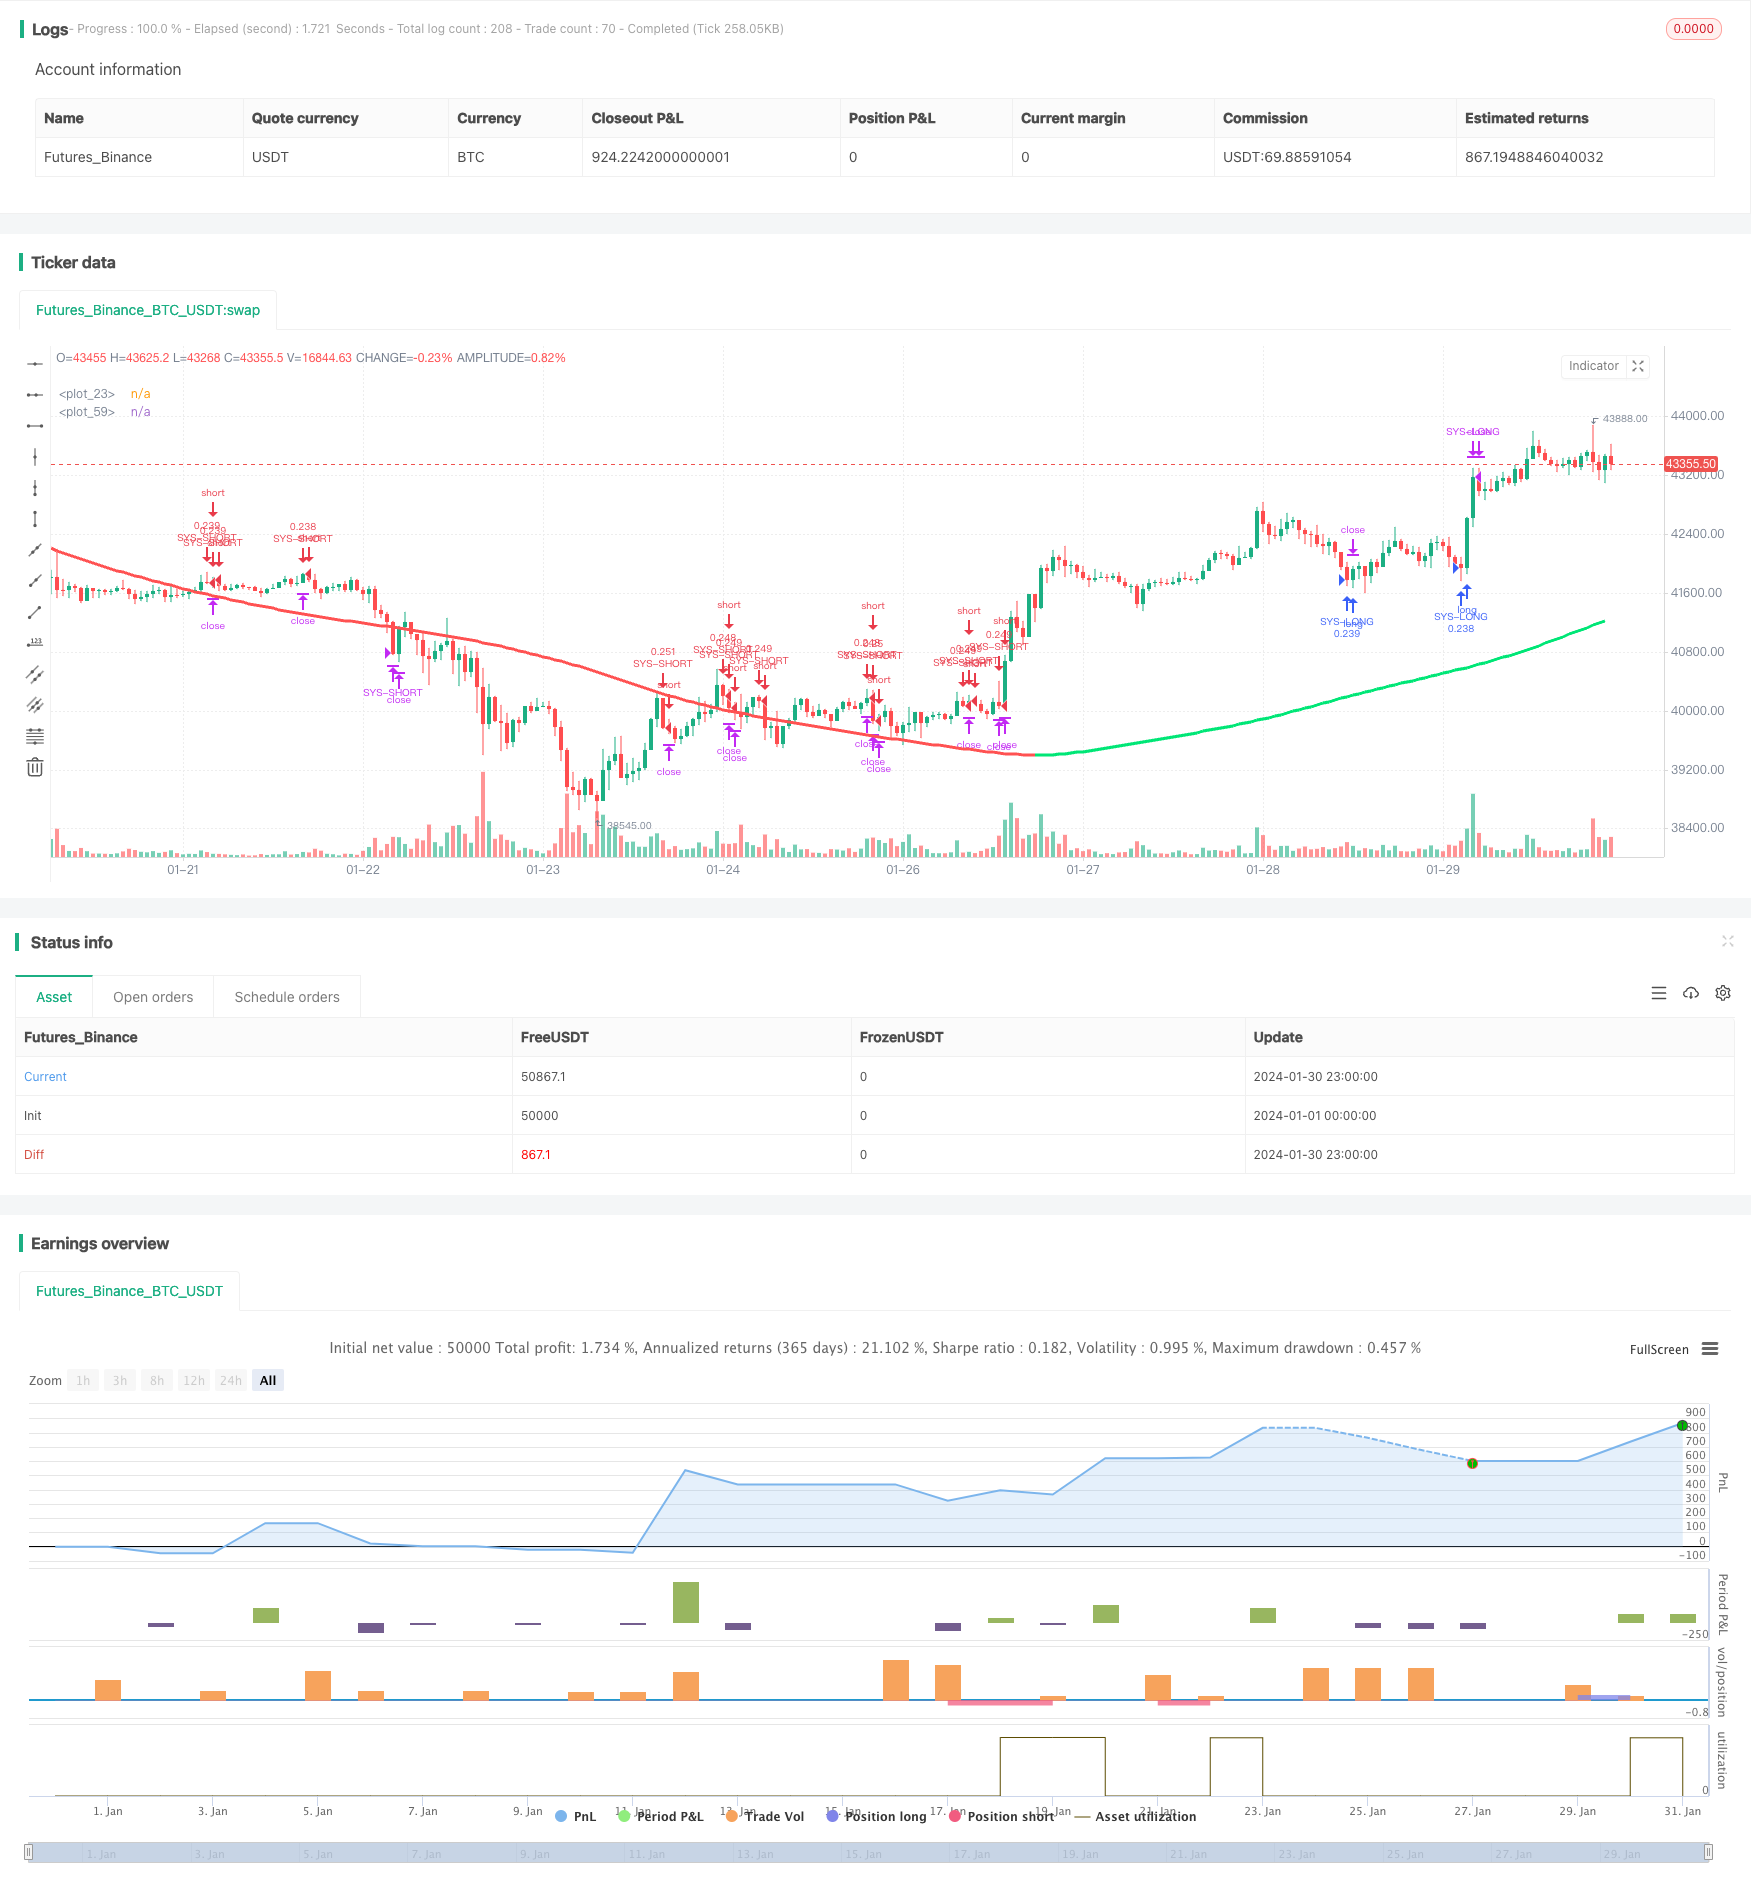
/*backtest
start: 2024-01-01 00:00:00
end: 2024-01-31 00:00:00
period: 1h
basePeriod: 15m
exchanges: [{"eid":"Futures_Binance","currency":"BTC_USDT"}]
*/

//@version=2
strategy("Swing Hull/rsi/EMA Strategy", overlay=true,default_qty_type=strategy.cash,default_qty_value=10000,scale=true,initial_capital=10000,currency=currency.USD)

//A Swing trading strategy that use a combination of indicators, rsi for target, hull for overall direction enad ema for entering the martket.
// hull ma copied from syrowof HullMA who copied from mohamed982 :) thanks both
// Performance

n=input(title="period",defval=500)

n2ma=2*wma(close,round(n/2))
nma=wma(close,n)
diff=n2ma-nma
sqn=round(sqrt(n))

n2ma1=2*wma(close[1],round(n/2))
nma1=wma(close[1],n)
diff1=n2ma1-nma1
sqn1=round(sqrt(n))

n1=wma(diff,sqn)
n2=wma(diff1,sqn)
c=n1>n2?green:red
ma=plot(n1,color=c)


// RSi and Moving averages

length = input( 14 )
overSold = input( 70)
overBought = input( 30)
point = 0.0001
dev= 2

fastLength = input(59)
fastLengthL = input(82)
slowLength = input(96)
slowLengthL = input(95)
price = close

mafast = ema(price, fastLength)
mafastL= ema(price, fastLengthL)
maslow = ema(price, slowLength)
maslowL = ema(price, slowLengthL)
vrsi = rsi(price, length)
cShort =  (crossunder(vrsi, overBought))

condDown = n2 >= n1
condUp = condDown != true
closeLong =  (crossover(vrsi, overSold))
closeShort = cShort


// Strategy Logic
longCondition = n1> n2
shortCondition = longCondition != true

col =condUp ? lime : condDown ? red : yellow
plot(n1,color=col,linewidth=3)


if (not na(vrsi))
    if shortCondition
        if (price[0] < maslow[0] and price[1] > mafast[1]) //cross entry
            strategy.entry("SYS-SHORT", strategy.short, comment="short")
strategy.close("SYS-SHORT", when=closeShort) //output logic

if (not na(vrsi))
    if longCondition // swing condition
        if (price[0] < mafast[0] and price[1] > mafast[1]) //cross entry
            strategy.entry("SYS-LONG", strategy.long, comment="long")
strategy.close("SYS-LONG", when=closeLong) //output logic


// Stop Loss


sl = input(75)
Stop = sl * 10
Q = 100


strategy.exit("Out Long", "SYS-LONG", qty_percent=Q, loss=Stop)
strategy.exit("Out Short", "SYS-SHORT", qty_percent=Q, loss=Stop)


//plot(strategy.equity, title="equity", color=red, linewidth=2, style=areabr)