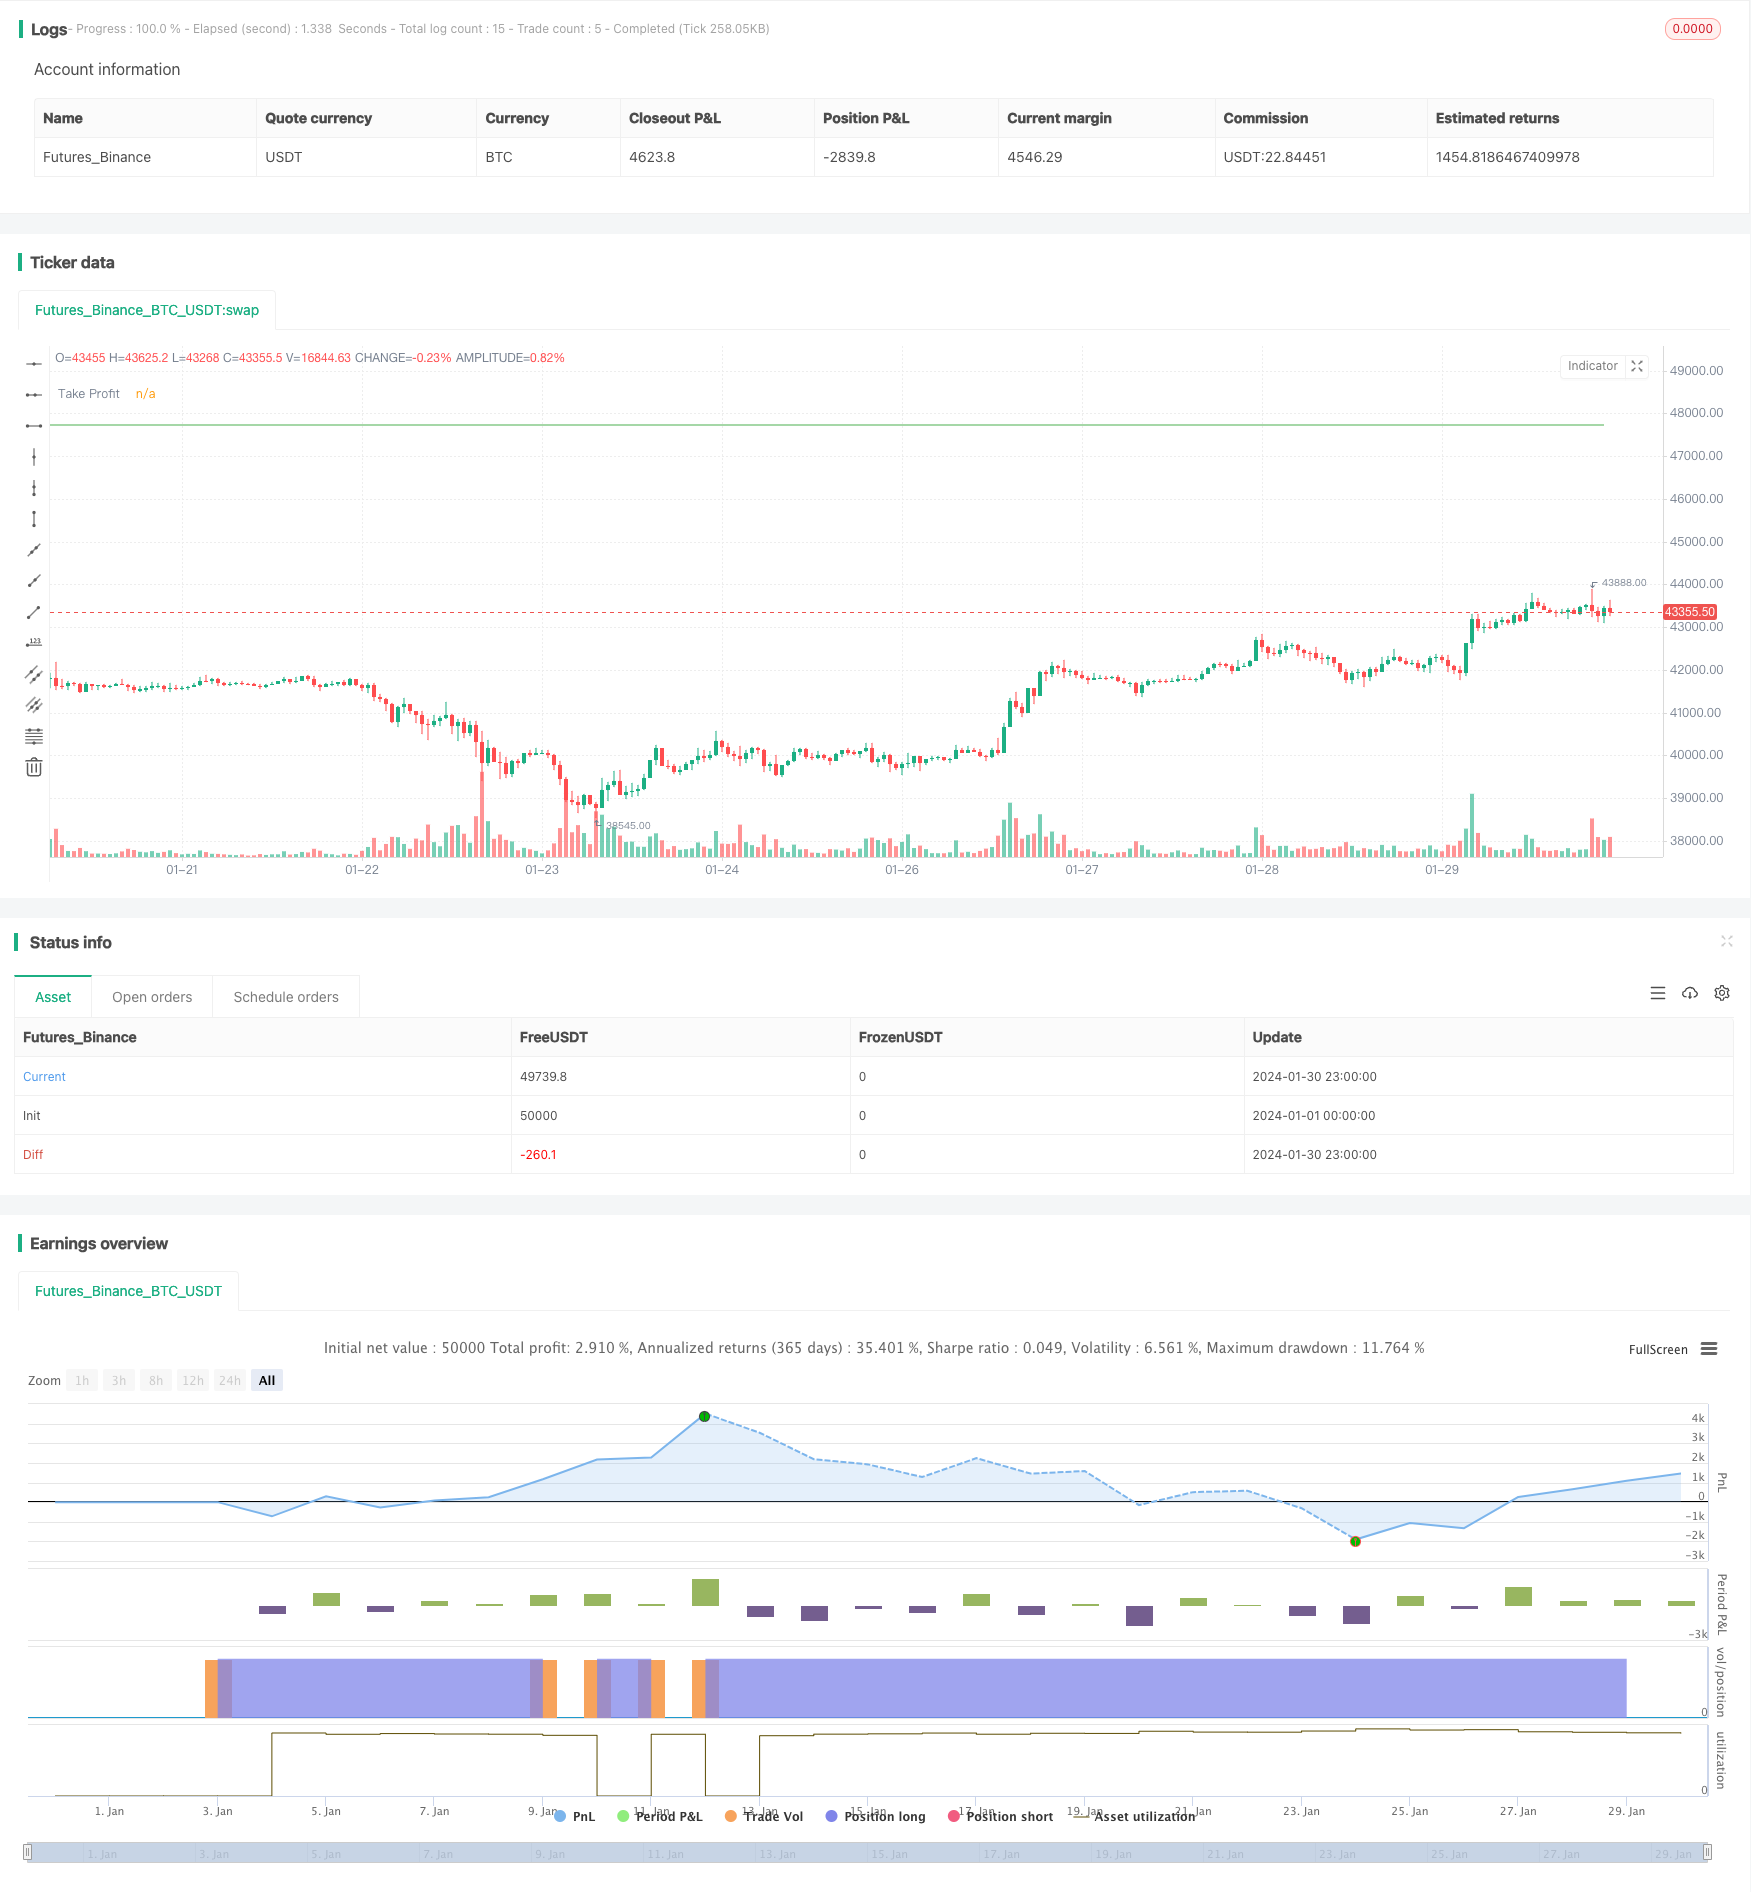
Long-Term Trading Strategy Based on Bollinger Bands %B Indicator
Author: ChaoZhang, Date: 2024-02-01 11:15:44Tags:

Overview
This strategy generates trading signals based on the Bollinger Bands %B indicator. It goes long when the %B value falls below a preset threshold and adopts a dynamic position averaging approach to follow the trend until take profit or stop loss is triggered. The strategy is suitable for identifying pullback opportunities after the support of the Bollinger lower band is broken.
Strategy Logic
- Calculate the middle band, upper band and lower band of N-day Bollinger Bands
- Calculate %B value: (%B = (Close - LowerBB)/(UpperBB - LowerBB) )
- Go long when %B value falls below the threshold (default is 0)
- Set take profit based on entry price (default is 105% of entry price) and stop loss (default is 95% of entry price)
- Add to the position as long as conditions are met after opening position
- The first triggered take profit or stop loss closes the position
Advantage Analysis
The advantages of this strategy are:
- %B indicator efficiently identifies pullback points after lower band support
- Dynamic position averaging tracks the trend for greater profit
- Clear take profit and stop loss conditions facilitate risk control
Risk Analysis
There are also some risks associated with this strategy:
- Higher probability of false signals from %B
- More frequent stop loss triggers during ranging markets
- Aggressive averaging risks uncontrolled loss
Solutions:
- Combine with indicators like KD and MACD to confirm signal reliability
- Adjust stop loss placement to withstand market volatility
- Control averaging pace to avoid risk explosion
Enhancement Opportunities
The strategy can be further optimized in the following areas:
- Test different parameter combinations for best results
- Optimize averaging logic, e.g. stop adding after certain profit target achieved
- Add liquidity filter to prevent errant trading in low liquidity stocks
Summary
Overall this is a relatively robust long-term trading strategy. There is room for improvement in both signal accuracy and parameter tuning. When combined with additional signal filtering and prudent position sizing, this strategy can achieve decent results in trending markets.
/*backtest
start: 2024-01-01 00:00:00
end: 2024-01-31 00:00:00
period: 1h
basePeriod: 15m
exchanges: [{"eid":"Futures_Binance","currency":"BTC_USDT"}]
*/

//@version=5
strategy("Bollinger Bands %B Long Strategy", shorttitle="BB %B Long Strategy", overlay=true)

// Girdiler
length = input.int(20, title="BB Length")
src = input(close, title="Source")
dev = input.float(2.0, title="Deviation")
kar_hedefi = input(5, title="Take Profit")
zarar_durumu = input(100, title="Stop Loss")
start_date = input(timestamp("01 Jan 2023 00:00 +0000"), "Start Date")
end_date = input(timestamp("01 Jan 2024 00:00 +0000"), "End Date")
altinda_kalirsa_long = input.float(0, title="hangi degerin altinda long alsin")

// Bollinger Bantları %B göstergesi
basis = ta.sma(src, length)
stdDev = ta.stdev(src, length)
upperBand = basis + dev * stdDev
lowerBand = basis - dev * stdDev
percentB = (src - lowerBand) / (upperBand - lowerBand)

// Alım-Satım Sinyalleri
longCondition = percentB < altinda_kalirsa_long

// Kar/Zarar Hesaplama
takeProfit = strategy.position_avg_price * (1 + kar_hedefi / 100)
stopLoss = strategy.position_avg_price * (1 - zarar_durumu / 100)

// Long (Alım) İşlemi
if (longCondition )
    strategy.entry("Long", strategy.long)
    strategy.exit("Take Profit/Stop Loss", "Long", limit=takeProfit, stop=stopLoss)

// Take Profit Seviyesi Çizgisi
plot(takeProfit, title="Take Profit", color=color.green, linewidth=1, style=plot.style_linebr)
- Multi-cycle Adaptive Trend Forecast Strategy
- Renko ATR Trend Reversal Strategy
- Ichimoku Clouds Quant Strategy
- Dual-directional Trend Tracking Strategy Based on Range Breakout
- Cryptocurrency Trading Strategy Based on MACD and Stochastic Indicators
- Swing Dual Moving Average and RSI Crossover Strategy
- Golden Bollinger Band Gap Reversion System
- Quantitative Trend Tracking Strategy
- Moving Average and Stochastic RSI Strategy
- Ichimoku Cloud Trend Following Strategy
- The Triple Moving Average Channel Strategy for Patiently Mining Valuable Information from Candlestick Lines
- Yin Yang Hanging Man Strategy
- Trailing Stop Loss Percent Strategy
- Triple Moving Average Trend Following Strategy
- Tracking Stop Loss Moving Average Trading Strategy
- Dual Indicator Mean Reversion Trend Following Strategy
- Dynamic Price Channel with Stop Loss Tracking Strategy
- Dynamic Stop Loss Bollinger Bands Strategy
- Reversal Breakout Bandpass Combo Strategy
- Dynamic Moving Average Crossover Strategy