Ergotic Momentum Direction Convergence Trading Strategy
Author: ChaoZhang, Date: 2024-02-02 10:51:11Tags:

Overview
The name of this strategy is Ergotic Momentum Direction Convergence Trading Strategy. It is a quantitative trading strategy designed based on the technical indicator described in William Blau’s book “Momentum, Direction and Divergence”. This strategy focuses on three key aspects - momentum, direction and divergence, by calculating price momentum indicators of stocks, determining market trend direction, and finding divergences between price and indicators to spot trading opportunities.
Strategy Logic
The core indicator of this strategy is Ergotic TSI, and its calculation formula is as follows:
Val1 = 100 * EMA(EMA(EMA(price change, r), s), u)

Val2 = EMA(EMA(EMA(absolute value of price change, r), s), u))

Ergotic TSI = If Val2 != 0, Val1/Val2, else 0
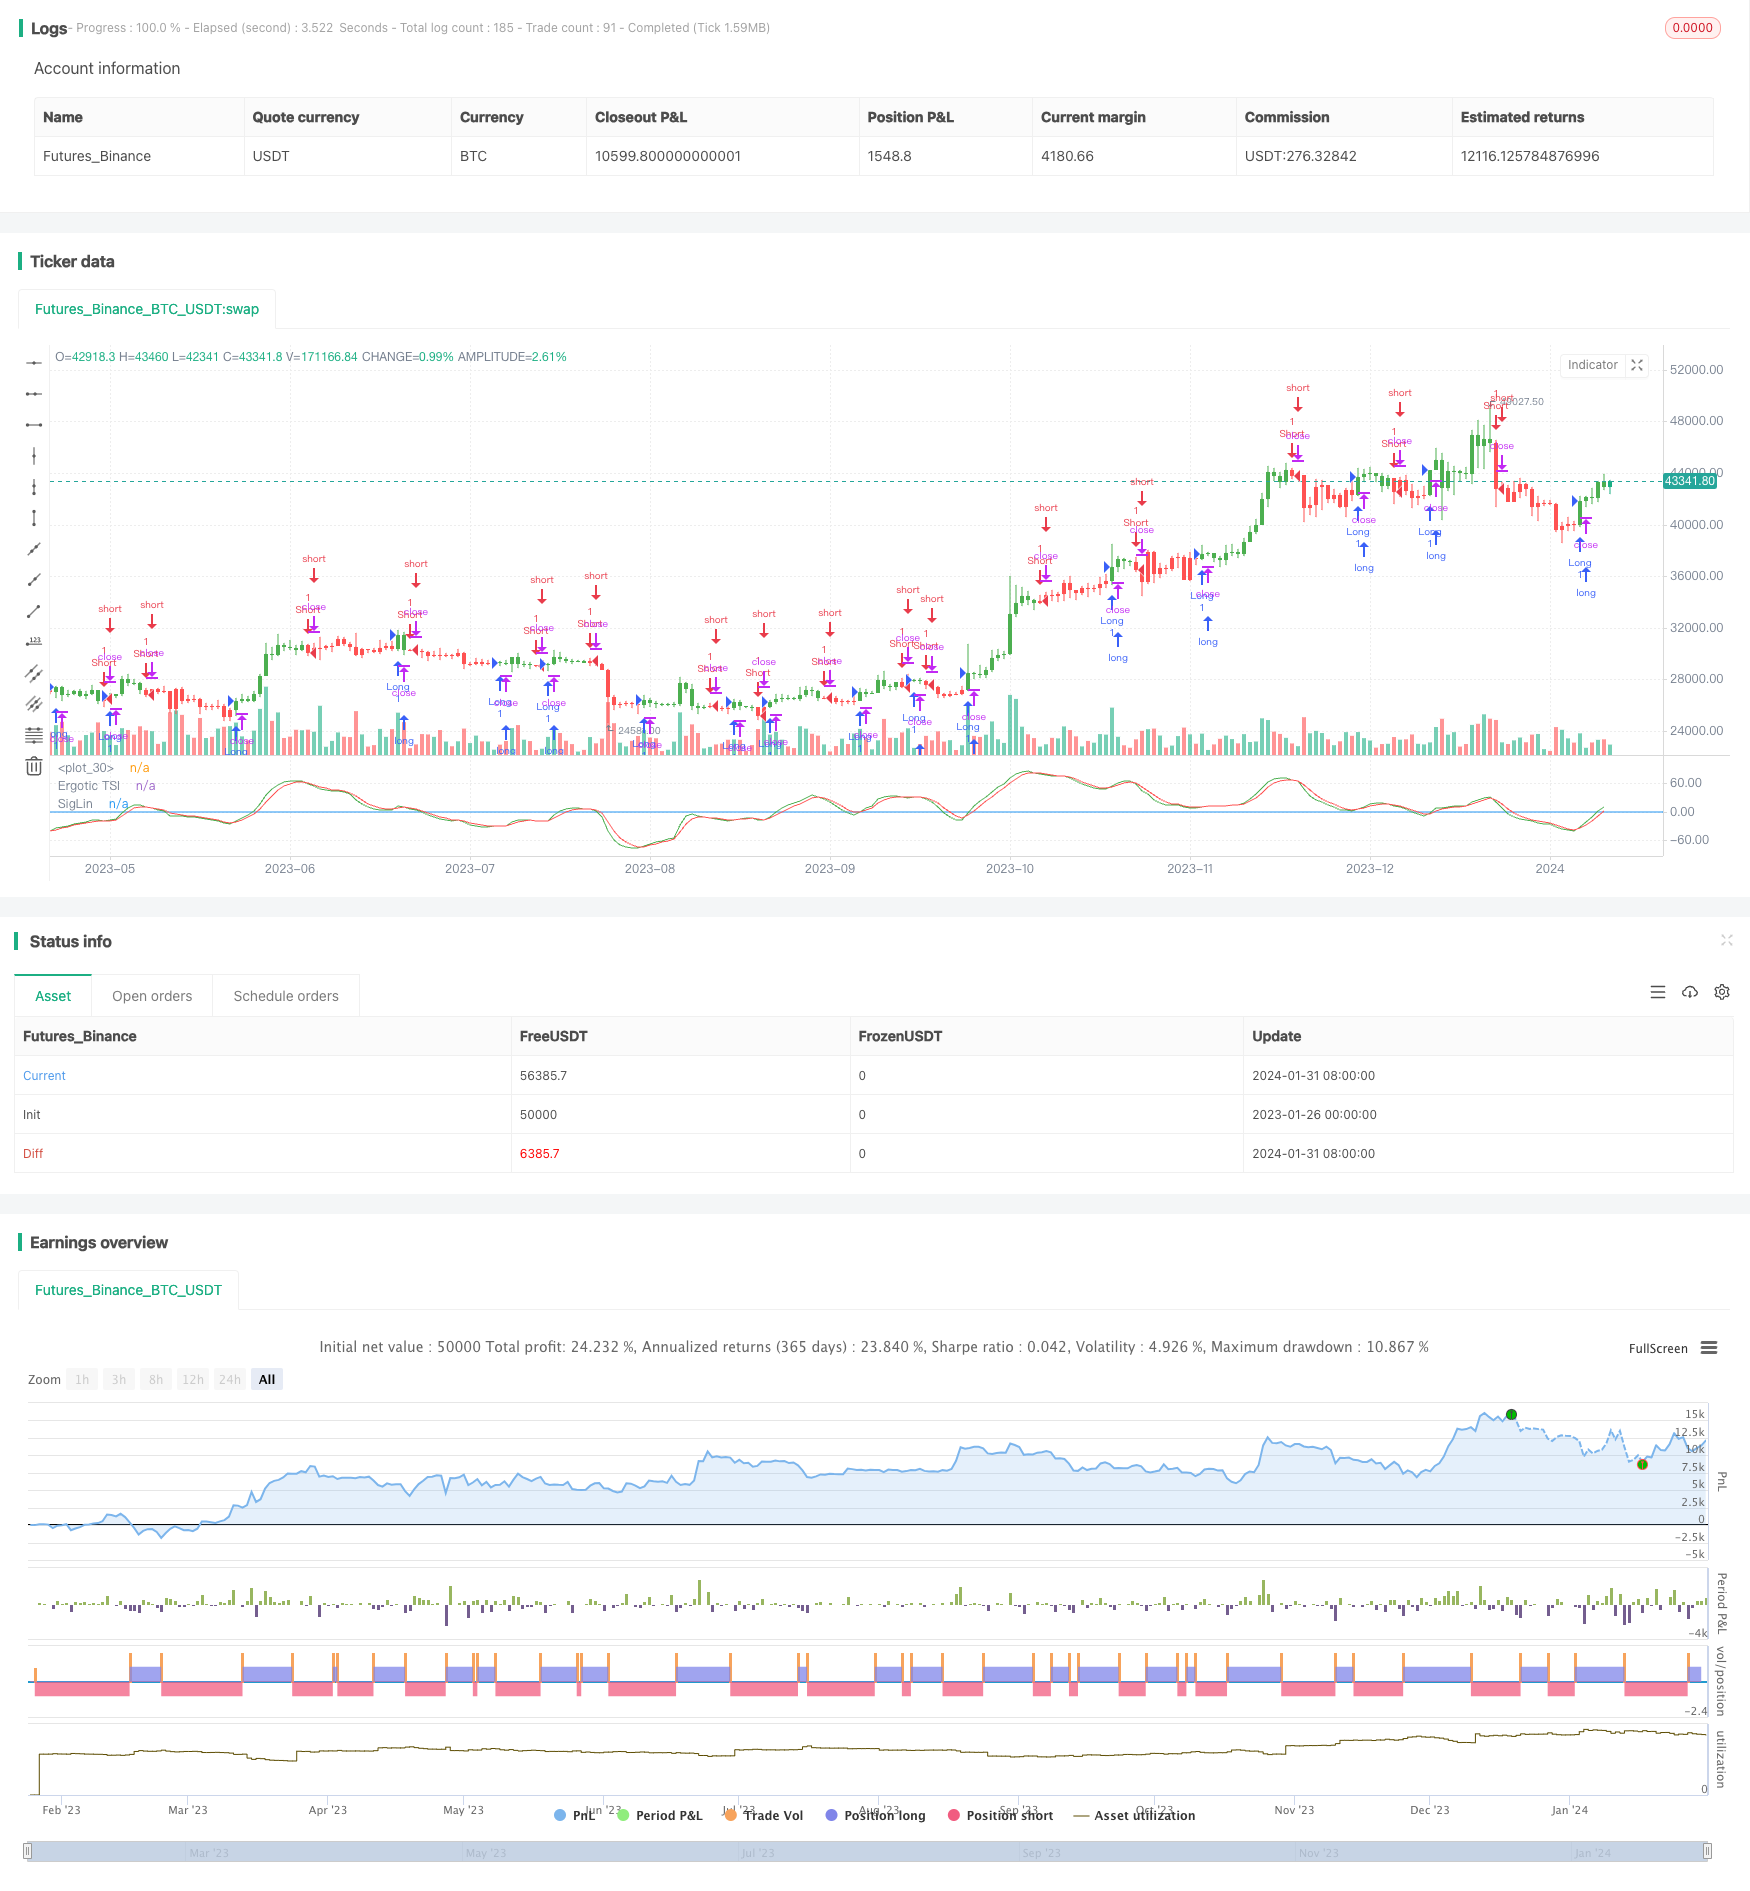
where r, s, u are smoothing parameters. This indicator reflects the ratio of price change to the absolute value of price change, which belongs to the momentum oscillator indicator. Then we calculate the EMA moving average of Ergotic TSI as the signal line. Go long when TSI crosses over the signal line, and go short when it crosses below.
Advantage Analysis
The main advantages of this strategy are:
1. Strong ability to capture price change trends
2. Good filtering of price fluctuations
3. Relatively good divergence characteristics
4. Flexible parameter settings to adjust smoothing
Risk Analysis
There are also some risks in this strategy:
1. Wrong signals may occur at trend reversal points
2. Inappropriate parameter settings may miss trading opportunities or increase false signals
3. Parameters need proper adjustment to suit different products and trading environments
Risks can be controlled by optimizing parameters, combining other indicators for confirmation, and setting stop loss.
Optimization Directions
This strategy can be optimized in the following aspects:
1. Test different price inputs, such as open, close, mid price, etc.
2. Adjust r, s, u parameter values to find optimal parameter combinations
3. Add other indicators or filters to further confirm signals
4. Set stop loss points and exit mechanisms
Conclusion
This strategy integrates considerations of momentum change, trend judgment and divergence features. It can effectively capture trend opportunities. With parameter optimization, signal filtering and risk control methods, good strategy performance can be achieved. Overall, the strategy is designed reasonably and worth further research and practice.
/*backtest
start: 2023-01-26 00:00:00
end: 2024-02-01 00:00:00
period: 1d
basePeriod: 1h
exchanges: [{"eid":"Futures_Binance","currency":"BTC_USDT"}]
*/

//@version = 2
////////////////////////////////////////////////////////////
//  Copyright by HPotter v1.0 13/12/2016
// r - Length of first EMA smoothing of 1 day momentum        4
// s - Length of second EMA smoothing of 1 day smoothing      8
// u- Length of third EMA smoothing of 1 day momentum         6
// Length of EMA signal line                                  3
// Source of Ergotic TSI                                      Close
//
// This is one of the techniques described by William Blau in his book "Momentum,
// Direction and Divergence" (1995). If you like to learn more, we advise you to
// read this book. His book focuses on three key aspects of trading: momentum,
// direction and divergence. Blau, who was an electrical engineer before becoming
// a trader, thoroughly examines the relationship between price and momentum in
// step-by-step examples. From this grounding, he then looks at the deficiencies
// in other oscillators and introduces some innovative techniques, including a
// fresh twist on Stochastics. On directional issues, he analyzes the intricacies
// of ADX and offers a unique approach to help define trending and non-trending periods.
//
// You can use in the xPrice any series: Open, High, Low, Close, HL2, HLC3, OHLC4 and ect...
// You can change long to short in the Input Settings
// Please, use it only for learning or paper trading. Do not for real trading.
////////////////////////////////////////////////////////////
strategy(title="Ergotic TSI Strategy Backtest")
r = input(4, minval=1)
s = input(8, minval=1)
u = input(6, minval=1)
SmthLen = input(3, minval=1)
reverse = input(false, title="Trade reverse")
hline(0, color=blue, linestyle=line)
xPrice = close
xPrice1 = xPrice - xPrice[1]
xPrice2 = abs(xPrice - xPrice[1])
xSMA_R = ema(ema(ema(xPrice1,r), s),u)
xSMA_aR = ema(ema(ema(xPrice2, r), s),u)
Val1 = 100 * xSMA_R
Val2 = xSMA_aR
xTSI = iff (Val2 != 0, Val1 / Val2, 0)
xEMA_TSI = ema(xTSI, SmthLen)
pos = iff(xTSI > xEMA_TSI, 1,
	   iff(xTSI < xEMA_TSI, -1, nz(pos[1], 0)))
possig = iff(reverse and pos == 1, -1,
          iff(reverse and pos == -1, 1, pos))
if (possig == 1)
    strategy.entry("Long", strategy.long)
if (possig == -1)
    strategy.entry("Short", strategy.short)
barcolor(possig == -1 ? red: possig == 1 ? green : blue )
plot(xTSI, color=green, title="Ergotic TSI")
plot(xEMA_TSI, color=red, title="SigLin")
- Dynamic SMMA and SMA Crossover Strategy
- Trend Following Strategy Based on Bollinger Bands, RSI and Moving Average
- Trend Trading Strategy Based on MACD Indicator
- Stochastic & Moving Average Strategy with Double Filters
- Stoch RSI Based Trend Following Strategy
- Single Point Moving Average Breakout Strategy
- Moving Average Crossover Strategy
- SuperTrend Strategy
- Parabolic Period and Bollinger Band Combined Moving Stop Loss Strategy
- Moving Average Price Based Trading Strategy
- Moving Average and Stochastic Trading Strategy
- An Optimization of Dual Moving Average Trend Following Strategy Based on Indicators Combination
- The Efficient Quant Trading Strategy Combining
- Dual Moving Average Crossover and Williams Indicator Combo Strategy
- Momentum Breakthrough Silver Line Strategy
- RWI Volatility Contrarian Strategy
- Parabolic SAR Trend Tracking Stop Loss Reversal Strategy
- Momentum Indicator Crossover Strategy
- Efficient Oscillation Breakthrough Dual Stop Profit and Stop Loss Strategy
- Dual Channel Breakout Strategy