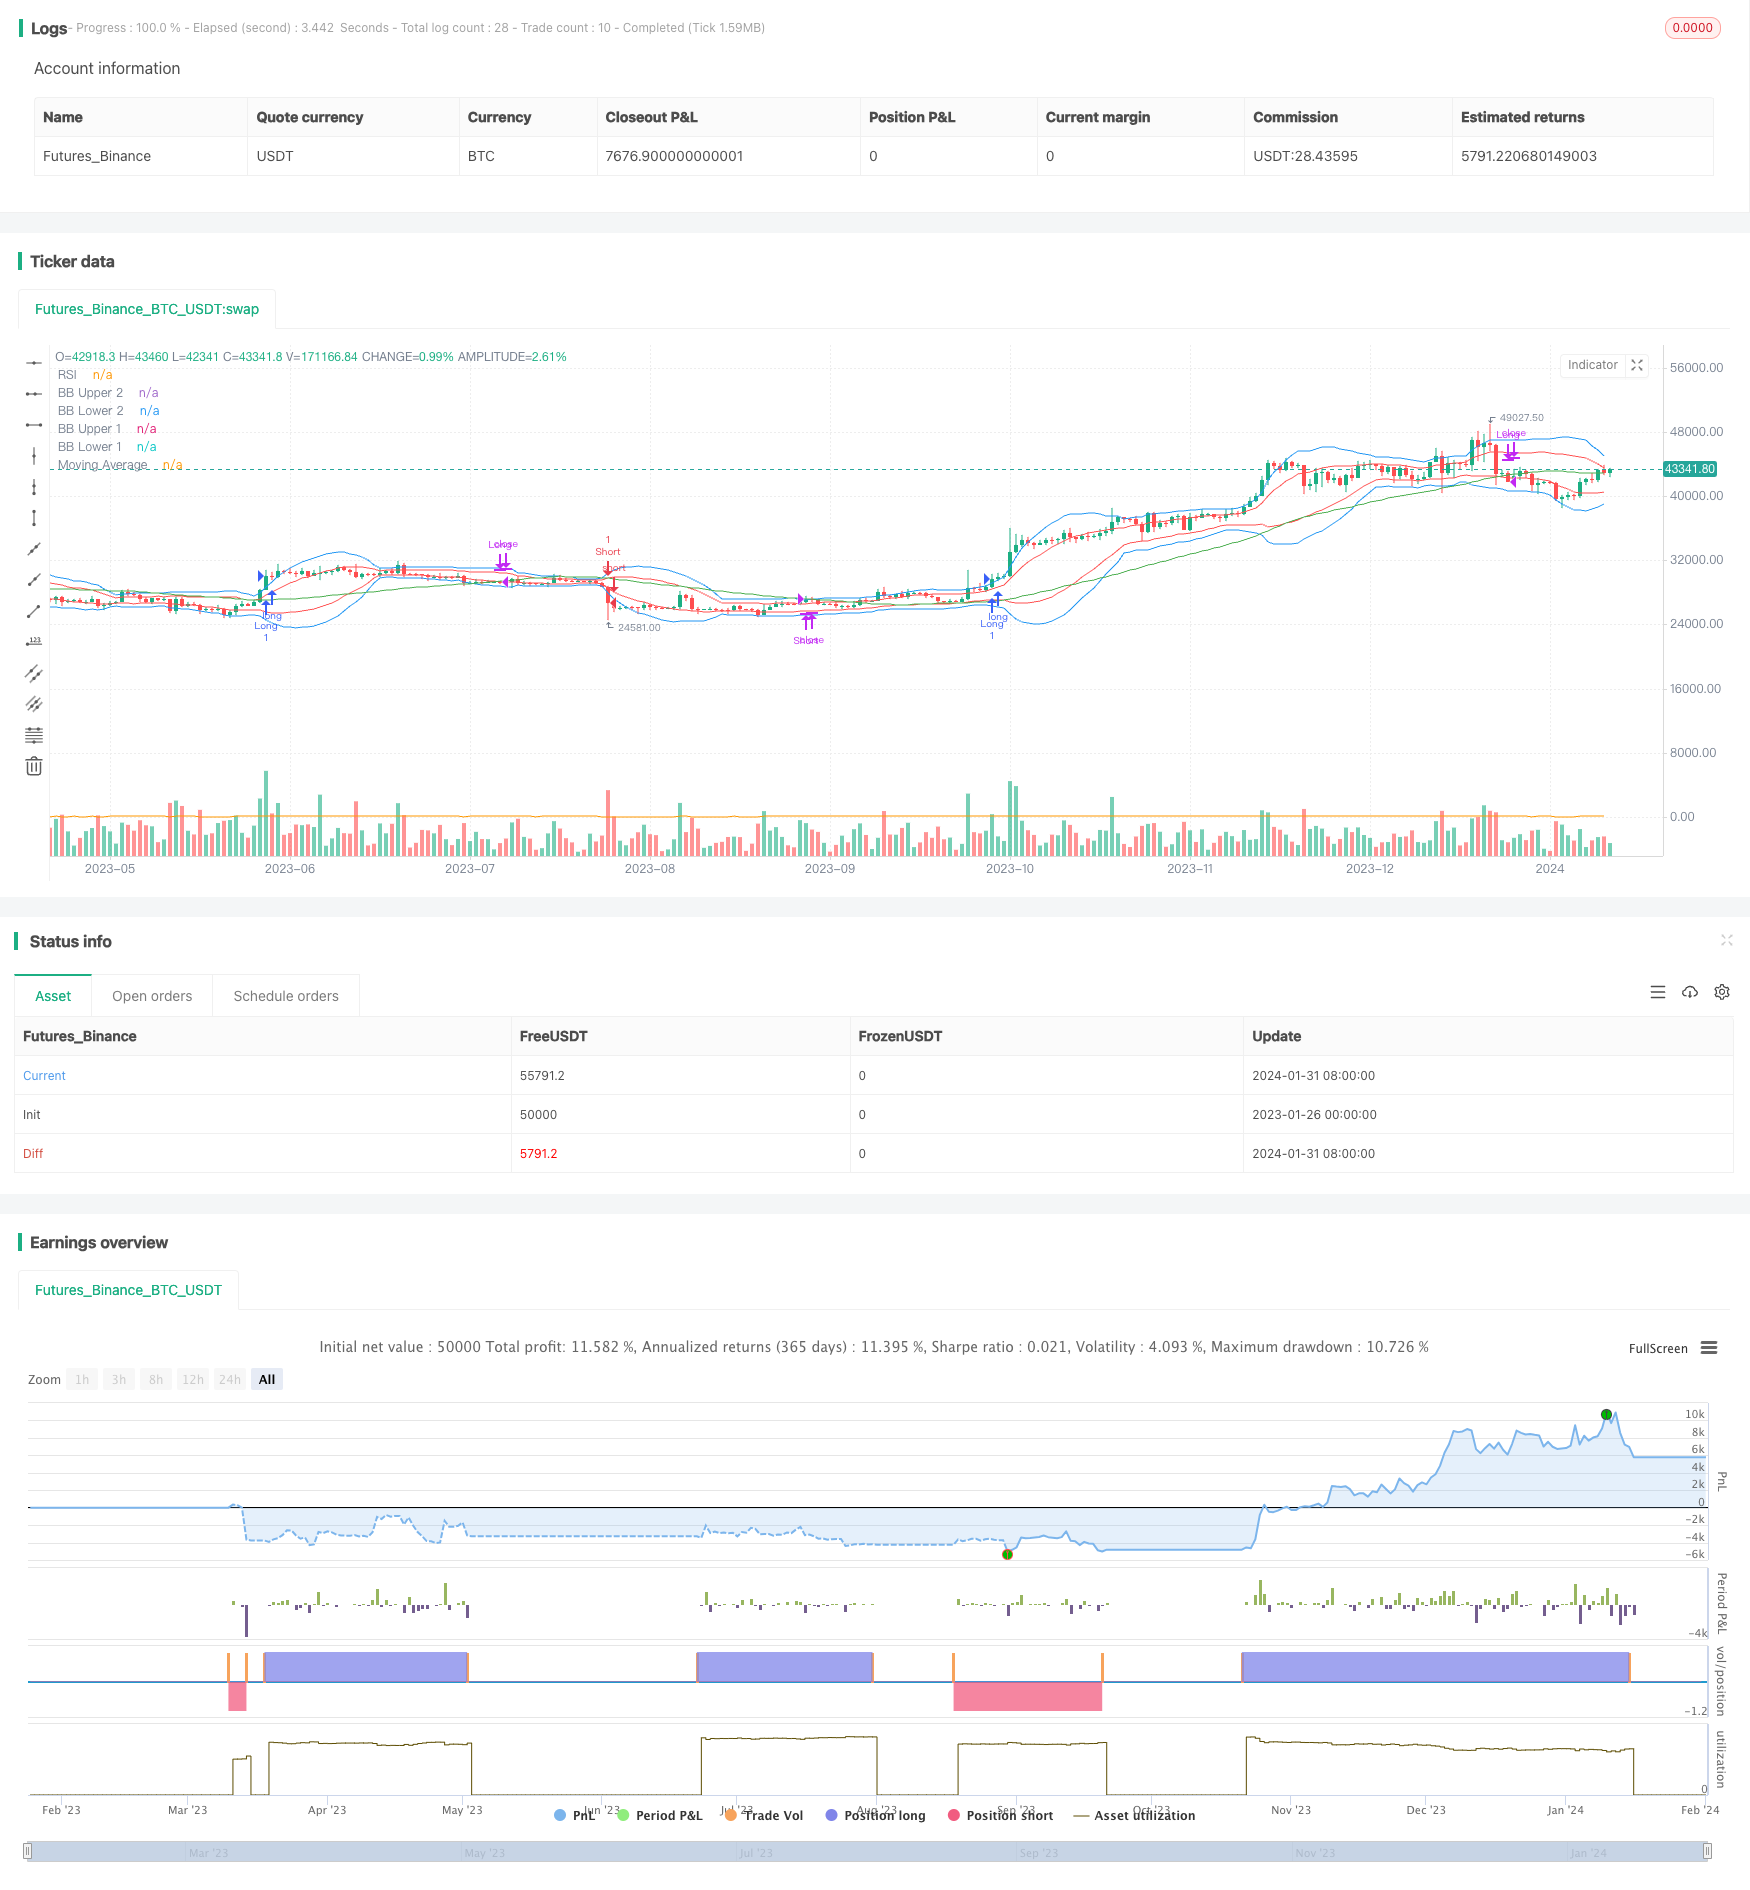
概述
该策略集成了布林带指标、相对强弱指标(RSI)和移动平均线(MA),目的是识别市场的潜在入场和出场点。它可以生成买入和卖出的信号 alerts,这些 alerts 可以通过手动交易或者自动交易系统来执行。
策略原理
该策略使用两个参数不同的布林带来生成价格通道。布林带的默认参数是长度为20周期,标准差为2。布林带的上轨和下轨分别作为动态的阻力和支撑位。
RSI 指标用于判断价格动量强弱。读取 RSI 的数值来判断是否超买或超卖。
策略中还集成了50周期的移动平均线,用来判断总体趋势方向。当价格高于移动平均线时,表示正在上涨趋势;当价格低于移动平均线时,表示正在下跌趋势。
买入信号的条件:RSI高于超买线且布林带没有收缩。
卖出信号的条件:RSI低于超卖线且布林带没有收缩。
平仓信号的条件:长仓则价格收盘低于移动平均线。短仓则价格收盘高于移动平均线。
策略优势
结合布林带、RSI 和移动平均线三个指标,综合判断趋势方向,避免产生假信号。
布林带判断局部高低点并确认突破,RSI过滤假突破,移动平均线判断总体走势。三者相互验证,精确找出趋势转换点。
策略参数经过优化,布林带使用两个标准差参数,更准确描绘价格通道。
策略风险
布林带收缩时,容易产生错误信号。此时RSI也接近中性区,应避免交易。
震荡趋势中,RSI和移动平均线可能产生错误信号。应预先识别是否处于震荡市场。
无法有效处理价格跳空缺口的情况。应结合其他指标判断真实突破。
策略优化方向
优化布林带和RSI的参数,使其更符合不同品种和时间周期的特点。
增加附加止损位设置。当价格突破止损线时自动止损。
增加趋势过滤器,如ADX,用来判断是否进入趋势行情。减少震荡市无效交易。
结合自动交易系统,利用生成的交易信号自动执行交易,无需人工干预。
总结
该策略整合布林带、RSI和移动平均线三个指标的优势,通过参数优化提高了信号的准确性。可自动生成交易 Alerts 执行策略交易。风险主要在于震荡行情中的错误信号产生。通过趋势判断指标进行过滤可以减少无效交易。整体来说,该策略利用参数优化和多指标集成提高了交易信号质量,值得实盘验证和投入使用。
/*backtest
start: 2023-01-26 00:00:00
end: 2024-02-01 00:00:00
period: 1d
basePeriod: 1h
exchanges: [{"eid":"Futures_Binance","currency":"BTC_USDT"}]
*/

//@version=5
strategy("Bollinger Bands, RSI, and MA Strategy", overlay=true)

// Define input variables
b_len = input(20, title="BB Length")
bb_mult = input(2.0, title="BB Standard Deviation")
bb_deviation1 = input(1.0, title="BB Deviation 1")
rsi_len = input(14, title="RSI Length")
overbought = input(70, title="Overbought RSI Level")
oversold = input(30, title="Oversold RSI Level")
ma_len = input(50, title="MA Length")
stop_loss_percent = input(1.0, title="Stop Loss Percentage")
source = input(close, title="Source")

// Calculate Bollinger Bands
bb_upper = ta.sma(source, b_len) + bb_mult * ta.stdev(source, b_len)
bb_lower = ta.sma(source, b_len) - bb_mult * ta.stdev(source, b_len)
bb_upper1 = ta.sma(source, b_len) + bb_deviation1 * ta.stdev(source, b_len)
bb_lower1 = ta.sma(source, b_len) - bb_deviation1 * ta.stdev(source, b_len)

// Calculate RSI
rsi = ta.rsi(source, rsi_len)

// Calculate Moving Average
ma = ta.sma(source, ma_len)

// Determine if Bollinger Bands are contracting
bb_contracting = ta.stdev(source, b_len) < ta.stdev(source, b_len)[1]

// Entry conditions
enterLong = rsi > overbought and not bb_contracting
enterShort = rsi < oversold and not bb_contracting

// Exit conditions
exitLong = close < ma
exitShort = close > ma

// Exit trades and generate alerts
if strategy.position_size > 0 and exitLong
    strategy.close("Long") // Exit the long trade
    alert("Long Exit", alert.freq_once_per_bar_close)
if strategy.position_size < 0 and exitShort
    strategy.close("Short") // Exit the short trade
    alert("Short Exit", alert.freq_once_per_bar_close)

// Strategy orders
if enterLong
    strategy.entry("Long", strategy.long)
if enterShort
    strategy.entry("Short", strategy.short)
if exitLong
    strategy.close("Long")
if exitShort
    strategy.close("Short")

// Plotting Bollinger Bands
plot(bb_upper, color=color.blue, title="BB Upper 2")
plot(bb_lower, color=color.blue, title="BB Lower 2")
plot(bb_upper1, color=color.red, title="BB Upper 1")
plot(bb_lower1, color=color.red, title="BB Lower 1")

// Plotting RSI
plot(rsi, color=color.orange, title="RSI")

// Plotting Moving Average
plot(ma, color=color.green, title="Moving Average")