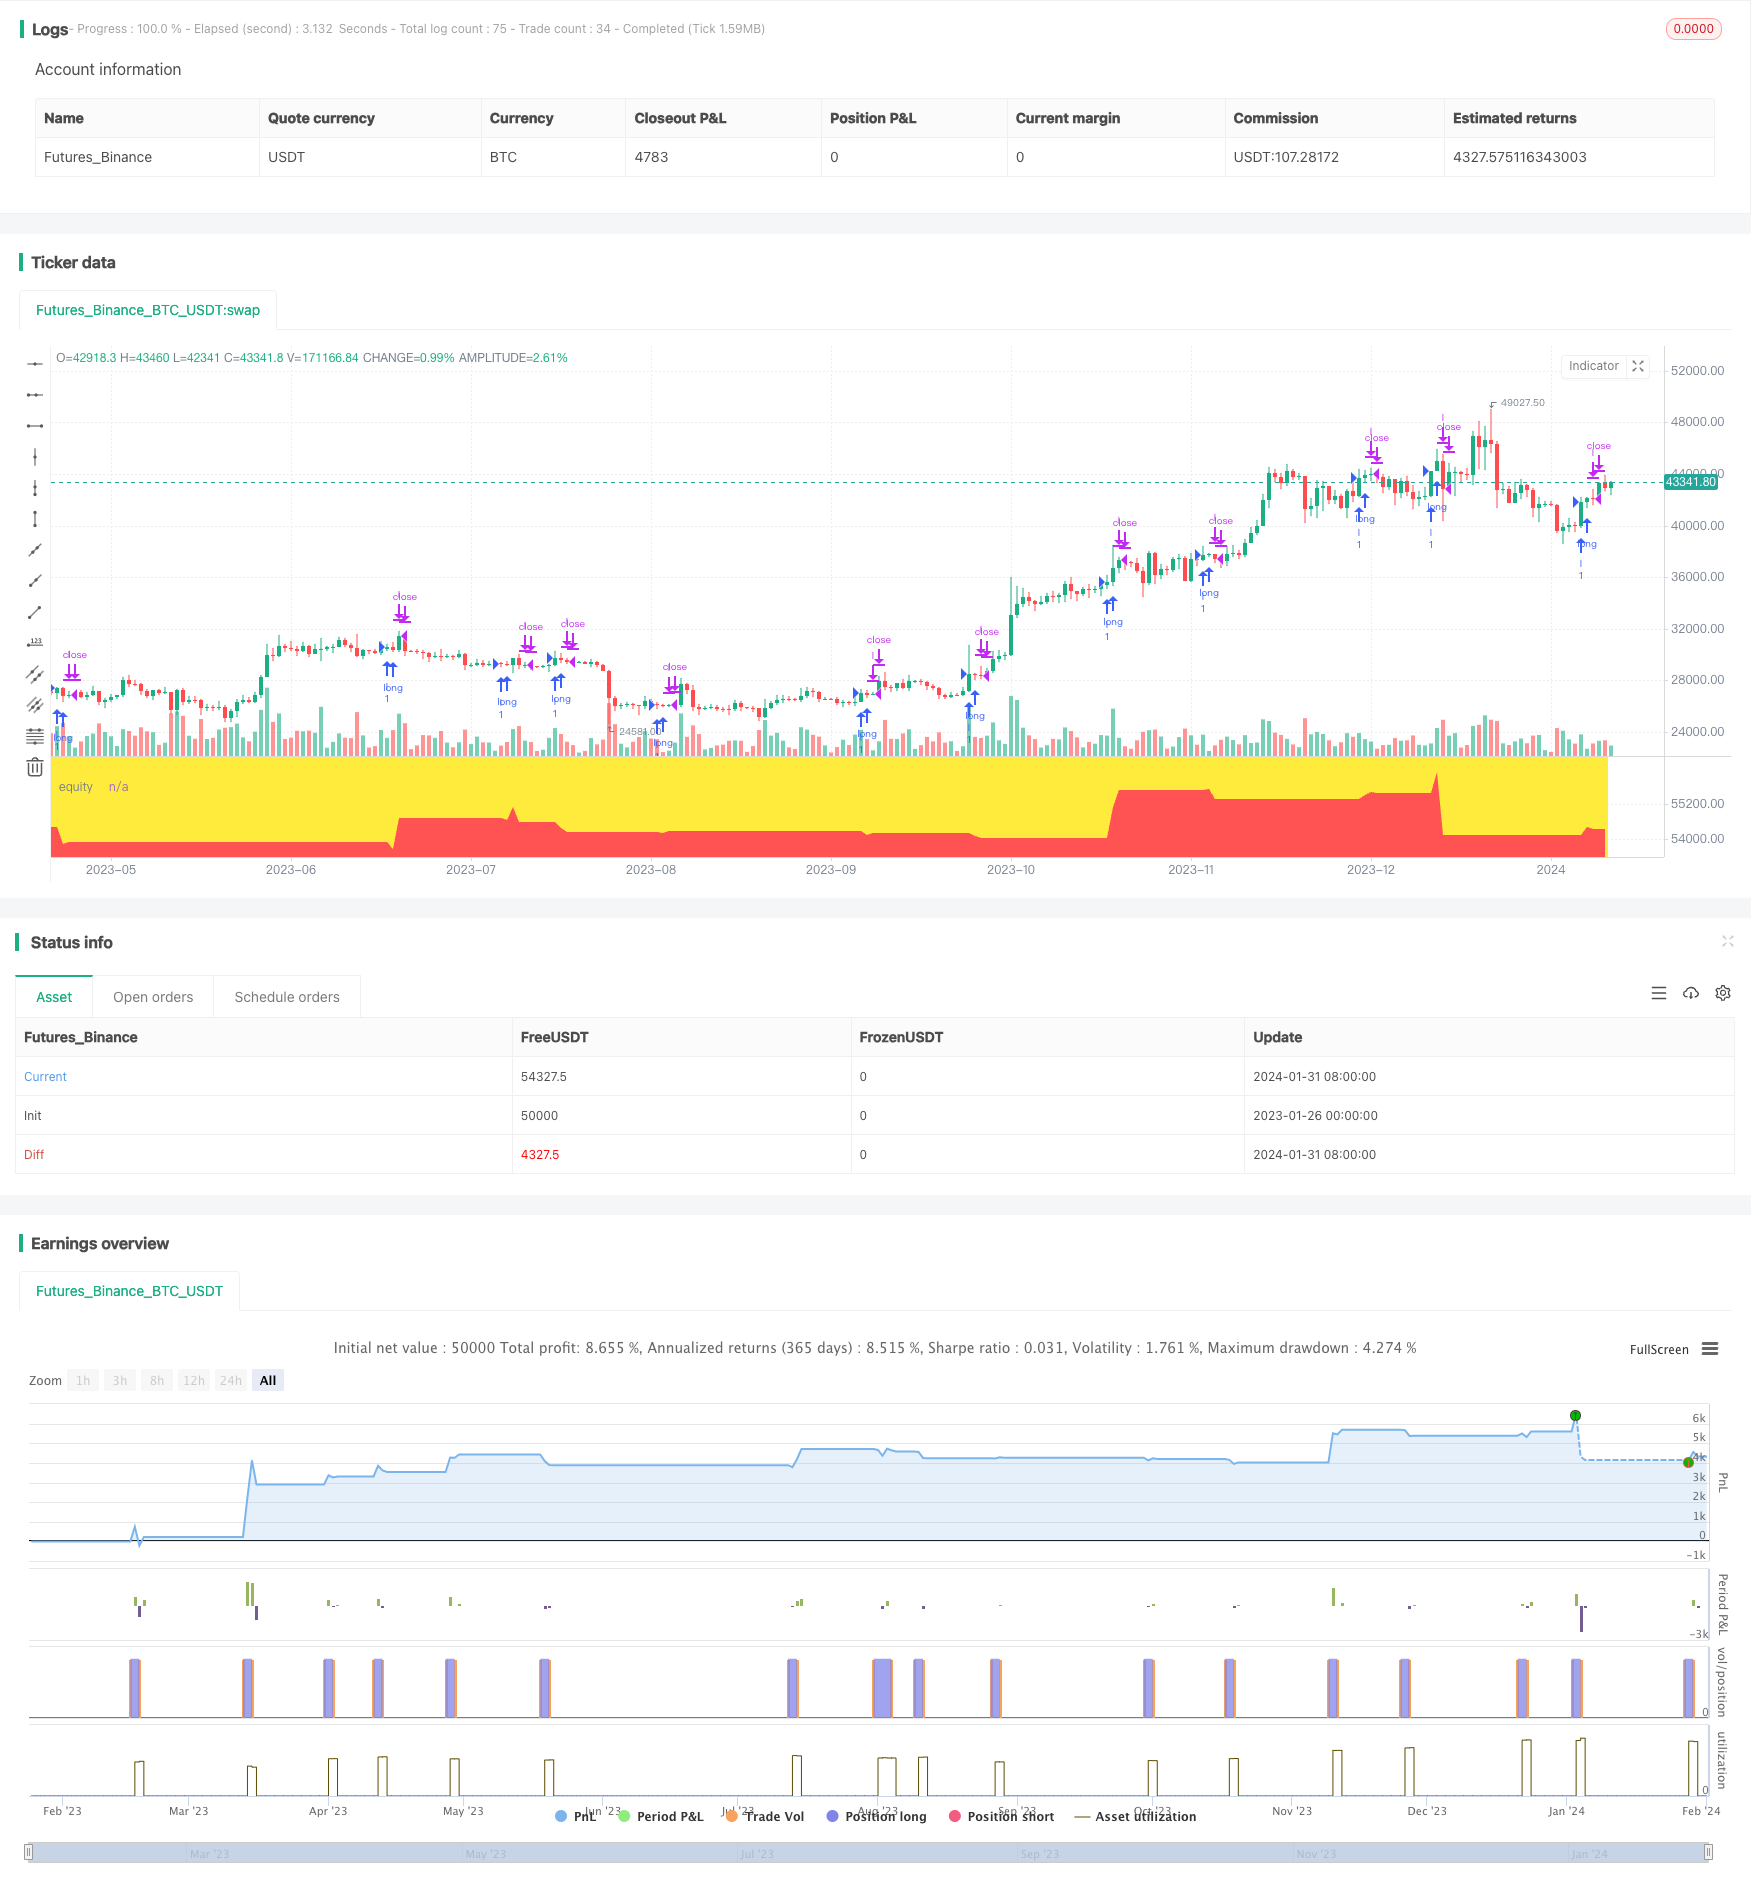
Stoch RSI Based Trend Following Strategy
Author: ChaoZhang, Date: 2024-02-02 11:23:29Tags:

Overview
This strategy is designed based on the Stoch RSI indicator for trend following. It combines the advantages of RSI and Stoch indicators by generating trading signals through Stoch RSI crossovers and adopting a trend tracking mechanism to dynamically adjust stop loss and take profit lines for optimized money management.
Strategy Logic
The strategy calculates the Stoch K and D lines of RSI. It generates buy signals when the K line of Stoch RSI breaks above 20 from the lows. A stop loss based on the lowest lows of previous several K lines is then set, and the stop loss line keeps adjusted upwards dynamically along with the rising price. At the same time, a take profit line is set based on the highest price, and the position will be closed when price hits the take profit line.
Advantage Analysis
This strategy combines the Stoch RSI indicator to determine market trend and crossovers to generate signals, avoiding the limitations of using RSI indicator alone. Meanwhile, the trend tracking mechanism enables the stop loss line to be adjusted upwards constantly according to price movement, avoiding the risk of premature stop loss exit and allowing sustained profit capture during trending moves. Additionally, the RSI indicator itself has a relatively good win rate.
Risk Analysis
This strategy relies mainly on the Stoch RSI indicator for trend and crossover signal generation. Incorrect signals from the indicator itself poses some risks. Besides, in range-bound markets, the frequently triggered stop loss and take profit lines may affect the strategy’s profitability. Risks could be reduced through parameter optimization.
Optimization Directions
- Optimize parameters of Stoch RSI, adjust smoothing pace of K and D lines to lower incorrect signal probability
- Optimize settings of stop loss and take profit to improve parameter robustness
- Add filtering conditions to avoid whipsaws in ranging markets
- Incorporate position sizing mechanisms based on market conditions
Conclusion
This strategy integrates the advantages of the Stoch RSI indicator and adopts a trend tracking mechanism to effectively identify trending moves and dynamically adjust stops and targets to improve profit capture probability. Further enhancement in stability and tracking ability could be achieved through parameter optimization. Overall speaking, this strategy allows profits while controlling risks and is worth live testing.
/*backtest
start: 2023-01-26 00:00:00
end: 2024-02-01 00:00:00
period: 1d
basePeriod: 1h
exchanges: [{"eid":"Futures_Binance","currency":"BTC_USDT"}]
*/

//@version=2

strategy("sdf",calc_on_every_tick=true,precision=8,
     default_qty_type=strategy.fixed,currency="USD")
//entradas y variables de indicadores
smoothK = input(3, minval=1)
smoothD = input(3, minval=1)
lengthRSI = input(14, minval=1)
lengthStoch = input(14, minval=1)
src = input(close, title="RSI Source")
rsi1 = rsi(src, lengthRSI)
k = sma(stoch(rsi1, rsi1, rsi1, lengthStoch), smoothK)
d = sma(k, smoothD)
overbought=input(80)
oversold=input(20)
//entradas de stop , trail, profit
stop=input(1500)
stop_dentro_de_los_ultimos_lows=input(20)
trail_points=input(500)
trail_offset=input(100)
profit=input(1000)
riesgo_en_dolares=input(15)
marsi=sma(rsi(close,14),14)
//condicion de compra: k>80
buycondition=crossover(k,20) and security(syminfo.ticker,"240",rsi(close,14)>marsi)
bgcolor( security(syminfo.ticker,"240",rsi(close,14)>marsi) ? yellow : na , transp=0)

if year>2014
    strategy.entry("l",strategy.long,qty=1,when=buycondition)
    velasiguente=barssince(buycondition)+1  //cierre en cada vela nueva independientemente si subeObaja.FUNCIONANDO
    strategy.close("l",when=velasiguente>2)       //cierre en cada vela nueva independientemente si subeObaja.FUNCIONANDO
    //paradaMasBajo=lowest(low,stop_dentro_de_los_ultimos_lows)//stop_dentro_de_los_ultimos_lows, NO PROBADA
    //strategy.exit("l",loss=paradaMasBajo,profit=profit)
plot(strategy.equity, title="equity", color=red, linewidth=2, style=areabr)
- Trend Following RSI Scalping Strategy
- Spiral Cross Strategy with Moving Average Confirmation
- Gold Cross Dead Cross Quantitative Trading Strategy
- Dual Moving Average Strategy 360°
- Open High Close Low Breakout Trading Strategy
- Double Exponential Moving Average Quant Trading Strategy
- Dynamic SMMA and SMA Crossover Strategy
- Trend Following Strategy Based on Bollinger Bands, RSI and Moving Average
- Trend Trading Strategy Based on MACD Indicator
- Stochastic & Moving Average Strategy with Double Filters
- Single Point Moving Average Breakout Strategy
- Moving Average Crossover Strategy
- SuperTrend Strategy
- Parabolic Period and Bollinger Band Combined Moving Stop Loss Strategy
- Moving Average Price Based Trading Strategy
- Ergotic Momentum Direction Convergence Trading Strategy
- Moving Average and Stochastic Trading Strategy
- An Optimization of Dual Moving Average Trend Following Strategy Based on Indicators Combination
- The Efficient Quant Trading Strategy Combining
- Dual Moving Average Crossover and Williams Indicator Combo Strategy